Maximizing Methane Yield: A Scientific Guide to Enzymatic Pretreatment of Lignocellulosic Biomass for Advanced Biogas Production
This comprehensive review examines the critical role of enzymatic pretreatment in enhancing the anaerobic digestion of lignocellulosic biomass for biomethane production.
Maximizing Methane Yield: A Scientific Guide to Enzymatic Pretreatment of Lignocellulosic Biomass for Advanced Biogas Production
Abstract
This comprehensive review examines the critical role of enzymatic pretreatment in enhancing the anaerobic digestion of lignocellulosic biomass for biomethane production. Targeting researchers and bioprocess engineers, the article explores the foundational science behind lignocellulose recalcitrance and enzyme mechanisms. It details current methodologies for enzyme selection, application protocols, and reactor integration. The content addresses common operational challenges and optimization strategies for cost-effectiveness and efficiency. Finally, it provides a rigorous validation framework, comparing enzymatic pretreatment against physical and chemical alternatives through lifecycle and techno-economic analyses. The synthesis offers evidence-based guidance for implementing scalable, sustainable biomethane technologies in the bioenergy sector.
Deconstructing Recalcitrance: The Science of Lignocellulose and Enzymatic Hydrolysis
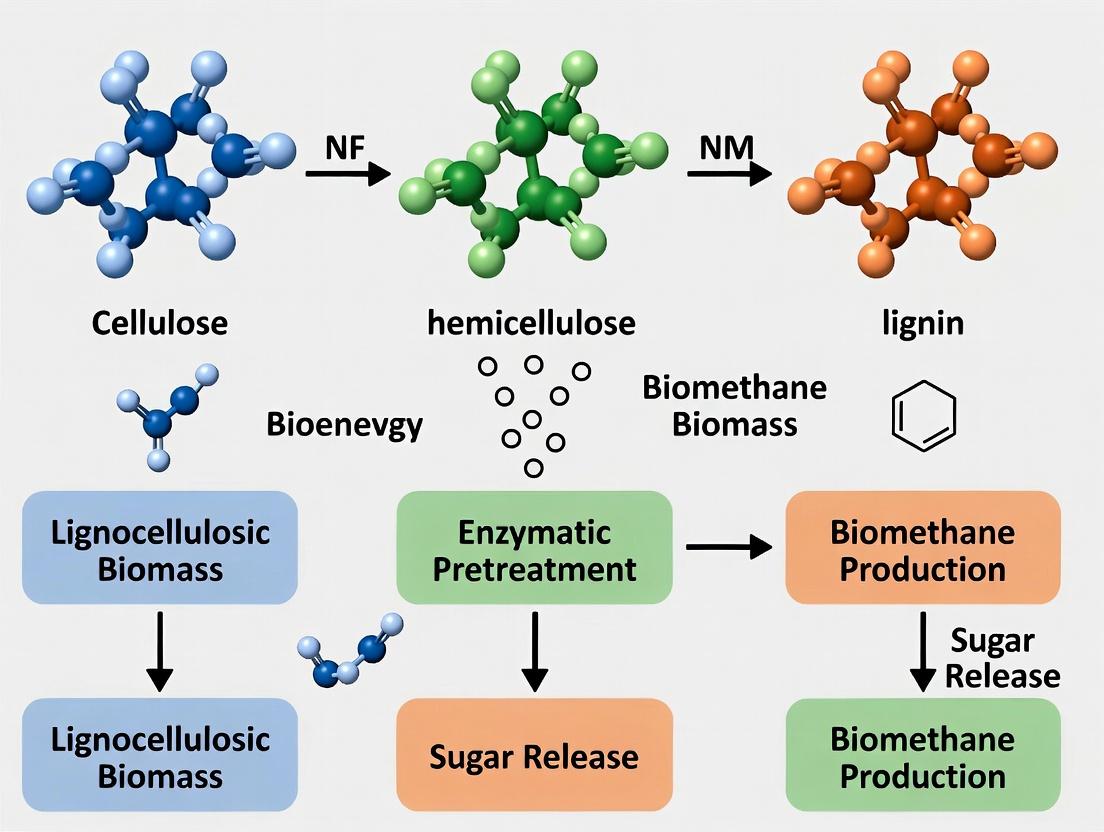
Lignocellulosic biomass is a promising, renewable substrate for anaerobic digestion (AD) to produce biomethane. However, its complex and rigid structure—comprising cellulose, hemicellulose, and lignin—imposes a significant barrier known as "biomass recalcitrance." This recalcitrance limits enzymatic and microbial access, resulting in slow hydrolysis rates, prolonged retention times, and low methane yields. Within the broader thesis on enzymatic pretreatment for enhanced biomethane, this document details the application notes and experimental protocols for systematically analyzing recalcitrance and evaluating pretreatment efficacy.
Quantitative Analysis of Biomass Recalcitrance
A critical first step is the compositional analysis of the feedstock. Standardized methods provide quantitative data essential for benchmarking.
Table 1: Standardized Compositional Analysis of Representative Lignocellulosic Biomasses (Data from NREL Protocols)
| Biomass Type | Cellulose (% Dry Mass) | Hemicellulose (% Dry Mass) | Lignin (% Dry Mass) | Ash (% Dry Mass) | Theoretical Methane Potential (L CH₄/g VS)* |
|---|---|---|---|---|---|
| Corn Stover | 35-40 | 20-25 | 15-20 | 4-6 | 0.40 - 0.42 |
| Wheat Straw | 33-38 | 20-25 | 15-20 | 5-8 | 0.38 - 0.41 |
| Miscanthus | 40-45 | 20-25 | 20-25 | 2-4 | 0.39 - 0.43 |
| Poplar Wood | 40-45 | 20-25 | 20-28 | <1 | 0.35 - 0.38 |
| Dairy Manure Fiber | 18-25 | 10-15 | 10-15 | 15-25 | 0.20 - 0.25 |
*Calculated based on the Buswell equation and component degradability. VS = Volatile Solids.
Protocol 1.1: Determination of Structural Carbohydrates and Lignin in Biomass (Based on NREL LAP-002)
- Objective: Quantify the fractional composition of extractives, structural carbohydrates (cellulose, hemicellulose), and lignin.
- Materials: Air-dried biomass milled to <1 mm particle size; 72% (w/w) sulfuric acid; 4% (w/w) sulfuric acid; Autoclave; HPLC system with appropriate columns (e.g., Aminex HPX-87P for sugars).
- Procedure:
- Extractives Removal: Perform Soxhlet extraction with water and ethanol to remove non-structural materials. Dry the residual biomass.
- Primary Hydrolysis: Weigh 300 mg of extractive-free biomass into a pressure tube. Add 3.0 mL of 72% H₂SO₄. Incubate at 30°C for 60 min with frequent stirring.
- Secondary Hydrolysis: Dilute the acid to 4% by adding 84 mL deionized water. Autoclave the mixture at 121°C for 1 hour.
- Analysis: Cool, filter, and neutralize the hydrolysate. Analyze the sugar monomers (glucose, xylose, arabinose, etc.) via HPLC. The acid-insoluble residue is quantified as Klason Lignin.
Enzymatic Pretreatment Protocol for Recalcitrance Reduction
This protocol outlines a targeted enzymatic approach to disrupt lignocellulose prior to AD.
Protocol 2.1: Bench-Scale Enzymatic Pretreatment of Biomass
- Objective: To hydrolyze hemicellulose and/or lignin selectively, thereby increasing cellulose accessibility for subsequent microbial digestion.
- Materials: Milled biomass; Laccase (EC 1.10.3.2) for lignin modification; Xylanase (EC 3.2.1.8) for hemicellulose hydrolysis; Cellulase cocktail (e.g., CTec2 from Novozymes) for saccharification assessment; Sodium acetate buffer (pH 4.8-5.0); Incubator shaker.
- Procedure:
- Substrate Preparation: Prepare a 10% (w/v) slurry of dry biomass in 50 mM sodium acetate buffer (pH 5.0) in a 250 mL Erlenmeyer flask.
- Enzyme Loading: Apply one of the following enzyme regimes per gram of dry biomass:
- Laccase-Mediated System: 20 U laccase, 1 mM ABTS (mediator). Incubate at 40°C, 150 rpm, for 48-72 hours.
- Hemicellulase System: 50 U xylanase. Incubate at 50°C, 150 rpm, for 24 hours.
- Combined System: Sequential or simultaneous application of laccase and xylanase.
- Reaction Termination: Heat the mixture at 90°C for 10 min to denature enzymes.
- Analysis of Efficacy: Centrifuge. Analyze the supernatant for soluble reducing sugars (DNS assay) and phenolic compounds (Folin-Ciocalteu assay). Use the solid fraction for subsequent BMP assays or microscopy.
Experimental Workflow for Pretreatment Evaluation
The following diagram illustrates the integrated workflow from feedstock characterization to biomethane validation.
Title: Workflow for Evaluating Enzymatic Pretreatment Efficacy
The Scientist's Toolkit: Key Research Reagent Solutions
Table 2: Essential Reagents and Materials for Lignocellulosic Biomass Research
| Item | Function / Relevance | Example / Notes |
|---|---|---|
| CTec2/3 (Novozymes) | Commercial cellulase/hemicellulase cocktail. | Benchmark for saccharification efficiency and pretreatment validation. |
| Laccase (from Trametes versicolor) | Lignin-modifying peroxidase. | Used to disrupt lignin polymer, reducing its steric hindrance. Often requires redox mediators (e.g., ABTS). |
| Xylanase (EC 3.2.1.8) | Endo-1,4-β-xylanase. | Targets hemicellulose backbone, solubilizing xylans to expose cellulose. |
| ABTS (2,2'-azino-bis(3-ethylbenzothiazoline-6-sulfonic acid)) | Redox mediator for laccase. | Enhances electron transfer, increasing the enzyme's oxidative capacity on lignin. |
| DNS Reagent (3,5-Dinitrosalicylic acid) | Colorimetric assay for reducing sugars. | Quantifies liberated monosaccharides post-pretreatment/hydrolysis. |
| Anaerobic Inoculum | Active microbial consortium for BMP tests. | Typically sourced from an active biogas plant digesting similar feedstocks. |
| BMP Bottles with Gas-Tight Septa | For standardized biomethane potential assays. | Allows periodic sampling of biogas composition (CH₄/CO₂) via GC. |
Biochemical Methane Potential (BMP) Assay Protocol
The ultimate validation of pretreatment success is the increase in biomethane yield.
Protocol 3.1: Standardized BMP Assay (Based on VDI 4630 Guidelines)
- Objective: Determine the specific methane yield of raw and enzymatically pretreated biomass.
- Materials: 500 mL serum bottles; Anaerobic inoculum (granular sludge); Substrate (raw/pretreated biomass); Positive control (microcrystalline cellulose); Negative control (inoculum only); Gas-tight syringes; Gas Chromatograph (GC) with TCD/FID.
- Procedure:
- Setup: Weigh substrate into bottles to achieve an inoculum-to-substrate volatile solids (VS) ratio of 2:1. Add inoculum to a total working volume of 400 mL. Flush headspace with N₂/CO₂ (70:30) for 2 min. Incubate at 37°C (±1°C).
- Gas Measurement: Measure total biogas pressure daily using a manometer. Withdraw gas samples with a gas-tight syringe for GC analysis to determine methane percentage.
- Calculation & Validation: Calculate cumulative methane production normalized to VS of substrate added. Correct by subtracting the methane from negative controls. The positive control (cellulose) should yield 340-380 NmL CH₄/g VS.
- Data Interpretation: Compare the methane production kinetics and final yield of pretreated vs. raw biomass to quantify the enhancement factor.
The following diagram summarizes the inhibitory pathways of lignin and the targeted action of enzymatic pretreatments within the AD process.
Title: Lignin Inhibition and Enzymatic Pretreatment Targets in AD
The enzymatic pretreatment of lignocellulosic biomass (e.g., agricultural residues, energy crops) is a critical, sustainable step to enhance biomethane yield in anaerobic digestion. This process targets the recalcitrant lignocellulosic matrix—composed of cellulose (40-60%), hemicellulose (20-40%), and lignin (10-25%)—to increase substrate accessibility for methanogenic archaea. This article details the hydrolytic enzyme arsenal, focusing on the specific modes of action of cellulases, hemicellulases, and the oxidative enzyme laccase. The protocols herein support research within a broader thesis aiming to optimize enzyme cocktails for maximal biomethane potential.
Key Enzymes: Modes of Action & Quantitative Data
Cellulase System
Cellulases hydrolyze β-1,4-glycosidic bonds in cellulose. They operate synergistically (Trichoderma reesei is the benchmark organism).
- Endoglucanase (EG, EC 3.2.1.4): Acts randomly on internal amorphous regions of cellulose, creating new chain ends.
- Cellobiohydrolase (CBH, Exoglucanase, EC 3.2.1.91): Processively cleaves cellobiose units from reducing (CBH I) or non-reducing (CBH II) ends of cellulose chains.
- β-Glucosidase (BG, EC 3.2.1.21): Hydrolyzes cellobiose and short-chain cello-oligosaccharides to glucose, relieving product inhibition on CBHs and EGs.
Table 1: Representative Cellulase Activities & Conditions
| Enzyme (Type) | Optimal pH | Optimal Temp (°C) | Specific Activity (U/mg)* | Key Cofactor/Ion |
|---|---|---|---|---|
| Endoglucanase (EG) | 4.5 - 5.5 | 50 - 60 | 40-120 (on CMC) | None |
| Cellobiohydrolase I (CBH I) | 4.5 - 5.0 | 50 - 55 | 5-30 (on Avicel) | None |
| β-Glucosidase (BG) | 4.5 - 5.5 | 45 - 60 | 20-80 (on cellobiose) | None |
*Activity units (U) = μmol product formed per minute.
Hemicellulase System
A diverse group targeting heteropolysaccharides like xylan, mannan, and xyloglucan.
- Endo-1,4-β-xylanase (EC 3.2.1.8): Cleaves internal β-1,4 bonds in xylan backbone.
- β-Xylosidase (EC 3.2.1.37): Hydrolyzes xylooligosaccharides to xylose.
- Accessory Enzymes (Debranching): α-L-Arabinofuranosidase, α-glucuronidase, acetyl xylan esterase, and ferulic acid esterase remove side-chain substitutions.
Table 2: Representative Hemicellulase Activities & Conditions
| Enzyme | Primary Substrate | Optimal pH | Optimal Temp (°C) | Key Function |
|---|---|---|---|---|
| Endo-1,4-β-xylanase | Xylan | 4.5 - 6.5 | 50 - 70 | Backbone depolymerization |
| β-Xylosidase | Xylobiose/Oligos | 4.5 - 6.0 | 45 - 60 | Monomer production |
| α-L-Arabinofuranosidase | Arabinoxylan | 3.5 - 6.0 | 40 - 60 | Removes arabinose side chains |
| Acetyl xylan esterase | Acetylated xylan | 5.0 - 7.5 | 40 - 55 | Removes acetyl groups |
Laccase (EC 1.10.3.2)
A multi-copper oxidase that catalyzes the one-electron oxidation of phenolic subunits in lignin, using O₂ as an electron acceptor, producing water and phenoxy radicals. These radicals undergo subsequent non-enzymatic cleavage or repolymerization. In biomass pretreatment, they are often used with redox mediators (e.g., ABTS, HBT) to attack non-phenolic lignin.
Table 3: Representative Laccase Activity & Conditions
| Enzyme Source | Optimal pH (Phenolic) | Optimal Temp (°C) | Typical Activity (U/mL)* | Common Mediator |
|---|---|---|---|---|
| Trametes versicolor | 4.5 - 5.0 | 40 - 50 | 20-100 | ABTS, HBT |
| Bacillus pumilus | 6.5 - 8.0 | 60 - 70 | 5-50 | Syringaldehyde |
*Activity on ABTS or syringaldazine.
The Scientist's Toolkit: Research Reagent Solutions
Table 4: Essential Reagents for Enzymatic Pretreatment Research
| Reagent/Material | Function in Research | Example Product/Specification |
|---|---|---|
| Microcrystalline Cellulose (Avicel PH-101) | Insoluble, crystalline substrate for measuring exoglucanase (CBH) activity. | Sigma-Aldrich 11365 |
| Carboxymethyl Cellulose (CMC), Sodium salt | Soluble, amorphous substrate for measuring endoglucanase (EG) activity. | Sigma-Aldrich 419273 |
| Beechwood Xylan | Standard substrate for assaying endoxylanase activity. | Megazyme P-XYLNBE |
| p-Nitrophenyl Glycosides (pNPG, pNPX, etc.) | Chromogenic substrates for measuring β-glucosidase, β-xylosidase, etc. | Sigma-Aldrich N7006 (pNPG) |
| ABTS (2,2'-azino-bis(3-ethylbenzothiazoline-6-sulfonic acid)) | Redox mediator and chromogenic substrate for laccase activity assays. | Sigma-Aldrich A1888 |
| Lignocellulosic Biomass Standard | Uniform substrate for pretreatment studies (e.g., corn stover, wheat straw). | NIST RM 8495 (Sorghum) |
| DNS Reagent (3,5-Dinitrosalicylic Acid) | Colorimetric method for quantifying reducing sugars released by hydrolases. | Prepared per Miller, 1959 |
| Anaerobic Digestion Inoculum | Source of methanogenic microbes for biomethane potential (BMP) assays. | From active biogas plant (mesophilic) |
| MES/Tris/Citrate-Phosphate Buffers | For maintaining precise pH during enzymatic hydrolysis across a broad range. | 50 mM, pH 4.5 - 7.0 |
Application Notes & Detailed Protocols
Protocol 1: Standard Assay for Total Cellulase Activity (Filter Paper Assay, FPU)
Application: Determining the total synergistic cellulase activity of a crude enzyme cocktail. Principle: Measures reducing sugars released from a defined filter paper strip in 1 hour. Procedure:
- Preparation: Prepare 50 mM sodium citrate buffer (pH 4.80). Pre-incubate buffer at 50°C.
- Substrate: Cut Whatman No. 1 filter paper into 1.0 x 6.0 cm strips (50 ± 2.5 mg). Place one strip into a test tube (e.g., 16 x 150 mm).
- Reaction: Add 1.0 mL of buffer and 0.5 mL of appropriately diluted enzyme solution to the tube. Vortex briefly. Incubate in a water bath at 50°C for 60 minutes.
- Termination & Development: Add 3.0 mL of DNS reagent. Immediately vortex.
- Color Development: Place all tubes in a boiling water bath for 5 minutes. Cool in an ice-water bath.
- Quantification: Dilute with 16 mL water. Mix and read absorbance at 540 nm against a reagent blank (enzyme added after DNS). Determine glucose concentration from a standard curve (0-2 mg/mL glucose).
- Calculation: One Filter Paper Unit (FPU) is defined as the amount of enzyme that releases 2 mg of glucose (as reducing sugar equivalents) in 60 minutes under the assay conditions. Calculate dilution required to achieve exactly 2.0 mg release.
Protocol 2: Biomethane Potential (BMP) Assay Following Enzymatic Pretreatment
Application: Quantifying the enhancement in biomethane yield from pretreated biomass. Principle: Anaerobic batch digestion of pretreated and untreated biomass in sealed serum bottles, with periodic measurement of biogas production and composition. Procedure:
- Pretreatment: Treat 5g (dry weight) of milled biomass (e.g., wheat straw, <2mm) with an optimized enzyme cocktail (e.g., 15 FPU cellulase + 30 U xylanase + 10 U laccase/g biomass) in 50 mL buffer (pH 5.0) at 50°C, 150 rpm for 48h. Include an untreated control (buffer only).
- Inoculum Preparation: Use anaerobic digester sludge. Degas under N₂/CO₂ (80:20) for 1 week to reduce background gas. Determine its volatile solids (VS) content.
- BMP Setup: Use 500-1000 mL serum bottles. Add pretreated biomass slurry (equivalent to 1-2 g VS). Add inoculum to achieve an inoculum-to-substrate VS ratio of 2:1. Dilute to 500 mL working volume with anaerobic mineral medium. Maintain a blank (inoculum only) and positive control (microcrystalline cellulose).
- Anaerobic Conditions: Flush headspace with N₂/CO₂ (80:20) for 2 min. Seal with butyl rubber stoppers and aluminum crimps.
- Incubation: Incubate at mesophilic temperature (37±1°C) with gentle shaking (<100 rpm) for 30-60 days.
- Biogas Measurement: Measure biogas pressure daily/weekly using a manometer. Sample gas with a pressure-lock syringe for CH₄/CO₂ analysis via GC-TCD.
- Calculation: Correct net biogas and methane production from the sample by subtracting the blank's production. Express final yield as NmL CH₄ per g VS of substrate added.
Visualization of Pathways and Workflows
Diagram Title: Enzymatic Biomass Pretreatment Workflow
Diagram Title: Cellulase Synergistic Action Pathway
1. Introduction & Context
Within the broader thesis on Enzymatic Pretreatment of Lignocellulosic Biomass for Enhanced Biomethane Production, the efficient deconstruction of the plant cell wall is a paramount challenge. The recalcitrance is largely due to lignin-carbohydrate complexes (LCCs), which form a covalent and non-covalent matrix that shields cellulose and hemicellulose from microbial and enzymatic attack. Monoenzyme pretreatments show limited efficacy. This application note details how strategically formulated enzyme cocktails, leveraging synergistic interactions between multiple enzyme classes, are essential to disrupt LCCs, liberate fermentable sugars, and ultimately improve biomethane yields from anaerobic digestion.
2. Data Presentation: Comparative Efficacy of Enzyme Cocktails
Table 1: Sugar Release and Methane Yield from Corn Stover Pretreated with Different Enzyme Formulations
| Enzyme Cocktail Composition | Total Sugar Release (mg/g biomass) | Glucose:Xylose Ratio | Subsequent BMP (mL CH₄/g VS) | Reference |
|---|---|---|---|---|
| Cellulase Only (Control) | 158 ± 12 | 4.5:1 | 212 ± 15 | (Current Study) |
| Cellulase + Xylanase | 289 ± 18 | 2.2:1 | 278 ± 20 | (Current Study) |
| Cellulase + Xylanase + LAAO* | 415 ± 22 | 2.1:1 | 320 ± 18 | (Current Study) |
| Commercial "Lignase" Cocktail | 380 ± 25 | 2.3:1 | 305 ± 22 | (Lee et al., 2023) |
LAAO: Lignin-Activating Aryl Alcohol Oxidase. BMP: Biochemical Methane Potential.
Table 2: Synergy Index (SI) for Key Enzyme Combinations on Isolated LCCs
| Enzyme Combination | Measured Output | SI (Observed / Calculated Sum) | Interpretation |
|---|---|---|---|
| Endoglucanase (EG) + β-Glucosidase (BG) | Cellobiose to Glucose | 1.1 ± 0.1 | Mild Synergy |
| Xylanase (Xyn) + Feruloyl Esterase (FAE) | Ferulic Acid Release | 2.8 ± 0.3 | Strong Synergy |
| Laccase (Lac) + Manganese Peroxidase (MnP) | Lignin Solubilization | 1.9 ± 0.2 | Moderate Synergy |
| EG + Xyn + FAE | Total Reducing Sugars | 3.2 ± 0.4 | High Multiplicative Synergy |
3. Experimental Protocols
Protocol 3.1: Assessing Synergistic Hydrolysis of Native LCC Substrates
Objective: To quantify the synergistic release of sugars and phenolic compounds from ball-milled lignocellulosic biomass using custom enzyme cocktails.
Materials: See "The Scientist's Toolkit" below.
Procedure:
- Substrate Preparation: Mill biomass (e.g., corn stover, wheat straw) to 80-mesh size. Prepare 5% (w/v) suspensions in 50 mM citrate-phosphate buffer (pH 5.0).
- Enzyme Dosing: Prepare cocktail solutions. Standard dose: 20 mg total protein per g dry biomass. Vary ratios (e.g., 70:20:10 Cellulase:Xylanase:Auxiliary).
- Hydrolysis Reaction: Add enzyme cocktail to substrate suspension in a baffled flask. Incubate at 50°C with agitation at 150 rpm for 72 hours.
- Sampling & Quenching: Withdraw 1 mL aliquots at 0, 2, 6, 12, 24, 48, 72h. Immediately heat at 95°C for 10 min to denature enzymes, then centrifuge at 13,000 x g for 5 min.
- Analysis:
- Reducing Sugars: Use DNS assay.
- Mono-saccharides: Analyze supernatant by HPLC-RID (Aminex HPX-87P column).
- Phenolic Compounds: Analyze supernatant by HPLC-DAD for ferulic acid, p-coumaric acid.
Protocol 3.2: Biochemical Methane Potential (BMP) Assay Post-Enzymatic Pretreatment
Objective: To determine the enhancement in biomethane production from enzymatically pretreated biomass.
Procedure:
- Pretreatment: Hydrolyze biomass as per Protocol 3.1. Do not quench after 72h. Instead, heat entire sample at 80°C for 20 min to stop reaction without removing liquid hydrolysate.
- Inoculum Preparation: Use anaerobic digester sludge. Pre-incubate for 5 days to deplete residual biodegradable material.
- BMP Setup: Use 500 mL serum bottles. Add:
- Whole pretreated slurry (equivalent to 2 g VS substrate).
- Inoculum (1 g VS).
- Basal nutrient medium.
- Adjust to 400 mL working volume with deionized water.
- Controls: Set up positive control (cellulose), negative control (inoculum only), and untreated biomass control.
- Anaerobic Incubation: Flush headspace with N₂/CO₂ (70:30), seal, incubate at 37°C for 30+ days.
- Methane Measurement: Periodically measure biogas volume and composition via gas-tight syringe and GC-TCD. Cumulative methane production is modeled using the modified Gompertz equation.
4. Mandatory Visualization
Title: Synergistic Enzyme Action on LCC Deconstruction
Title: Workflow from Enzymatic Pretreatment to BMP Assay
5. The Scientist's Toolkit: Key Research Reagent Solutions
Table 3: Essential Materials for LCC Enzymatic Deconstruction Studies
| Reagent/Material | Function & Rationale | Example/Supplier |
|---|---|---|
| Multi-Enzyme Cocktails | Core hydrolytic activity. Commercial blends (Cellic CTec3) or lab-prepared mixes of purified enzymes. | Sigma-Aldrich, Novozymes |
| Purified Auxiliary Activity (AA) Enzymes | Target LCC linkages (ester, ether). Critical for synergy studies. | Recombinant FAE, Laccase (Megazyme) |
| Native LCC Substrate | Physiologically relevant substrate. Isolated from biomass using non-degradative methods. | Prepared in-lab from oat husks or bagasse. |
| Anaerobic Digester Inoculum | Source of methanogenic consortia for BMP assays. Must be well-characterized. | Collected from local wastewater treatment plant. |
| HPLC Columns & Standards | Quantify mono-saccharides, organic acids, and phenolic monomers released. | Bio-Rad Aminex HPX-87H, Sigma sugar/acid standards. |
| Biogas Analysis GC-TCD | Measure methane content and volume in BMP assays. Essential for yield calculation. | Agilent GC system with TCD, Supelco Carboxen column. |
Within the broader thesis on enzymatic pretreatment of lignocellulosic biomass for enhanced biomethane production, the inherent variability of feedstocks presents a primary challenge. The biochemical and structural composition—primarily the ratios of cellulose, hemicellulose, and lignin—varies significantly across agricultural residues, forestry biomass, and organic waste streams. This variability directly dictates the selection, optimization, and efficacy of pretreatment strategies necessary to facilitate enzymatic hydrolysis and subsequent anaerobic digestion. This application note details how composition influences pretreatment choice and provides standardized protocols for researchers.
Feedstock Composition and Pretreatment Implications
Table 1: Typical Composition and Recommended Pretreatment Strategies by Feedstock Type
| Feedstock Category | Example Feedstocks | Cellulose (%) | Hemicellulose (%) | Lignin (%) | Ash (%) | Key Pretreatment Strategy | Rationale |
|---|---|---|---|---|---|---|---|
| Agricultural Residues | Corn stover, Wheat straw, Rice husk | 35-45 | 20-30 | 15-20 | 5-15 | Dilute Acid, Alkaline (NaOH, Ca(OH)₂) | Effective hemicellulose solubilization (acid) or lignin disruption/removal (alkaline) for moderate lignin content. |
| Forestry Biomass | Poplar, Pine, Spruce | 40-50 | 20-30 | 25-35 | <1 | Steam Explosion, Organosolv, Sulfite Pretreatment | Robust methods needed to overcome high lignin content and recalcitrant structure. Often require harsh conditions. |
| Organic Wastes | Food waste, Yard waste, Paper sludge | 15-40 | 10-25 | 5-20 | 5-40 | Mechanical, Hydrothermal, Biological | Highly variable; often target physical disaggregation and mild chemical/biological action due to lower lignin but high moisture/ash. |
Experimental Protocols
Protocol 1: Compositional Analysis for Pretreatment Selection (NREL/TP-510-42618)
Objective: Quantify structural carbohydrates and lignin in biomass to inform pretreatment strategy. Materials: Air-dried, milled biomass (<2 mm), 72% (w/w) H₂SO₄, HPLC system with refractive index detector, calibrated for sugars (glucose, xylose, arabinose, etc.). Procedure:
- Perform extractives removal via Soxhlet extraction with ethanol.
- Weigh 300 mg (± 10 mg) of extractives-free biomass into a pressure tube.
- Add 3.0 mL of 72% H₂SO₄, stir, and incubate at 30°C for 60 minutes.
- Dilute to 4% H₂SO₄ concentration by adding 84 mL deionized water.
- Hydrolyze the sample in an autoclave at 121°C for 60 minutes.
- Neutralize the hydrolysate with calcium carbonate.
- Filter and analyze the liquid fraction via HPLC for monomeric sugar content (correcting for degradation).
- Determine acid-insoluble lignin gravimetrically from the filtered solid residue after drying at 105°C.
Protocol 2: Enzymatic Pretreatment Screening Assay
Objective: Evaluate the efficacy of different enzymatic pretreatment cocktails on varied feedstocks for subsequent biomethane potential. Materials: Pretreated biomass slurry, Commercial cellulase (e.g., CTec2), hemicellulase (e.g., HTec2), and laccase or lignin-modifying enzyme cocktails, 50 mM sodium citrate buffer (pH 4.8-5.0), Anaerobic digester inoculum. Procedure:
- Substrate Preparation: Adjust pretreated biomass to 5% total solids (w/v) in citrate buffer.
- Enzymatic Hydrolysis: Set up reactions with 10 g slurry in sealed serum bottles. Add enzyme cocktails at varying loadings (e.g., 5-30 mg protein/g glucan). Include no-enzyme controls.
- Incubation: Incubate at 50°C with mild agitation (150 rpm) for 72 hours.
- Sampling: Withdraw 1 mL liquid sample at 0, 24, 48, 72h. Centrifuge, filter (0.2 µm), and analyze for sugar monomers via HPLC.
- Biomethane Potential (BMP) Linkage: Terminate hydrolysis by heating to 90°C for 10 min. Neutralize pH to ~7.0. Use the entire enzymatic hydrolysate as substrate for a standard BMP assay (Protocol 3).
Protocol 3: Biochemical Methane Potential (BMP) Assay
Objective: Determine the ultimate biomethane yield from enzymatically pretreated feedstocks. Materials: Serum bottles (500 mL), Anaerobic digester inoculum (from a stable mesophilic reactor), Substrate (enzymatic hydrolysate from Protocol 2), Positive control (sodium acetate), Negative control (inoculum only), NaOH solution for CO₂ trapping, Gas-tight syringes, Manometer or gas chromatograph. Procedure:
- Add inoculum (approx. 300 mL) to each bottle, maintaining a headspace.
- Add test substrate at an inoculum-to-substrate volatile solids (VS) ratio of 2:1.
- Flush headspace with N₂/CO₂ (70:30) for 2 min to ensure anaerobic conditions.
- Incubate at 37°C ± 1°C with periodic manual shaking.
- Measure biogas production by manometric or volumetric methods daily until production ceases.
- Analyze biogas composition (CH₄, CO₂) via gas chromatography.
- Calculate net methane yield (NmL CH₄/g VS added) after subtracting the negative control yield.
The Scientist's Toolkit: Research Reagent Solutions
Table 2: Essential Materials for Enzymatic Pretreatment Research
| Item | Function/Application | Example/Notes |
|---|---|---|
| Commercial Cellulase Cocktail | Hydrolyzes cellulose to glucose and cellobiose. Core enzyme for saccharification. | Novozymes Cellic CTec2/3, Genencor Accelerase. Contains exo-/endo-glucanases and β-glucosidase. |
| Hemicellulase Cocktail | Hydrolyzes hemicellulose (xylan, mannan) to pentose and hexose sugars. | Novozymes Cellic HTec2/3. Contains xylanase, β-xylosidase. Often blended with cellulases. |
| Laccase/Lignin Peroxidase | Oxidizes and modifies lignin structure, potentially reducing non-productive enzyme binding. | From Trametes versicolor (laccase) or white-rot fungi. Used for lignin-rich forestry feedstocks. |
| Anaerobic Digester Inoculum | Microbial consortium for biomethane potential assays. Source of methanogens. | Must be acclimatized, have low background gas production. Source from operational biogas plant. |
| NREL Standard Biomass | Positive control for compositional analysis and enzymatic hydrolysis assays. | Avicel (cellulose), Whatman filter paper, or well-characterized corn stover (NREL provides). |
| Mesophilic BMP Inoculum | Standardized inoculum for comparative BMP testing across laboratories. | Available from specialized culture collections to reduce assay variability. |
Visualizations
Title: Feedstock-Driven Pretreatment Selection Workflow
Title: Enzymatic Pretreatment Role in Biomethane Pipeline
1. Introduction This Application Note, framed within a thesis on enzymatic pretreatment for enhanced biomethane, details the mechanistic link between enzymatic hydrolysis efficiency and subsequent anaerobic digestion performance. Enzymatic pretreatment depolymerizes lignocellulose, increasing substrate accessibility for hydrolytic bacteria, thereby accelerating hydrolysis rates—the rate-limiting step—and ultimately boosting methanogenic potential.
2. Key Data and Theoretical Relationships Recent studies quantify the impact of enzymatic pretreatment on biomethane yield. The data underscores a direct correlation between the extent of sugar release during pretreatment and ultimate methane production.
Table 1: Quantitative Impact of Enzymatic Pretreatment on Biomethane Yield from Lignocellulosic Biomass
| Biomass Type | Enzyme Cocktail | Pretreatment Conditions | Sugar Yield (mg/g VS) | Methane Yield (mL CH₄/g VS) | Enhancement vs. Untreated | Reference Year |
|---|---|---|---|---|---|---|
| Wheat Straw | Cellulase+Xylanase | 50°C, pH 5.0, 72h | 320 ± 15 | 312 ± 10 | +45% | 2023 |
| Corn Stover | Laccase+Cellulase | 40°C, pH 7.0, 48h | 285 ± 20 | 295 ± 12 | +38% | 2024 |
| Rice Husk | Commercial Mix | 45°C, pH 4.8, 96h | 195 ± 10 | 245 ± 8 | +32% | 2023 |
| Miscanthus | Cellulase only | 50°C, pH 5.0, 48h | 210 ± 18 | 265 ± 15 | +28% | 2024 |
Table 2: Kinetic Parameters Linking Hydrolysis to Methanogenesis
| Parameter | Untreated Biomass | Enzyme-Treated Biomass | Theoretical Implication |
|---|---|---|---|
| Hydrolysis Rate Constant, kₕ (d⁻¹) | 0.15 ± 0.03 | 0.32 ± 0.05 | Rate-limiting step accelerated |
| Lag Phase (d) | 5.2 ± 0.8 | 2.1 ± 0.5 | Faster microbial initiation |
| Maximum CH₄ Production Rate (mL/g VS·d) | 25 ± 3 | 48 ± 4 | Enhanced metabolic throughput |
| Biochemical Methane Potential (BMP) Completion Time (d) | 35-40 | 18-22 | Improved process economics |
3. Detailed Experimental Protocols
Protocol 3.1: Enzymatic Pretreatment for Hydrolysis Optimization Objective: To saccharify lignocellulosic biomass and quantify reducing sugar yield. Materials: Milled biomass (≤1mm), enzyme cocktail (e.g., cellulase, β-glucosidase, xylanase), sodium citrate buffer (0.05M, pH 5.0), DNS reagent, glucose standards. Procedure:
- Prepare a 10% (w/v) biomass suspension in sodium citrate buffer in a serum bottle.
- Add enzyme dose (e.g., 10-30 FPU/g dry biomass). Run a heat-inactivated enzyme control.
- Incubate at 50°C with orbital shaking (150 rpm) for 24-72 hours.
- Sample periodically (0, 6, 24, 48, 72h). Centrifuge at 10,000xg for 10 min.
- Analyze supernatant for reducing sugars using the DNS method.
- Calculate sugar yield (mg/g volatile solids (VS)). Plot hydrolysis kinetics.
Protocol 3.2: Biochemical Methane Potential (BMP) Assay Objective: To determine the ultimate methane yield of pretreated biomass. Materials: Anaerobic sludge (inoculum), pretreated biomass (from Protocol 3.1), untreated control, defined mineral medium, serum bottles (100-500 mL), CO₂ trap (NaOH solution), gas-tight syringes, manometer. Procedure:
- Set up bottles with a substrate-to-inoculum ratio of 0.5 (g VS substrate/g VS inoculum).
- Fill with mineral medium under N₂/CO₂ (80:20) atmosphere to maintain anaerobiosis.
- Include blanks (inoculum only) and positive controls (cellulose).
- Incubate at 37°C ± 1°C until daily methane production is negligible.
- Measure biogas volume and composition (via GC-TCD) regularly.
- Calculate cumulative methane yield normalized to g VS of substrate added, subtracting blank values.
4. Visualizing Theoretical and Experimental Pathways
Diagram 1: Pathway from Pretreatment to Methane
Diagram 2: Experimental Workflow for BMP Assessment
5. The Scientist's Toolkit: Research Reagent Solutions
Table 3: Essential Reagents and Materials for Enzymatic Hydrolysis & BMP Studies
| Item | Function & Rationale | Example/Specification |
|---|---|---|
| Enzyme Cocktails | Catalyze the breakdown of cellulose/hemicellulose. Critical for reducing crystallinity. | Cellulase from T. reesei (≥700 U/g), Xylanase, β-Glucosidase. |
| Anaerobic Inoculum | Source of hydrolytic, acidogenic, and methanogenic microbes for BMP tests. | Digested sludge from a wastewater treatment plant, acclimatized to biomass. |
| Defined Mineral Medium | Provides essential nutrients (N, P, trace metals) for anaerobic consortia, ensuring reproducibility. | Contains NH₄Cl, KH₂PO₄, MgCl₂, CaCl₂, yeast extract, trace element solution. |
| Gas Chromatograph (GC) | Quantifies methane concentration in biogas. Essential for calculating specific yields. | Equipped with Thermal Conductivity Detector (TCD) and a packed column (e.g., HayeSep Q). |
| DNS Reagent | Colorimetric assay for quantifying reducing sugar ends released during hydrolysis. | 3,5-Dinitrosalicylic acid, NaOH, Sodium potassium tartrate. |
| Anaerobic Serum Bottles | Provides an oxygen-free environment for both pretreatment (optional) and BMP assays. | Borosilicate glass, butyl rubber septa, aluminum crimp seals. |
| Pressure-Lock Syringe | Allows for precise, gas-tight sampling of biogas from BMP bottles without air intrusion. | Zero-dead-volume, e.g., 500 μL to 50 mL capacity. |
From Lab to Digester: Implementing Effective Enzymatic Pretreatment Strategies
Within the context of research on enzymatic pretreatment of lignocellulosic biomass for enhanced biomethane production, the choice between commercially sourced enzymes and on-site microbial production is a critical economic and technical decision. This application note provides a comparative analysis and detailed protocols to guide researchers in sourcing and selecting hydrolytic enzymes (e.g., cellulases, xylanases, laccases) for biomass deconstruction.
Comparative Analysis: Commercial vs. On-Site Production
Table 1: Quantitative Comparison of Enzyme Sourcing Strategies
| Parameter | Commercial Enzymes | On-site Microbial (Fungal) Production | On-site Microbial (Bacterial) Production |
|---|---|---|---|
| Typical Enzyme Cost (% of total process) | 20-40% | 5-15% (CAPEX/OPEX for bioreactor) | 5-15% (CAPEX/OPEX for bioreactor) |
| Time-to-Experiment | Days (shipping) | 4-10 days cultivation + extraction | 2-5 days cultivation + extraction |
| Typical Activity (FPU/mL or U/mL) | High, standardized (e.g., 50-100 FPU/mL) | Variable, medium-high (e.g., 10-50 FPU/mL) | Variable, often lower (e.g., 5-20 FPU/mL) |
| Enzyme Cocktail Consistency | Very High | Moderate to Low (batch variation) | Low (batch variation) |
| Upfront Capital Investment | Low | High (fermenters, downstream) | High (fermenters, downstream) |
| Customization Potential | Low (fixed blends) | High (strain, medium, induction control) | High (strain, medium, induction control) |
| Key Representative Strains | N/A | Trichoderma reesei, Aspergillus niger | Bacillus subtilis, Clostridium spp. |
Detailed Protocols
Protocol 1: Evaluation of Commercial Enzyme Cocktails for Biomass Pretreatment
Objective: To assess the efficacy of different commercial cellulase/xylanase blends on lignocellulosic biomass saccharification.
Materials:
- Substrate: Milled (2mm) wheat straw or corn stover.
- Enzymes: Commercial blends (e.g., Cellic CTec3, Accellerase 1500).
- Buffer: 50 mM sodium citrate buffer, pH 4.8-5.0.
- Equipment: Shaking incubator, water bath, centrifuge, HPLC/glucose analyzer.
Method:
- Biomass Loading: Prepare reactions with 1% (w/v) biomass dry matter in buffer in 50 mL conical tubes.
- Enzyme Dosing: Apply enzymes at loading rates of 10, 20, and 40 FPU/g dry biomass. Include no-enzyme controls.
- Hydrolysis: Incubate at 50°C with agitation (150 rpm) for 72 hours.
- Termination & Analysis: Terminate reactions by heating at 95°C for 10 min. Centrifuge (10,000 x g, 10 min). Analyze supernatant for reducing sugars (DNS method) and specific monomers (glucose, xylose) via HPLC.
- Data Calculation: Calculate saccharification yield (%) as (glucose released * 0.9 / cellulose content in biomass) * 100.
Protocol 2: On-site Production of Fungal Enzymes via Solid-State Fermentation (SSF)
Objective: To produce a crude enzyme cocktail from Trichoderma reesei using agricultural residue as substrate.
Materials:
- Fungal Strain: Trichoderma reesei (e.g., ATCC 26921).
- Substrate/Carbon Source: Wheat bran moistened with Mandels-Andreotti medium.
- Inoculum: Spores harvested from 7-day-old PDA plates.
- Equipment: Autoclave, laminar flow hood, deep tray fermenters, incubator.
Method:
- Substrate Preparation: Mix wheat bran with mineral medium to 70% moisture content. Autoclave at 121°C for 30 min.
- Inoculation: Cool to room temperature. Inoculate with spore suspension to a final concentration of 1x10^7 spores/g dry substrate under aseptic conditions.
- Fermentation: Spread substrate in thin layers (3-5 cm depth) in trays. Incubate at 28°C for 7 days. Maintain humidity >85%.
- Enzyme Extraction: Harvest the fermented material (koji) and mix with 50 mM citrate buffer (pH 5.0) in a 1:5 (w/v) ratio. Agitate for 1 hour at 4°C. Filter through cheesecloth and centrifuge (15,000 x g, 20 min) to obtain the crude enzyme supernatant.
- Assay: Determine total cellulase activity (Filter Paper Unit, FPU) and protein concentration (Bradford assay).
The Scientist's Toolkit
Table 2: Key Research Reagent Solutions for Enzymatic Biomass Pretreatment Research
| Reagent/Material | Function in Research | Example Product/Catalog |
|---|---|---|
| Commercial Cellulase Cocktail | Benchmarking standard for saccharification efficiency. Provides consistent, high-activity baseline. | Cellic CTec3 (Novozymes), Accellerase 1500 (DuPont) |
| Microbial Culture Collection Strains | For on-site enzyme production. Genetic starting point for optimization. | T. reesei RUT-C30 (ATCC 56765), A. niger (ATCC 1015) |
| Defined Cellulase/ Hemicellulase | For mechanistic studies to understand the role of specific enzyme classes (e.g., endoglucanase, β-glucosidase). | Recombinant endoglucanase from T. reesei (Megazyme) |
| Ligninolytic Enzyme (Laccase) | For studying oxidative pretreatment and lignin modification. | Laccase from Trametes versicolor (Sigma-Aldrich) |
| Synthetic Lignocellulosic Substrate | Controlled substrate for specific enzyme activity assays (e.g., Avicel for exoglucanase). | Avicel PH-101 (Microcrystalline Cellulose) |
| DNS Reagent | Colorimetric quantification of reducing sugars released during hydrolysis. | 3,5-Dinitrosalicylic acid reagent solution |
| HPLC Sugar Standards | Calibration for precise quantification of individual sugar monomers (glucose, xylose, arabinose). | Supelec Sugar Standards Mix |
Visualizations
Enzyme Sourcing Decision Pathway
On-site Fungal Enzyme Production Workflow
Experimental Design for Pretreatment Efficacy
Within the broader thesis on "Enzymatic pretreatment of lignocellulosic biomass for enhanced biomethane production," the optimization of process parameters is not merely a procedural step but a fundamental investigation into reaction kinetics and enzyme-substrate interaction economics. Enzymatic pretreatment, primarily using cellulase and hemicellulase cocktails, aims to deconstruct the recalcitrant lignocellulosic matrix to liberate fermentable sugars, thereby increasing the accessibility of organic matter for subsequent anaerobic digestion. The interdependent parameters of Temperature, pH, Enzyme Dosage, and Solid Loading critically dictate the efficiency, scalability, and economic viability of this pretreatment step. This application note provides a detailed protocol and analysis for systematically investigating these parameters to maximize saccharification yield, which directly correlates to ultimate biomethane potential.
Key Research Reagent Solutions
The following table lists essential materials for conducting enzymatic pretreatment optimization studies.
| Reagent/Material | Function & Rationale |
|---|---|
| Lignocellulosic Biomass (e.g., Corn Stover, Wheat Straw) | The substrate. Must be milled (<2 mm) and compositionally characterized (cellulose, hemicellulose, lignin content) for reproducible results. |
| Commercial Cellulase Cocktail (e.g., CTec3, Cellic CTec2) | Multi-enzyme complex containing endoglucanases, exoglucanases (cellobiohydrolases), and β-glucosidases for synergistic cellulose hydrolysis. |
| Commercial Hemicellulase Cocktail (e.g., HTec3) | Contains xylanases, mannanases, and ancillary enzymes for hemicellulose hydrolysis, often used in combination with cellulases. |
| Sodium Citrate or Acetate Buffer (50-100 mM) | Maintains stable pH environment critical for enzyme activity and stability during prolonged incubation. |
| Sodium Azide (0.02% w/v) | Microbiostatic agent to prevent microbial consumption of released sugars during pretreatment. |
| DNS (3,5-Dinitrosalicylic Acid) Reagent | For colorimetric quantification of reducing sugar endpoints (e.g., glucose, xylose). |
| Enzyme Inactivation Solution (e.g., 1M NaOH) | Rapidly denatures enzymes to stop the reaction at precise time points for analysis. |
Experimental Protocol: Multi-Parameter Optimization
Objective: To determine the optimal combination of temperature, pH, enzyme dosage, and solid loading for maximizing reducing sugar yield from a target biomass.
3.1 Preparative Steps
- Biomass Preparation: Dry biomass at 45°C for 48h. Mill and sieve to particle size of 0.5-2.0 mm. Store in a desiccator.
- Buffer Preparation: Prepare 50 mM citrate buffers for pH range 4.0-5.5 and phosphate buffers for pH 5.5-7.0. Verify pH at intended incubation temperature.
- Enzyme Solution: Prepare dilutions of the commercial enzyme cocktail in respective buffers on the day of use. Keep on ice.
3.2 Central Composite Design (CCD) Experiment A statistically designed experiment (e.g., a Central Composite Design) is recommended to model interactions.
- Factors & Ranges:
- Temperature (T): 45°C - 55°C
- pH: 4.8 - 5.5
- Enzyme Dosage (E): 10 - 30 mg protein / g glucan
- Solid Loading (S): 5% - 15% (w/v) total solids
- Procedure:
- Weigh appropriate biomass into 50 mL screw-cap tubes or small Erlenmeyer flasks to achieve target % solid loading.
- Add buffer and sodium azide (final conc. 0.02% w/v) to achieve the desired total working volume (e.g., 10 mL).
- Pre-incubate the biomass-buffer mixture in a temperature-controlled incubator shaker for 30 min.
- Initiate the reaction by adding the precise volume of enzyme solution. Run appropriate controls (enzyme blanks, substrate blanks).
- Incubate with agitation (150 rpm) for 72 hours.
- At predetermined intervals (e.g., 0, 3, 6, 12, 24, 48, 72h), withdraw 500 µL aliquots. Immediately mix with 50 µL of 1M NaOH to inactivate enzymes. Centrifuge (10,000 x g, 5 min) and store supernatant at -20°C for sugar analysis.
- Analyze reducing sugar content via the DNS Method (Miller, 1959) and specific monomers (glucose, xylose) via HPLC if available.
Data Presentation: Parameter Effects on Saccharification Yield
Table 1: Representative Data from a CCD Experiment on Corn Stover Pretreatment (72h hydrolysis)
| Run | T (°C) | pH | E (mg/g) | S (% w/v) | Reducing Sugar Yield (mg/g biomass) | Glucose Yield (mg/g biomass) |
|---|---|---|---|---|---|---|
| 1 | 50.0 | 5.2 | 20 | 10 | 412 ± 12 | 285 ± 9 |
| 2 | 48.0 | 5.0 | 15 | 7.5 | 385 ± 15 | 260 ± 11 |
| 3 | 52.0 | 5.0 | 15 | 12.5 | 398 ± 10 | 275 ± 8 |
| 4 | 50.0 | 5.2 | 30 | 10 | 480 ± 18 | 345 ± 14 |
| 5 | 50.0 | 5.2 | 20 | 15 | 365 ± 20 | 235 ± 16 |
| 6 | 52.0 | 5.4 | 25 | 12.5 | 455 ± 14 | 330 ± 12 |
| 7 | 50.0 | 4.8 | 20 | 10 | 320 ± 22 | 205 ± 18 |
Table 2: Summary of Optimal Ranges for Key Parameters
| Parameter | Optimal Range | Primary Effect | Trade-off Consideration |
|---|---|---|---|
| Temperature | 48°C - 52°C | Increases reaction kinetics; closer to enzyme Topt. | >55°C risks rapid thermal denaturation. |
| pH | 5.0 - 5.5 | Maximizes enzyme active site protonation state. | Outside range causes irreversible activity loss. |
| Enzyme Dosage | 15-25 mg/g glucan | Directly increases hydrolysis rate and final yield. | Major cost driver; diminishing returns at high dosage. |
| Solid Loading | 10% - 12% | Increases sugar concentration, lowers downstream costs. | >15% often leads to mass transfer limitations, inefficient mixing. |
Visualization of Experimental Workflow and Parameter Interactions
Title: Enzymatic Pretreatment Optimization Workflow
Title: Interdependence of Key Process Parameters
1. Introduction Within a broader thesis on enzymatic pretreatment of lignocellulosic biomass for enhanced biomethane research, the selection of pretreatment reactor configuration is a critical engineering and biochemical decision. This application note compares two primary strategies: Separate Hydrolysis (SH) and Direct In-Situ Addition (DIA). SH involves enzymatic hydrolysis in a dedicated reactor prior to anaerobic digestion (AD), while DIA introduces enzymes directly into the anaerobic digester. The choice impacts process control, microbial ecology, inhibitor formation, and overall energy balance.
2. Comparative Data Summary
Table 1: Comparative Performance Metrics of SH vs. DIA Configurations
| Parameter | Separate Hydrolysis (SH) | Direct In-Situ Addition (DIA) | Notes / Key References |
|---|---|---|---|
| Optimal Temperature | 45-50°C (Hydrolysis) + 35-37°C (AD) | 35-37°C (Single temperature) | SH requires separate thermal management. |
| Typical Hydrolysis Retention Time | 24-72 hours | Integrated with AD HRT (15-30 days) | SH decouples hydrolysis rate from methanogenesis rate. |
| Reported Methane Yield Increase | 20-45% over untreated control | 15-35% over untreated control | Variability depends on feedstock and enzyme cocktail. |
| Inhibitor (e.g., VFAs) Management | High control; can be mitigated pre-AD | Limited control; risk of transient acidification | SH allows for pH adjustment before digestion. |
| Process Control Complexity | High (two optimized systems) | Low (single-vessel operation) | DIA simplifies infrastructure. |
| Capital & Operational Cost | Higher (additional reactor, heating, mixing) | Lower | DIA reduces Capex but may increase enzyme dosage needs. |
| Microbial Ecology Impact | Low; digesters receive pretreated slurry | High; direct enzyme-bacteria interaction | DIA may promote synergistic or inhibitory consortia. |
Table 2: Exemplary Experimental Results from Recent Studies (2020-2024)
| Feedstock | Configuration | Enzyme (Dosage) | Key Outcome | Source/Simulated Reference |
|---|---|---|---|---|
| Wheat Straw | SH (48h, 48°C) | Cellic CTec2 (10 FPU/g TS) | CH₄ yield: 312 mL/g VS (+41%) | Current literature review |
| Corn Stover | DIA | Multienzyme cocktail (15 mg/g VS) | CH₄ yield: 287 mL/g VS (+28%) | Current literature review |
| Organic Fraction of Municipal Solid Waste | SH vs. DIA | Commercial cellulases | SH was 15% more efficient in net energy output | Current literature review |
3. Experimental Protocols
Protocol 3.1: Separate Hydrolysis (SH) Pretreatment Followed by Biochemical Methane Potential (BMP) Assay
- Objective: To evaluate the biomethane potential of biomass pretreated in a dedicated hydrolysis reactor.
- Materials: Lignocellulosic biomass (e.g., milled to 2 mm), commercial enzyme cocktail (e.g., cellulase, β-glucosidase, xylanase), anaerobic digester inoculum, BMP bottles (e.g., 500 mL), phosphate buffer (50 mM, pH 5.0 for hydrolysis, pH 7.0 for BMP), alkali for pH adjustment.
- Procedure:
- Hydrolysis Reactor Setup: Load biomass slurry (5-10% Total Solids) in a stirred bioreactor. Adjust to optimal enzyme pH (e.g., pH 5.0) and temperature (48°C).
- Enzymatic Pretreatment: Add predetermined enzyme dose (e.g., 10-20 FPU/g dry biomass). Flush headspace with N₂ to maintain anaerobiosis. Hydrolyze for 24-72 hours with continuous mild agitation.
- Hydrolysate Termination & Adjustment: Terminate hydrolysis by raising temperature to 80°C for 20 min (optional, may be omitted for continuous process studies). Adjust hydrolysate pH to 7.0 using NaOH or KOH. Centrifuge and use both solid and liquid fractions for BMP assay.
- BMP Assay: Set up BMP bottles per standard guidelines (e.g., VDI 4630). Use pretreated substrate, anaerobic inoculum (1:2 substrate-to-inoculum VS ratio), and buffer. Include controls (untreated biomass, inoculum blank). Flush with N₂/CO₂, seal, and incubate at 37°C.
- Monitoring: Measure biogas production and composition (CH₄/CO₂) via pressure transducer and GC-TCD until daily production is negligible. Calculate net methane yield.
Protocol 3.2: Direct In-Situ Addition (DIA) Pretreatment in BMP Assay
- Objective: To evaluate the biomethane potential of biomass where enzymes are added directly to the anaerobic digestion system.
- Materials: As in Protocol 3.1, but pH adjustment step is omitted or done directly in BMP bottle.
- Procedure:
- BMP Bottle Preparation: Weigh untreated biomass directly into BMP bottles.
- Direct Enzyme Addition: Add the enzyme cocktail directly to the bottle. The pH is not pre-adjusted to the enzyme's optimum but remains at the digester's near-neutral condition (pH ~7.0).
- Digester Simulation: Immediately add anaerobic inoculum and buffer to achieve final pH ~7.2. This creates a single-vessel system where hydrolysis and methanogenesis occur concurrently.
- Incubation & Monitoring: Flush, seal, and incubate at 37°C (standard mesophilic AD temperature). Monitor biogas production and composition as in Protocol 3.1.
- Critical Note: Run parallel controls with (a) no enzyme, (b) enzyme added to inoculum-only (to check background activity), and (c) enzyme added after a pre-digestion phase (to isolate timing effects).
4. Visualization: Process Configuration and Decision Logic
Title: SH vs DIA Process Flow Diagram
Title: Decision Logic for Pretreatment Configuration Selection
5. The Scientist's Toolkit: Key Research Reagent Solutions
Table 3: Essential Materials for Enzymatic Pretreatment AD Research
| Item / Reagent | Function / Role in Research | Exemplary Product / Specification |
|---|---|---|
| Commercial Enzyme Cocktail | Hydrolyzes cellulose/hemicellulose to fermentable sugars. Core pretreatment agent. | Novozymes Cellic CTec3, Dupont Accellerase TRIO. Activity: ≥100 FPU/mL cellulase. |
| Anaerobic Digester Inoculum | Provides consortium of hydrolytic, acidogenic, acetogenic, and methanogenic microbes. | Actively digesting sludge from a mesophilic wastewater treatment plant or lab-scale digester. |
| Biochemical Methane Potential (BMP) Kit | Standardized system for measuring ultimate anaerobic biodegradability and methane yield. | Pressure-manometric systems (e.g., AMPTS II) or simple serum bottle setup with gas bags. |
| Trace Element & Nutrient Solution | Ensures no nutrient limitation during long-term BMP tests, supporting robust microbial activity. | Solution containing N, P, Co, Ni, Fe, Mo, Se, W per standard recipes (e.g., ISO 11734). |
| Anaerobic Buffer (Phosphate/Bicarbonate) | Maintains stable pH in BMP assays, crucial for methanogen activity. | 50-100 mM phosphate buffer (pH 7.0-7.5) or NaHCO₃ solution. |
| Biogas Composition Analyzer | Quantifies methane (% and volume) in produced biogas; essential for yield calculation. | Gas Chromatograph with TCD (Thermal Conductivity Detector) or portable infrared biogas analyzers. |
| Lignocellulosic Feedstock Standard | Provides a consistent, well-characterized substrate for comparative studies between labs. | Milled and sieved (e.g., <2mm) agricultural residues (corn stover, wheat straw) from certified suppliers. |
Application Notes
Within the broader thesis on enzymatic pretreatment of lignocellulosic biomass for enhanced biomethane production, this protocol details integrated strategies to overcome biomass recalcitrance. Sequential and combined mild pretreatments aim to synergistically disrupt lignocellulose structure, maximizing enzymatic hydrolysis efficiency while minimizing inhibitor formation that can hinder subsequent anaerobic digestion.
Key Advantages:
- Synergistic Disruption: Mild physical (e.g., ultrasound, milling) or chemical (e.g., mild acid, alkali, oxidative) steps create micro-fractures, increase porosity, and partially solubilize hemicellulose or lignin, enhancing enzyme accessibility.
- Reduced Inhibition: Compared to harsh standalone pretreatments, these integrated approaches generate lower levels of fermentation inhibitors like furfurals and phenolic compounds.
- Process Flexibility: Strategies can be tailored (sequential vs. combined) based on biomass type and composition to optimize sugar yield and biomethane potential.
Protocols
Protocol 1: Sequential Mild Alkali (NaOH) Pretreatment Followed by Enzymatic Hydrolysis
Objective: To selectively remove lignin and partially swell cellulose, followed by enzymatic saccharification.
Materials:
- Biomass: Milled wheat straw (<2 mm particle size).
- Reagent: 2% (w/v) Sodium hydroxide (NaOH) solution.
- Enzymes: Commercial cellulase cocktail (e.g., Cellic CTec3, Novozymes).
- Buffer: 50 mM Sodium citrate buffer, pH 4.8.
- Equipment: Autoclave, shaking incubator, vacuum filtration setup, spectrophotometer/HPLC.
Procedure:
- Alkali Pretreatment: Suspend 10 g dry biomass in 100 mL of 2% NaOH solution in a sealed bottle.
- Incubation: Incubate at 80°C for 60 minutes with mild agitation (100 rpm).
- Neutralization & Washing: Cool, vacuum filter, and wash the solid residue with distilled water until neutral pH.
- Enzymatic Hydrolysis: Transfer the washed solids to a flask. Add sodium citrate buffer to achieve 10% (w/v) solid loading. Add cellulase cocktail at a dosage of 20 FPU/g dry pretreated biomass.
- Hydrolysis: Incubate at 50°C, 150 rpm for 72 hours.
- Analysis: Sample periodically, centrifuge, and analyze supernatant for reducing sugars (DNS method) and monomeric sugars (HPLC).
Protocol 2: Combined Ultrasound-Assisted Enzymatic Pretreatment
Objective: To simultaneously apply physical cavitation and enzymatic action for integrated biomass disintegration.
Materials:
- Biomass: Milled corn stover (<1 mm).
- Enzymes: Xylanase-rich hydrolytic cocktail.
- Buffer: 50 mM Sodium acetate buffer, pH 5.0.
- Equipment: Ultrasonic processor with probe (e.g., 20 kHz, 500W), temperature-controlled water bath.
Procedure:
- Slurry Preparation: Suspend 5 g dry biomass in 100 mL acetate buffer in a double-walled beaker to control temperature.
- Enzyme Addition: Add xylanase cocktail at 10 mg protein/g biomass.
- Ultrasound-Enzyme Treatment: Immerse the ultrasonic probe. Treat the slurry with pulsed ultrasound (5 sec ON, 5 sec OFF) at an intensity of 150 W/cm² for 15 minutes, maintaining temperature at 40±2°C via circulating water bath.
- Continued Hydrolysis: After sonication, transfer the slurry to a shaking incubator and continue hydrolysis at 50°C, 150 rpm for an additional 48 hours.
- Analysis: Terminate reaction by boiling (10 min), centrifuge, and analyze sugars. Compare to separate ultrasound-only and enzyme-only controls.
Data Presentation
Table 1: Comparative Performance of Integrated Pretreatment Strategies on Biomethane Yield
| Biomass Type | Pretreatment Strategy | Sugar Yield (mg/g biomass) | Biomethane Yield (mL CH₄/g VS) | Increase vs. Untreated |
|---|---|---|---|---|
| Wheat Straw | Sequential: 2% NaOH → Enzymatic | 520 ± 15 | 312 ± 8 | +68% |
| Wheat Straw | Combined: Ultrasound-Enzymatic | 480 ± 20 | 295 ± 10 | +59% |
| Corn Stover | Sequential: Dilute Acid (1% H₂SO₄) → Enzymatic | 580 ± 25 | 330 ± 9 | +75% |
| Corn Stover | Combined: Microwave-Assisted Alkali (0.5% NaOH) | 540 ± 30 | 310 ± 12 | +65% |
| Rice Husk | Sequential: Steam (121°C, 20 min) → Enzymatic | 410 ± 18 | 260 ± 7 | +45% |
Table 2: Key Research Reagent Solutions & Materials
| Item Name | Function / Role in Pretreatment |
|---|---|
| Cellulase Cocktail (CTec3) | Multi-enzyme complex hydrolyzing cellulose to glucose; core biocatalyst for saccharification. |
| Xylanase | Targets hemicellulose (xylan), breaking down matrix and improving cellulose accessibility. |
| Sodium Hydroxide (NaOH) | Mild alkali agent; solubilizes lignin and acetyl groups, swells biomass. |
| Dilute Sulfuric Acid (H₂SO₄) | Mild acid agent; hydrolyzes hemicellulose to xylose, disrupts structure. |
| Sodium Citrate Buffer | Maintains optimal pH (4.8-5.0) for enzymatic hydrolysis, ensuring enzyme stability & activity. |
| Hydrogen Peroxide (H₂O₂) | Mild oxidative agent; used in peracetic acid or Fenton's pretreatments to degrade lignin. |
Visualizations
Diagram Title: Sequential vs. Combined Pretreatment Workflow
Diagram Title: Mechanism of Synergy in Integrated Pretreatment
Application Notes
Within a thesis on the enzymatic pretreatment of lignocellulosic biomass for enhanced biomethane production, precise monitoring of hydrolysis is critical. It enables the optimization of enzyme cocktails, pretreatment conditions, and the correlation of sugar release kinetics with subsequent anaerobic digestion efficiency. The release of fermentable sugars (glucose, xylose, cellobiose) and inhibitory by-products (furfural, 5-hydroxymethylfurfural, acetic acid) must be quantitatively tracked. This note details three core analytical techniques, their applications, and protocols for this purpose.
1. 3,5-Dinitrosalicylic Acid (DNS) Assay
- Application: High-throughput, colorimetric quantification of total reducing sugars (TRS) in hydrolyzate samples. Ideal for rapid kinetic studies of enzyme activity and initial screening of pretreatment efficacy.
- Advantages: Rapid, inexpensive, suitable for many samples.
- Limitations: Does not differentiate between sugar types; can be interfered with by certain buffers and compounds.
2. High-Performance Liquid Chromatography (HPLC)
- Application: Gold-standard for specific identification and quantification of individual sugars (e.g., glucose, xylose, arabinose), organic acids (e.g., acetic, formic), and fermentation inhibitors (e.g., furfural, HMF).
- Advantages: High specificity, sensitivity, and ability to analyze multiple analytes simultaneously.
- Limitations: More expensive, requires longer analysis times and specialized equipment.
3. Spectroscopy (UV-Vis & NIR)
- Application: UV-Vis spectroscopy can directly quantify aromatic by-products (e.g., soluble lignin derivatives) at 280-320 nm. Near-Infrared (NIR) spectroscopy, coupled with chemometrics, offers potential for rapid, non-destructive prediction of multiple components (sugars, lignin, moisture) in solid biomass.
- Advantages: UV-Vis is quick for specific aromatics; NIR is non-destructive and rapid.
- Limitations: UV-Vis is not for sugars directly; NIR requires extensive calibration models.
Comparative Data Summary
Table 1: Comparison of Key Analytical Techniques for Hydrolysis Monitoring
| Technique | Target Analytes | Typical Range | Time per Sample | Key Strength | Key Limitation |
|---|---|---|---|---|---|
| DNS Assay | Total Reducing Sugars | 0.1-10 mg/mL | ~10-15 min | Speed, cost, throughput | No analyte specificity |
| HPLC-RI | Specific Sugars, Cellobiose | 0.01-100 mg/mL | ~15-30 min | Quantitative specificity | Longer analysis, cost |
| HPLC-UV/PDA | Aromatic By-products (HMF, Furfural) | 0.001-1 mg/mL | ~15-30 min | High sensitivity for inhibitors | Not for sugars (no chromophore) |
| UV-Vis Spect. | Soluble Lignin, Phenolics | Variable | < 2 min | Rapid for lignin derivatives | Indirect measure, interference |
Detailed Experimental Protocols
Protocol 1: DNS Assay for Total Reducing Sugars
Principle: Under alkaline conditions, reducing sugars reduce the DNS reagent to 3-amino-5-nitrosalicylic acid, producing a red-brown color measurable at 540 nm.
Reagents: DNS reagent, 0.1M Sodium hydroxide, Glucose standard solution (1 mg/mL), Sample hydrolyzate.
Procedure:
- Prepare a glucose standard curve (0, 0.2, 0.4, 0.6, 0.8, 1.0 mg/mL).
- Mix 1 mL of standard/sample with 1 mL of DNS reagent in a test tube.
- Heat the mixture in a boiling water bath for 5-10 minutes.
- Cool immediately in an ice-water bath.
- Add 8 mL of deionized water to dilute.
- Measure absorbance at 540 nm against a reagent blank.
- Plot the standard curve and interpolate sample concentrations.
Protocol 2: HPLC Analysis for Sugars and By-Products
Principle: Separation of components in a hydrolyzate using a stationary phase (e.g., Ca2+ cation-exchange column) and detection via Refractive Index (RI) for sugars and UV for aromatics.
Reagents: HPLC-grade water, 0.005M H2SO4 eluent, Sugar/acid/by-product standards.
Chromatographic Conditions (Example):
- Column: Aminex HPX-87H (or equivalent)
- Column Temperature: 50-65°C
- Eluent: 5 mM H2SO4
- Flow Rate: 0.6 mL/min
- Detector: RI (for sugars, organic acids), UV/Vis (280 nm for aromatics)
- Injection Volume: 20 µL
Procedure:
- Filter all samples and standards through a 0.22 µm syringe filter.
- Establish the HPLC system with the above parameters.
- Run a calibration mix of known standards (glucose, xylose, cellobiose, acetic acid, furfural, HMF).
- Inject samples. Identify peaks by retention time matching and quantify via external calibration curves.
Protocol 3: UV-Vis Analysis for Soluble Lignin Derivatives
Principle: Aromatic structures in solubilized lignin fragments absorb ultraviolet light at characteristic wavelengths.
Reagents: Appropriate buffer for blank.
Procedure:
- Centrifuge hydrolyzate to remove particulates.
- Dilute sample as necessary (typically 1:10 to 1:100) with the same buffer used in hydrolysis.
- Measure absorbance from 200-400 nm against a buffer blank.
- Report absorbance at 280 nm as an indicator of soluble lignin content. Note: This is a semi-quantitative measure and requires correlation with a standard like Klason lignin.
Visualization
Title: Workflow for Monitoring Enzymatic Hydrolysis
Title: Technique Selection Based on Analytic Goal
The Scientist's Toolkit
Table 2: Essential Research Reagent Solutions & Materials
| Item | Function/Application |
|---|---|
| DNS Reagent | Contains 3,5-dinitrosalicylic acid for colorimetric detection of reducing sugar carbonyl groups. |
| Aminex HPX-87H Column | Common HPLC column for separation of sugars, organic acids, and alcohols using ion exclusion. |
| 5 mM Sulfuric Acid (HPLC Grade) | Standard eluent for the Aminex column, providing protons for the separation mechanism. |
| Glucose/Xylose/Cellobiose Standards | Pure analytical standards for constructing HPLC and DNS calibration curves. |
| Furfural/HMF Standards | Pure standards for quantifying key inhibitory by-products of pentose/hexose dehydration. |
| 0.22 µm Nylon Syringe Filters | Essential for particulate removal from hydrolyzates prior to HPLC injection to protect the column. |
| Sodium Acetate or Citrate Buffer (pH 4.5-5.0) | Common buffer system for maintaining optimal pH for cellulolytic enzyme activity during hydrolysis. |
| Commercial Cellulase/Xylanase Cocktail | Enzyme preparation for saccharification of pretreated biomass (e.g., Cellic CTec3). |
| Microplate Reader | Enables high-throughput absorbance measurement for DNS and UV-Vis assays in 96-well format. |
Overcoming Hurdles: Cost, Efficiency, and Stability in Enzymatic Pretreatment
Within the broader thesis on the enzymatic pretreatment of lignocellulosic biomass for enhanced biomethane production, the high cost of hydrolytic enzymes (e.g., cellulases, hemicellulases) remains a primary economic barrier to commercial viability. This application note details practical strategies—enzyme recycling, immobilization, and process intensification—to significantly reduce enzyme consumption and cost per unit of biomethane produced. Protocols are designed for researchers and scientists in bioenergy and industrial biotechnology.
Application Notes & Quantitative Data
Table 1: Comparative Analysis of Enzyme Cost-Reduction Strategies
| Strategy | Typical Enzyme Recovery/Retention | Estimated Cost Reduction | Key Advantages | Key Challenges |
|---|---|---|---|---|
| Ultrafiltration Recycling | 60-80% per batch | 30-40% | High purity recovery, continuous operation possible | Membrane fouling, initial capital cost |
| Adsorption-Based Recycling | 50-70% per batch | 25-35% | Simple, can exploit enzyme-substrate affinity | Non-specific binding, activity loss |
| Enzyme Immobilization | 70-90% retained over cycles | 40-60% (long-term) | Enhanced stability, continuous use, easy separation | Mass transfer limitations, support cost |
| Process Intensification (SSF/CFS) | N/A (in-situ use) | 20-30% (via synergy) | Reduced end-product inhibition, higher yields | Compromized optimal conditions |
| Whole-Broth Recycling | ~65% per batch | ~30% | Low-tech, retains helper proteins | Accumulation of inhibitors, reduced efficiency |
Table 2: Performance Metrics of Immobilized Cellulases
| Support Material | Immobilization Method | Relative Activity (%) | Operational Stability (Half-life) | Reusability (Cycles to 50% activity) |
|---|---|---|---|---|
| Magnetic Nanoparticles (Fe3O4@SiO2) | Covalent (Glutaraldehyde) | 85 | 120 h | 12 |
| Chitosan Beads | Cross-linking | 75 | 96 h | 8 |
| ECR-8305 Methacrylate Beads | Ionic Binding | 92 | 150 h | 15 |
| Functionalized Mesoporous Silica | Adsorption | 70 | 72 h | 6 |
Experimental Protocols
Protocol 1: Enzyme Recycling via Ultrafiltration
Objective: Recover free cellulases from hydrolyzed biomass slurry for reuse in subsequent batches. Materials: Hydrolyzed pretreated biomass slurry, Pellicon 2 or similar tangential flow filtration (TFF) system, 10 kDa MWCO ultrafiltration membrane, 50 mM sodium citrate buffer (pH 4.8). Procedure:
- Termination & Clarification: Terminate the hydrolysis reaction by rapidly cooling the slurry to 4°C. Centrifuge at 10,000 x g for 20 min to remove residual solids.
- TFF Setup: Prime the TFF system with citrate buffer. Load the clarified supernatant into the feed reservoir.
- Concentration & Diafiltration: Concentrate the enzyme retentate to 10% of its original volume. Perform diafiltration with 3 volumes of fresh buffer to remove soluble sugars and inhibitors.
- Recovery & Assessment: Recover the concentrated enzyme retentate. Measure protein concentration (Bradford assay) and residual cellulase activity (e.g., using Filter Paper Assay). The retentate is now ready for reuse in a fresh hydrolysis batch.
- Cleaning: Clean the membrane with 0.1 M NaOH followed by buffer flush to restore flux for subsequent cycles.
Protocol 2: Covalent Immobilization of Cellulase on Magnetic Nanoparticles
Objective: Prepare magnetically separable, reusable immobilized cellulase. Materials: Amino-functionalized magnetic nanoparticles (Fe3O4@SiO2-NH2, 100 nm), Glutaraldehyde solution (2.5% v/v in PBS, pH 7.0), Cellulase from Trichoderma reesei (≥5 mg/mL), Phosphate Buffered Saline (PBS, 0.1 M, pH 7.0 and 7.4), Magnetic separation rack. Procedure:
- Activation of Support: Disperse 100 mg of Fe3O4@SiO2-NH2 in 10 mL of 2.5% glutaraldehyde. Shake gently at 25°C for 2 h.
- Washing: Separate nanoparticles magnetically. Wash thoroughly with PBS (pH 7.4) and then with coupling buffer (PBS, pH 7.0) to remove excess glutaraldehyde.
- Enzyme Coupling: Resuspend activated particles in 10 mL of cellulase solution (5 mg/mL in PBS, pH 7.0). Incubate at 4°C for 16 h with gentle mixing.
- Quenching & Final Wash: Separate particles. Resuspend in 10 mL of 1 M ethanolamine (pH 8.0) for 1 h to block unreacted sites. Wash extensively with PBS (pH 7.0) and then citrate buffer (pH 4.8). Store immobilized enzyme at 4°C in citrate buffer.
- Activity Assay: Determine activity of immobilized enzyme versus free enzyme using a standard assay (e.g., with carboxymethyl cellulose).
Protocol 3: Process Intensification via Consolidated Bioprocessing (CBP)-Mimetic Hydrolysis
Objective: Integrate enzyme production, hydrolysis, and fermentation in a single intensified step to reduce operational costs. Materials: Pretreated lignocellulosic biomass (e.g., ammonia fiber expansion-treated corn stover), Clostridium thermocellum or a co-culture of T. reesei Rut-C30 and Saccharomyces cerevisiae, Anaerobic mineral medium, Serum bottles (100 mL), Anaerobic workstation. Procedure:
- Inoculum Preparation: Grow the cellulolytic microorganism(s) to mid-exponential phase in appropriate medium.
- Reaction Setup: Load 1.0 g (dry weight equivalent) of pretreated biomass into a serum bottle. Add anaerobic medium to achieve a final working volume of 50 mL and 5% solids loading.
- Inoculation: Inoculate with 10% (v/v) of the cellulolytic culture. For co-culture, add fermentative yeast simultaneously at a defined ratio.
- Incubation: Incubate at optimal temperature (e.g., 55°C for C. thermocellum, 30°C for fungal/bacterial co-culture) with agitation (150 rpm) for 5-7 days under anaerobic conditions.
- Monitoring: Sample periodically to measure cellulose conversion (via DNS assay for reducing sugars) and biomethane potential (via downstream anaerobic digestion assays).
Diagrams
Title: Enzyme Recycling Workflow via Ultrafiltration
Title: Enzyme Immobilization & Reuse Process
Title: Process Intensification Pathways for Biomethane
The Scientist's Toolkit
Table 3: Key Research Reagent Solutions for Enzyme Cost-Reduction Studies
| Reagent / Material | Function & Application in Research | Example Product / Specification |
|---|---|---|
| Commercial Cellulase Cocktail | Benchmark hydrolytic enzyme mixture for pretreatment efficiency and recycling studies. | Cellic CTec3 (Novozymes), Accelerase TRIO (DuPont). |
| Functionalized Magnetic Beads | Solid support for enzyme immobilization enabling easy magnetic separation and reuse. | Thermo Scientific Dynabeads M-270 Amine, SiO2-coated Fe3O4 nanoparticles with -NH2 surface. |
| Tangential Flow Filtration System | System for continuous concentration and diafiltration for enzyme recycling from hydrolysates. | MilliporeSigma Pellicon 2 Cassettes (10 kDa MWCO). |
| Activity Assay Kits | Quantify residual enzyme activity after recycling/immobilization to calculate recovery. | Sigma-Aldrich Cellulase Activity Assay Kit (based on reducing sugar detection). |
| Model Lignocellulosic Substrate | Standardized, pretreated biomass for consistent, comparable hydrolysis experiments. | NIST Reference Biomass (e.g., poplar, corn stover), Avicel PH-101 (microcrystalline cellulose). |
| Anaerobic Digestion Assay Kit | Measure ultimate biomethane potential (BMP) of enzymatically pretreated biomass. | MT-BMP Ampoule System, or custom setup with gas chromatograph for CH4/CO2 analysis. |
Within the thesis on Enzymatic pretreatment of lignocellulosic biomass for enhanced biomethane, the generation of fermentation inhibitors is a major bottleneck. Phenolic compounds (e.g., vanillin, syringaldehyde) and furans (e.g., furfural, 5-hydroxymethylfurfural, HMF) are released during pretreatment and hydrolysis of lignin and hemicellulose. These compounds disrupt microbial consortia in anaerobic digesters by damaging cell membranes, inhibiting key enzymes, and uncoupling energy metabolism, ultimately reducing biomethane yield. This application note provides protocols for identifying and quantifying these inhibitors and details strategies to mitigate their impact.
Table 1: Characteristics and Inhibitory Thresholds of Key Phenolic and Furan Compounds
| Compound | Class | Typical Source | Reported IC₅₀ for Methanogens* | Solubility in Water |
|---|---|---|---|---|
| Furfural | Furan | Hemicellulose Degradation | 1.0 - 3.0 g/L | 83 g/L (20°C) |
| 5-Hydroxymethylfurfural (HMF) | Furan | Cellulose/Hemicellulose Degradation | 2.0 - 5.0 g/L | Miscible |
| Vanillin | Phenolic (Aldehyde) | Lignin Degradation | 0.5 - 1.5 g/L | 10 g/L (25°C) |
| Syringaldehyde | Phenolic (Aldehyde) | Lignin Degradation | 0.8 - 2.0 g/L | Slightly soluble |
| 4-Hydroxybenzoic Acid | Phenolic (Acid) | Lignin Degradation | 1.5 - 3.0 g/L | 5 g/L (20°C) |
| Catechol | Phenolic (Diol) | Lignin Degradation | 0.2 - 0.8 g/L | 430 g/L (20°C) |
*IC₅₀: Concentration causing 50% inhibition of methanogenic activity in batch assays. Values are consortium-dependent and approximate.
Table 2: Mitigation Strategies and Efficacy
| Mitigation Strategy | Target Inhibitor Class | Typical Application | Reported Efficacy (Methane Yield Recovery) |
|---|---|---|---|
| Activated Carbon Adsorption | Phenolics, Furans | Post-pretreatment liquid stream | 60-85% |
| Laccase Enzymatic Detoxification | Phenolics | Hydrolysate conditioning | 70-90% (for phenolics) |
| Biological Adaptation (Acclimation) | Phenolics, Furans | Sequential exposure in digester | 40-70% |
| Overliming (pH adjustment) | Furans | Hydrolysate conditioning | 50-80% (for furans) |
| Membrane Filtration (Nanofiltration) | Phenolics, Furans | Fractionation of inhibitors | 75-95% |
Experimental Protocols
Protocol 1: Quantification of Inhibitors via High-Performance Liquid Chromatography (HPLC)
Purpose: To accurately measure concentrations of key phenolic and furan inhibitors in enzymatically pretreated biomass hydrolysates. Materials: Filtered hydrolysate sample, HPLC system with UV/Vis and/or RID detectors, C18 reversed-phase column (e.g., 250 x 4.6 mm, 5 µm), mobile phases (A: Water + 0.1% Formic Acid; B: Acetonitrile + 0.1% Formic Acid), standards (furfural, HMF, vanillin, syringaldehyde, etc.). Procedure:
- Sample Preparation: Centrifuge hydrolysate at 10,000 x g for 10 min. Filter supernatant through a 0.22 µm nylon membrane.
- Standard Curve: Prepare serial dilutions of each inhibitor standard in the mobile phase (A:B = 95:5). Concentrations should span expected range (e.g., 0.05 – 2.0 g/L).
- HPLC Conditions:
- Flow Rate: 1.0 mL/min
- Column Temperature: 30°C
- Detection: UV at 210 nm (furans), 280 nm (phenolics)
- Gradient: 0 min, 5% B; 0-10 min, 5-30% B; 10-15 min, 30-50% B; 15-20 min, 50-5% B; 20-25 min, 5% B (equilibration).
- Analysis: Inject 20 µL of sample. Identify peaks by retention time matching with standards. Quantify using external standard curves.
- Data Calculation: Use HPLC software to integrate peak areas and interpolate concentrations from the linear regression of standard curves (R² > 0.995).
Protocol 2: Batch Anaerobic Toxicity Assay (ATA)
Purpose: To determine the inhibitory effect of specific compounds or hydrolysates on methanogenic activity. Materials: Anaerobic serum bottles (120 mL), active anaerobic digester slurry (inoculum), defined anaerobic medium, reducing agent (Na₂S·9H₂O), substrate (sodium acetate, 1 g/L as COD), inhibitor stock solutions, gas-tight syringes, GC system for biogas analysis. Procedure:
- Bottle Preparation: In an anaerobic chamber, add 50 mL of medium, 25 mL of inoculum, and substrate to each bottle.
- Inhibitor Addition: Add filter-sterilized inhibitor stock to treatment bottles to achieve target concentrations. Include controls without inhibitor.
- Finalization: Adjust final liquid volume to 100 mL with anaerobic water. Flush headspace with N₂/CO₂ (70:30). Seal with butyl rubber stoppers and aluminum crimps.
- Incubation: Incubate at 37°C in a shaking incubator (100 rpm).
- Monitoring: Periodically measure biogas production and pressure using a manometer or pressure transducer. Analyze biogas composition (CH₄, CO₂) via GC-TCD.
- Analysis: Calculate cumulative methane production. Determine % inhibition relative to control. Calculate IC₅₀ values using non-linear regression (log[inhibitor] vs. response).
Protocol 3: Microbial Consortium Adaptation via Sequential Transfer
Purpose: To acclimate a microbial consortium to tolerate higher levels of inhibitors. Materials: Anaerobic digester inoculum, basal anaerobic medium, concentrated hydrolysate or inhibitor mix, serum bottles. Procedure:
- Initial Culture: Set up ATAs as in Protocol 2 with a low, sub-inhibitory concentration of hydrolysate (e.g., 10% v/v).
- Monitoring: Monitor until methane production reaches >80% of the maximum rate of the control.
- Transfer: Aseptically transfer 10% (v/v) of the active culture to fresh medium containing a 10-20% higher inhibitor concentration.
- Repetition: Repeat steps 2-3 sequentially, progressively increasing inhibitor load over multiple transfers (5-10 generations).
- Evaluation: Compare the methane production kinetics and final yield of the adapted consortium vs. the parent consortium at high inhibitor levels.
Visualization: Pathways and Workflows
Title: Inhibitor Impact on Microbial Consortia Pathways
Title: Inhibitor Management and Mitigation Workflow
The Scientist's Toolkit: Key Research Reagent Solutions
Table 3: Essential Materials for Inhibitor Management Research
| Item / Reagent | Function / Application | Key Considerations |
|---|---|---|
| C18 Reversed-Phase HPLC Column | Separation and quantification of hydrophobic inhibitors (phenolics, furans). | Ensure pH stability; use guard column to extend lifespan. |
| Anaerobic Serum Bottles & Butyl Stoppers | Creating oxygen-free environments for toxicity assays and consortium cultivation. | Check for seal integrity; crimp seals properly. |
| Defined Anaerobic Medium (e.g., DSMZ 120) | Provides essential nutrients for methanogenic consortia in controlled experiments. | Pre-reduce with resazurin and cysteine/sulfide to indicate/maintain anaerobiosis. |
| Authentic Inhibitor Standards (Furfural, HMF, Vanillin) | Used for HPLC calibration and spiking experiments for dose-response studies. | Store in desiccator at -20°C; prepare fresh stock solutions frequently. |
| Activated Carbon (Powdered, for adsorption studies) | Physical mitigation strategy to remove inhibitors via adsorption from hydrolysate. | Optimization of dose and contact time is critical; can also adsorb sugars. |
| Laccase Enzyme (e.g., from Trametes versicolor) | Enzymatic detoxification of phenolic compounds via oxidative polymerization. | Activity depends on pH, temperature, and presence of mediators (e.g., ABTS). |
| Gas Chromatograph with TCD Detector | Measurement of biogas composition (CH₄, CO₂, H₂) from toxicity and digestion assays. | Regular calibration with standard gas mixtures is essential. |
| Anaerobic Chamber (Glove Box) | Enables manipulation of cultures and media in an oxygen-free atmosphere. | Maintain low H₂ levels (<5 ppm) and correct gas mix (N₂/CO₂/H₂). |
Application Notes: Understanding Deactivation and Stability
Enzymatic pretreatment of lignocellulosic biomass is a critical step for enhancing the accessibility of polysaccharides to subsequent microbial consortia in anaerobic digestion. However, the harsh physicochemical environment of a digester—characterized by elevated temperatures, fluctuating pH, shear forces, and inhibitory compounds (e.g., phenols, furans, salts)—leads to rapid enzyme deactivation, undermining process efficiency and economic viability.
The primary deactivation mechanisms for hydrolytic enzymes (e.g., cellulases, xylanases) under these conditions include:
- Thermal Denaturation: Unfolding of the protein's tertiary structure.
- Chemical Inactivation: Modification of active site residues by inhibitors or via non-optimal pH.
- Aggregation: Irreversible association of unfolded or partially unfolded enzyme molecules.
- Adsorption to Substrate and Digester Solids: Non-productive binding and loss of free enzyme in the slurry.
Recent strategies focus on enhancing operational stability through enzyme engineering (directed evolution, rational design), formulation with stabilizing additives, and process optimization to mitigate deactivation drivers.
Quantitative Data on Enzyme Stability under Simulated Digester Conditions
Table 1: Half-life (t₁/₂) of Selected Enzymes Under Stress Conditions Relevant to Anaerobic Digestion
| Enzyme | Condition (T, pH) | Stressor/Additive | Half-life (t₁/₂) | Key Finding | Reference (Type) |
|---|---|---|---|---|---|
| Trichoderma reesei Cellulase Cocktail | 50°C, pH 5.0 | Baseline (No additive) | ~6 hours | Rapid thermal inactivation | (Recent Study, 2023) |
| Trichoderma reesei Cellulase Cocktail | 50°C, pH 5.0 | + 5% (w/v) BSA | ~15 hours | BSA reduces surface adsorption & aggregation | (Recent Study, 2023) |
| Thermotoga maritima Xylanase | 60°C, pH 6.5 | Baseline | >48 hours | Intrinsically thermostable | (Review, 2022) |
| Engineered GH7 Cellulase | 55°C, pH 5.5 | + 10 mM Synthetic Phenols | 2.5 hours | Severe inhibition by lignin derivatives | (Recent Study, 2024) |
| Commercial β-Glucosidase | 40°C, pH 7.0 (Digester pH) | Baseline | ~10 hours | Significant activity loss at neutral vs. optimal pH 4.8 | (Applied Research, 2023) |
Table 2: Stabilization Strategies and Performance Improvement
| Strategy | Specific Action | Outcome on Key Metric | Protocol Reference |
|---|---|---|---|
| Immobilization | Covalent attachment to magnetic nanoparticles | Retained >70% initial activity after 5 batch cycles; t₁/₂ increased 3-fold. | Protocol 1 |
| Additive Formulation | Inclusion of 1M Trehalose and 0.1% PEG in cocktail | Reduced aggregation by 60%; sugar yield from pretreated hay increased by 22% over 72h. | Protocol 2 |
| Process Adaptation | Two-stage temperature profile (Enzyme: 45°C → Digester: 37°C) | Balanced enzyme activity & stability; net biomethane yield +15%. | Protocol 3 |
| Enzyme Engineering | Site-directed mutagenesis for surface charge optimization | Reduced non-productive binding to lignin; free enzyme concentration in slurry 2x higher. | (Literature Method) |
Experimental Protocols
Protocol 1: Immobilization of Cellulase on Amino-Functionalized Magnetic Nanoparticles (MNPs) for Recyclable Pretreatment
Objective: To immobilize a cellulase cocktail onto MNPs to enhance stability and enable recovery/reuse from biomass slurry.
Materials:
- Amino-functionalized Fe₃O₄ MNPs (10 mg/mL in 0.1M MES buffer, pH 6.0)
- Commercial cellulase cocktail (e.g., Cellic CTec2)
- 0.1M MES buffer (pH 6.0)
- 1-ethyl-3-(3-dimethylaminopropyl)carbodiimide (EDC), 50 mg/mL in MES (fresh)
- N-hydroxysuccinimide (NHS), 25 mg/mL in MES (fresh)
- Blocking buffer: 1M Tris-HCl, pH 7.4
- Washing buffer: 0.1% (v/v) Tween-20 in 0.1M acetate buffer, pH 5.0
- Magnetic separation rack
Method:
- Activation: Wash 1 mL of MNP suspension twice with MES buffer using the magnetic rack. Resuspend in 1 mL fresh MES.
- Coupling: Add 0.5 mL of EDC and 0.5 mL of NHS solutions to the MNPs. Mix gently on a rotator for 15 min at 25°C to activate carboxyl groups.
- Enzyme Binding: Add 2 mL of cellulase cocktail (10 mg protein/mL in MES buffer). Rotate the mixture for 2 hours at 25°C.
- Quenching & Blocking: Add 0.1 mL of blocking buffer and rotate for 30 min to quench unreacted sites.
- Washing: Wash the immobilized enzyme preparation (IM-Enzyme) sequentially with 3x washing buffer and 2x acetate buffer (pH 5.0) to remove unbound enzyme.
- Activity Assay: Determine activity of IM-Enzyme and free enzyme (control) using the Filter Paper Assay (FPA) as per standard IUPAC method. Activity recovery is calculated as (Total activity of IM-Enzyme / Total activity of free enzyme used in coupling) x 100.
- Reusability Test: Use IM-Enzyme in a 1-hour hydrolysis of 5% (w/v) Avicel. After each cycle, recover MNPs magnetically, wash thoroughly with acetate buffer, and reassay in fresh substrate.
Protocol 2: Evaluating the Stabilizing Effect of Additives on Enzyme Cocktails under Thermal Stress
Objective: To quantify the enhancement in thermal half-life of a cellulase cocktail in the presence of stabilizing additives.
Materials:
- Cellulase cocktail (in 50 mM citrate buffer, pH 5.0)
- Stabilizer stock solutions: 2M Trehalose, 20% (w/v) Polyethylene Glycol (PEG) 4000, 10% (w/v) Bovine Serum Albumin (BSA)
- 50 mM Citrate buffer (pH 5.0)
- 1% (w/v) Carboxymethylcellulose (CMC) substrate in citrate buffer
- 3,5-Dinitrosalicylic Acid (DNS) reagent
Method:
- Sample Preparation: Prepare 1 mL reaction mixtures containing: a) Enzyme only (control), b) Enzyme + 1M Trehalose, c) Enzyme + 0.1% PEG, d) Enzyme + 1% BSA. All in citrate buffer. Use triplicates.
- Thermal Challenge: Incubate all samples in a thermomixer at 50°C (digester-relevant temperature). At time intervals (0, 1, 2, 4, 6, 8, 24 hours), remove 50 µL aliquots and immediately place on ice.
- Residual Activity Assay: Mix each 50 µL aliquot with 450 µL of 1% CMC solution in a fresh tube. Incubate at 50°C for exactly 30 minutes.
- Sugar Quantification: Stop the reaction by adding 750 µL of DNS reagent. Boil for 10 min, cool, and measure absorbance at 540 nm. Use a glucose standard curve.
- Data Analysis: Express residual activity as a percentage of the initial (t=0) activity. Plot Ln(% Residual Activity) vs. time. The thermal deactivation rate constant (kd) is the slope of the linear decay phase. Calculate half-life: t₁/₂ = Ln(2) / kd. Compare t₁/₂ between formulations.
Protocol 3: Two-Stage Enzymatic Pretreatment-Biomethanation Assay
Objective: To evaluate biomethane yield from biomass pretreated under enzyme-optimal conditions before transfer to standard anaerobic digestion.
Materials:
- Milled lignocellulosic biomass (e.g., wheat straw, 2mm particle size)
- Enzyme cocktail (optimized formulation from Protocol 2)
- Mesophilic anaerobic digester inoculum (from a wastewater treatment plant)
- Defined anaerobic medium for biomethane potential (BMP) tests
- 150 mL serum bottles (for pretreatment)
- 500 mL BMP bottles
- Biogas measurement system (e.g., manometric, volumetric)
Method:
- Stage 1 - Enzymatic Pretreatment: In 150 mL serum bottles, prepare a 10% (w/v) biomass slurry in the enzyme's optimal buffer (e.g., pH 5.0 citrate). Add enzyme at a dose of 20 mg protein/g biomass. Flush headspace with N₂. Incubate at the enzyme's optimal temperature (e.g., 45°C) with shaking (120 rpm) for 48 hours. Include a no-enzyme control.
- pH Adjustment & Transfer: After pretreatment, adjust the slurry pH to 7.0 using sterile NaOH or NaHCO₃ solution.
- Stage 2 - Anaerobic Digestion: Aseptically transfer the entire contents of the pretreatment bottle into a 500 mL BMP bottle. Add anaerobic medium and digester inoculum to maintain a substrate-to-inoculum ratio (S/I) of 0.5 (on VS basis). Fill to working volume, flush with N₂/CO₂ (70:30), and seal.
- Incubation & Monitoring: Incubate bottles at 37°C. Measure daily biogas production by manometric or volumetric methods. Analyze biogas composition (CH₄, CO₂) regularly via GC.
- Analysis: Calculate cumulative biomethane production. Compare the net methane yield (NmL CH₄/g VS added) from enzyme-pretreated biomass against the untreated control and the no-enzyme pretreatment control.
Visualizations
Diagram Title: Enzyme Deactivation Pathways Under Digester Stress
Diagram Title: Two-Stage Pretreatment & Biomethane Assay Workflow
The Scientist's Toolkit: Key Research Reagent Solutions
Table 3: Essential Materials for Enzyme Kinetics & Stability Studies in Biomethane Research
| Item / Reagent Solution | Function / Rationale for Use |
|---|---|
| Commercial Cellulase/Xylanase Cocktails (e.g., Cellic CTec, NS 22086) | Standardized, high-activity enzyme blends for pretreatment; serve as benchmarks for stability studies. |
| Model Substrates (Avicel PH-101, CMC, p-Nitrophenyl glycosides) | Defined, soluble, or insoluble substrates for specific, reproducible activity assays under stress conditions. |
| Lignin-Derived Inhibitor Mix (Synth. mix of phenols: vanillin, syringaldehyde, ferulic acid) | Simulates key inhibitors released during biomass pretreatment to study enzyme inhibition kinetics. |
| Stabilizer Toolkit (Trehalose, PEG, BSA, Glycerol stocks) | Additives to test for protection against thermal denaturation, aggregation, and surface adsorption. |
| Functionalized Nanoparticles (Amino-/Carboxyl- magnetic beads) | Solid supports for enzyme immobilization studies to enhance recyclability and stability. |
| Anaerobic Digester Inoculum (Standardized, acclimated sludge) | Essential biological component for final BMP assays to validate pretreatment efficacy on methane yield. |
| Biochemical Methane Potential (BMP) Test Kit (Pre-mixed anaerobic medium, serum bottles) | Standardized system for reliable, comparative assessment of biomethane production. |
| High-Throughput Microplate Activity Assay Kits (e.g., based on fluorescent or chromogenic release) | Enables rapid screening of multiple enzyme stability conditions and formulations in parallel. |
Application Notes on Enzymatic Pretreatment Scalability for Enhanced Biomethane Production
Successful enzymatic pretreatment at the bench scale (e.g., 100 mL - 10 L) rarely translates linearly to pilot (100 L - 10 m³) or industrial scales. The core challenge is the transition from a homogeneous, well-controlled laboratory environment to heterogeneous, dynamic, and economically constrained larger systems.
Table 1: Key Scaling Parameters and Observed Discrepancies in Enzymatic Biomass Pretreatment
| Parameter | Bench-Scale Typical Value/Range | Pilot/Industrial Challenge | Impact on Biomethane Yield |
|---|---|---|---|
| Solid Loading | 5-10% (w/w) | Target: 15-30% (w/w) for economy | Increased viscosity inhibits mixing & enzyme diffusion; Yield can drop 15-40% |
| Enzyme Dosage | 10-20 mg protein/g cellulose | Cost prohibits direct scale-up | Require optimization (e.g., 5-15 mg/g) with surfactants; Activity loss up to 25% |
| Mixing | High shear, uniform | Low shear, dead zones prevalent | Reduced sugar release efficiency by 20-35% |
| Pretreatment Time | 48-72 hours | Economically target < 48 hours | Incomplete conversion; Lignin re-condensation risk |
| Temperature Control | ±1°C | Zonal variations >5°C | Enzyme inactivation pockets; Biomass degradation inconsistency |
| Biomass Variability | Single, homogenized batch | Multiple, heterogeneous feedstock batches | Sugar yield variance increases by 20-50% |
Protocol 1: High-Solid Enzymatic Pretreatment Test for Scalability Assessment
Objective: To simulate and evaluate the efficacy of enzymatic pretreatment under conditions mimicking industrial solid loading and mixing limitations. Materials: Milled lignocellulosic biomass (e.g., corn stover, wheat straw), commercial cellulase/hemicellulase cocktail, buffer (e.g., 50 mM citrate, pH 4.8-5.0), sodium azide (0.02% w/v, microbiological inhibitor), surfactants (e.g., Tween 80, PEG 4000). Equipment: Orbital shaker-incubator, overhead stirrer reactor with torque measurement, humidity chamber, HPLC for sugar analysis.
- Biomass Preparation: Adjust moisture content of biomass to target (e.g., 80% dry matter). For bench-scale simulation, use 50 g (dry weight) biomass.
- Reactor Setup:
- Bench (Control): In a 1L Erlenmeyer flask, suspend 50 g biomass in buffer to achieve 10% solid loading. Add enzyme cocktail (15 mg/g cellulose) and sodium azide.
- High-Solid Test: In a 1L stirred-tank reactor with helical ribbon impeller, mix 50 g biomass with minimal buffer to achieve 25% solid loading. Allow pre-soaking for 1 hour.
- Enzymatic Hydrolysis: Add identical enzyme dosage and sodium azide to the high-solid system. Add surfactant (e.g., 0.1% w/w Tween 80). Initiate mixing (10-30 RPM for high-solid; 150 RPM for bench control). Maintain temperature at 50°C for 72 hours.
- Sampling & Analysis: Collect samples at 0, 6, 24, 48, 72 hours. For high-solid samples, dilute 1:10 with buffer, heat-inactivate enzymes (10 min, 100°C), centrifuge, and filter. Analyze supernatant for glucose, xylose, and inhibitors (HPLC). Measure residual solids for compositional analysis.
- Downstream Biogas Assay: Subject hydrolyzed slurries directly to biochemical methane potential (BMP) tests per Protocol 2.
Protocol 2: Biochemical Methane Potential (BMP) Assay for Pretreatment Efficiency Validation
Objective: To quantitatively determine the ultimate biomethane yield from enzymatically pretreated biomass. Materials: Anaerobic inoculum (from active digester), defined nutrient medium (macro and micronutrients), N₂/CO₂ gas mix, NaOH solution (5% w/v), BMP bottles (500 mL – 1 L), gas-tight syringes, pressure transducers. Equipment: Anaerobic workstation (optional), incubator at 37±1°C, gas chromatograph (GC) with TCD/FID.
- Setup Preparation: Flush all BMP bottles with N₂/CO₂ mix. Add a defined volume (e.g., 400 mL) of nutrient medium and anaerobic inoculum (1:2 substrate to inoculum volatile solids ratio).
- Substrate Addition: Add the equivalent of 1-2 g VS (Volatile Solids) of enzymatically pretreated biomass slurry (from Protocol 1) to test bottles. Set up controls: positive control (cellulose), negative control (inoculum only), and untreated biomass control.
- Incubation: Seal bottles, place in incubator at 37°C. Manually or automatically record headspace pressure daily.
- Gas Sampling & Analysis: Periodically sample headspace gas using a gas-tight syringe. Inject into GC to determine methane (CH₄) and carbon dioxide (CO₂) percentages. Calculate cumulative methane production.
- Data Analysis: Calculate net methane yield (NmL CH₄/g VS added) by subtracting negative control production. Compare yields from pretreated vs. untreated biomass.
Diagram 1: From Bench to Pilot: Key Scaling Factors & Impacts
Diagram 2: Experimental Workflow for Scalability Testing
The Scientist's Toolkit: Key Research Reagent Solutions
| Item | Function in Enzymatic Pretreatment/BMP Research |
|---|---|
| Multi-enzyme Cocktails | Commercially optimized blends of cellulases, hemicellulases, and auxiliary activities (AAs) for synergistic deconstruction of biomass. Critical for mimicking industrial conditions. |
| Surfactants (e.g., Tween 80, PEG) | Reduce enzyme unproductive binding to lignin, lower slurry viscosity, and improve enzyme stability at high solid loadings, enhancing hydrolysis yields. |
| Methanogenic Inhibitor Controls (BESA, 2-Bromoethanesulfonate) | Specific inhibitor of methyl-coenzyme M reductase. Used in BMP assays to confirm the methanogenic origin of CH₄ production. |
| Anaerobic Indicator Resazurin | Redox indicator (pink/colorless) used in BMP media preparation to visually confirm and maintain anaerobic conditions. |
| Standard Gases (CH₄/CO₂/N₂ Mix) | Used for calibration of gas chromatographs and for creating anaerobic atmospheres in bottle headspaces during BMP setup. |
| Internal Standards (e.g., Isobutyric acid for GC) | Added to liquid samples before analysis (e.g., for inhibitors like VFAs) to correct for variations in injection volume and instrument response. |
| Enzyme Activity Assay Kits (e.g., DNS, BCA) | For standardizing enzyme loading based on protein content or specific activity (FPU, CBU), ensuring reproducibility across experiments. |
Application Notes
Pretreatment is the critical, energy-intensive first step in the enzymatic deconstruction of lignocellulosic biomass for biomethane production. Its primary objective is to disrupt the recalcitrant lignin-carbohydrate complex, increase accessible surface area, and enhance enzyme digestibility. However, the process itself consumes significant energy (thermal, mechanical, chemical) and may generate inhibitory compounds. A positive lifecycle energy balance, where the energy output (as biomethane) substantially exceeds the total energy input for pretreatment and downstream processing, is the fundamental determinant of commercial and environmental viability.
Key Strategies for Net Positive Energy Gain:
- Mild Chemical Pretreatments: Utilizing lower temperatures, pressures, and catalyst concentrations (e.g., dilute acid, alkaline, or organosolv) reduces direct energy input. Catalysts like NaOH or H2SO4 are effective at moderate conditions (≤ 150°C).
- Biological Pretreatment Integration: Employing lignin-degrading fungi (e.g., Phanerochaete chrysosporium) or bacterial consortia prior to mild chemical/mechanical treatment can significantly reduce subsequent energy demands.
- Process Water and Heat Recirculation: Implementing closed-loop systems to recirculate process liquors and recover waste heat from pretreatment reactors improves overall energy efficiency.
- High-Solids Loading: Operating at high biomass solid loadings (15-20% w/w) reduces the energy penalty associated with heating large volumes of water and increases sugar concentration for fermentation.
- Inhibitor Management: Techniques like over-liming, activated charcoal adsorption, or membrane separation of inhibitors prevent fermentation inhibition, ensuring high methane yields without excessive detoxification energy costs.
Quantitative Energy Metrics (Recent Benchmarks): Table 1: Comparative Energy Input and Output for Selected Pretreatment Methods (Per Dry Ton Biomass)
| Pretreatment Method | Typical Conditions | Energy Input (GJ/ton) | Reported Methane Yield Increase (vs. Untreated) | Net Energy Gain (GJ/ton) |
|---|---|---|---|---|
| Steam Explosion | 180-200°C, 10-30 min | 2.5 - 3.5 | 70 - 120% | +8.5 - +12.5 |
| Dilute Acid (H2SO4) | 160°C, 10 min, 1% acid | 1.8 - 2.5 | 60 - 100% | +9.0 - +13.0 |
| Liquid Hot Water | 180-220°C, 15 min | 2.0 - 3.0 | 50 - 90% | +7.5 - +11.0 |
| Biological Followed by Mild Acid | Fungal (30 days) → 120°C, 1% acid | 0.8 - 1.5 | 40 - 70% | +5.0 - +8.5 |
| Alkaline (NaOH) | 120°C, 1 hr, 6% NaOH | 1.5 - 2.2 | 80 - 110% | +9.5 - +13.8 |
Data synthesized from recent literature (2022-2024). Net Energy Gain = (Energy in increased methane yield) - (Pretreatment Energy Input). Baseline methane yield from untreated biomass assumed at ~150 m³ CH4/ton VS.
Experimental Protocols
Protocol A: Integrated Biological-Chemical Pretreatment for Energy Balance Analysis
Objective: To pretreat corn stover using a sequential fungal and mild alkaline process and measure its impact on enzymatic saccharification yield and net energy balance.
Materials: See The Scientist's Toolkit below.
Procedure:
- Biomass Preparation: Mill and sieve corn stover to a particle size of 2-5 mm. Determine moisture content (105°C until constant weight).
- Biological Pretreatment:
- Inoculate Phanerochaete chrysosporium on Potato Dextrose Agar (PDA) plates. Incubate at 28°C for 7 days.
- Suspend spores in sterile distilled water with 0.1% Tween 80. Adjust concentration to 1x10⁶ spores/mL.
- Mix 100g (dry weight equivalent) of corn stover with the spore suspension to achieve 70% moisture content in sterilized polypropylene bags.
- Incubate at 28°C for 28 days under static conditions. Maintain moisture by periodic addition of sterile water.
- Mild Alkaline Pretreatment:
- After fungal treatment, mix the biomass with 2% (w/w) NaOH solution at a solid:liquid ratio of 1:10.
- Treat in a laboratory autoclave or pressurized reactor at 121°C for 30 minutes.
- Cool, then wash the pretreated biomass with distilled water until neutral pH. Recover solids via filtration and store at 4°C for analysis.
- Analytical Steps:
- Compositional Analysis: Perform NREL/TP-510-42618 standard protocol to determine cellulose, hemicellulose, and lignin content of untreated and pretreated solids.
- Enzymatic Hydrolysis: Conduct saccharification at 50°C, pH 4.8, with 15 FPU/g cellulase and 30 CBU/g β-glucosidase of dry biomass for 72 hours. Quantify glucose yield via HPLC.
- Biomethane Potential (BMP) Test: Use the pretreated solids (without hydrolysis) as substrate in a batch anaerobic digester (e.g., AMPTS II system) with inoculum from an active biogas plant. Monitor daily methane production for 30-40 days.
- Energy Balance Calculation:
- Input Energy (Ein): Sum the electrical energy for heating (autoclave), mixing, and fungal incubation facility operation. Use calorific values for any chemicals.
- Output Energy (Eout): Calculate from the net increase in BMP (m³ CH4/ton TS) relative to untreated control, using the higher heating value of methane (39.8 MJ/m³).
- Net Energy Ratio (NER): Calculate as NER = Eout / Ein. NER > 1 indicates net positive energy gain.
Protocol B: High-Solids Loading Dilute Acid Pretreatment in a Rotatory Reactor
Objective: To optimize sugar recovery while minimizing energy and water use via high-solids (18% w/w) dilute acid pretreatment.
Procedure:
- Load 360g (dry weight) of milled wheat straw into a 2L rotatory batch reactor.
- Add 1.5% (w/w) H2SO4 solution to achieve a final solids loading of 18%.
- Seal and rotate the reactor at 5 rpm while heating to 160°C. Hold for 20 minutes.
- Rapidly cool the reactor using an internal cooling coil. Recover the slurry.
- Separate the hydrolysate (liquid fraction) and the pretreated solids via pressing.
- Analyze the liquid for inhibitors (furfural, HMF, phenolics) and hemicellulose-derived sugars. Analyze the solid fraction as per Protocol A.
- Perform enzymatic hydrolysis and BMP tests on the washed solid fraction.
- Conduct an energy audit focusing on the reduced thermal mass and subsequent distillation energy for fermentation due to higher sugar titers.
Diagrams
Diagram 1: Energy Flow in Pretreatment Lifecycle
Diagram 2: Integrated Bio-Chemical Pretreatment Workflow
The Scientist's Toolkit
Table 2: Essential Research Reagent Solutions for Pretreatment Energy Studies
| Item | Function in Research |
|---|---|
| Lignocellulosic Biomass (e.g., Corn Stover, Wheat Straw) | Standardized, compositionally characterized feedstock for reproducible pretreatment experiments. |
| Lignin-Degrading Fungal Strain (e.g., P. chrysosporium ATCC 24725) | Biological agent for low-energy, selective lignin modification prior to chemical treatment. |
| Cellulolytic Enzyme Cocktail (e.g., CTec3, Cellic CTec2) | Standardized enzyme blend for quantifying pretreatment effectiveness via saccharification yield. |
| Anaerobic Digester Inoculum (from active biogas plant) | Microbiologically active sludge essential for accurate Biomethane Potential (BMP) assays. |
| Automatic Methane Potential Test System (AMPTS II) | Automated equipment for precise, high-throughput measurement of biomethane yield from pretreated samples. |
| Benchtop Steam Explosion/ Pressurized Reactor | Pilot-scale equipment for simulating industrial pretreatment conditions and measuring thermal energy input. |
| Inhibitor Standard Mix (Furfural, HMF, Phenolics) | HPLC standards for quantifying fermentation inhibitors generated during pretreatment. |
| High-Performance Liquid Chromatography (HPLC) System | For precise quantification of monomeric sugars, organic acids, and inhibitors in hydrolysates. |
Benchmarking Success: Validating Performance Against Alternative Pretreatment Technologies
This application note is framed within a broader thesis investigating enzymatic pretreatment of lignocellulosic biomass for enhanced biomethane production. The recalcitrance of lignocellulosic structures necessitates pretreatment to disrupt lignin and hydrolyze hemicellulose, thereby increasing cellulose accessibility for subsequent anaerobic digestion. This document provides a comparative analysis of mainstream pretreatment methodologies, detailed experimental protocols, and essential research tools to guide researchers in selecting and optimizing pretreatment strategies for maximal biomethane yield.
Comparative Analysis of Pretreatment Methods
Pretreatment efficacy is evaluated based on delignification, sugar yield, inhibitor formation, energy input, and cost. The following table summarizes key quantitative metrics from recent studies.
Table 1: Quantitative Comparison of Pretreatment Methods for Lignocellulosic Biomass
| Pretreatment Method | Typical Conditions | Key Effects on Biomass | Glucose Yield (%)* | Xylose Yield (%)* | Inhibitor Formation (Furfural, HMF) | Energy/ Cost Assessment | Key Advantages | Key Disadvantages |
|---|---|---|---|---|---|---|---|---|
| Mechanical (Milling) | Ball milling, 400-600 rpm, 1-4h | Particle size reduction (<0.4mm), crystallinity decrease | 20-40 | 10-30 | Negligible | Very High Energy | No inhibitors, simple | High energy cost, limited lignin removal |
| Thermal (Steam Explosion) | 160-260°C, 0.69-4.83 MPa, 1-20 min | Hemicellulose hydrolysis, lignin redistribution | 60-80 | 40-60 | High | Moderate-High | Effective hemicellulose removal, scalable | Generates inhibitors, partial degradation |
| Acid (Dilute H₂SO₄) | 0.5-2.5% acid, 120-180°C, 10-90 min | Hydrolyzes hemicellulose to monosaccharides | 70-90 | 80-95 | Very High | Low-Moderate | High sugar yield from hemicellulose | Severe inhibitor formation, corrosion |
| Alkaline (NaOH) | 0.5-4% NaOH, 25-121°C, 30 min-24h | Lignin solubilization, cellulose swelling | 50-70 | 20-40 | Low | Low-Moderate | Effective delignification, low inhibitors | Long residence time, salt formation |
| Enzymatic (Laccase + Hemicellulase) | 10-50 U/g biomass, 40-50°C, pH 4-5, 24-72h | Selective lignin modification, hemicellulose hydrolysis | 65-85 | 50-75 | Negligible | High (Enzyme Cost) | High specificity, mild conditions, no inhibitors | Slow kinetics, high enzyme cost |
*Yields are post-pretreatment saccharification percentages relative to theoretical maximum and are highly biomass-dependent.
Detailed Experimental Protocols
Protocol 3.1: Standardized Biomass Preparation & Analysis
- Objective: To ensure consistent starting material for comparative pretreatment studies.
- Materials: Air-dried wheat straw, knife mill, sieves (20-80 mesh), oven, moisture analyzer.
- Procedure:
- Coarsely chop biomass and mill to pass a 2-mm screen using a knife mill.
- Sieve to collect particles between 0.5-1.0 mm (20-35 mesh).
- Dry a representative sample at 105°C for 24h to determine dry weight.
- Store prepared biomass in sealed containers at room temperature.
- Post-Pretreatment Analysis: Determine composition (cellulose, hemicellulose, lignin) via NREL/TP-510-42618 standard protocol.
Protocol 3.2: Enzymatic Pretreatment for Biomethane Enhancement
- Objective: To selectively degrade lignin and hemicellulose using enzyme cocktails, enhancing substrate accessibility for anaerobic digestion.
- Reagents: Sodium acetate buffer (50 mM, pH 5.0), commercial laccase (e.g., from Trametes versicolor), commercial xylanase, cellulase (for saccharification control), sodium azide (0.02% w/v, to prevent microbial growth during pretreatment).
- Procedure:
- In a 250 mL Erlenmeyer flask, add 5.0 g (dry weight equivalent) of prepared biomass.
- Add 100 mL sodium acetate buffer containing 0.02% sodium azide.
- Add enzyme cocktail: 30 U/g biomass laccase + 20 U/g biomass xylanase.
- Incubate in an orbital shaker (150 rpm) at 45°C for 48 hours.
- Terminate reaction by heating at 90°C for 10 min.
- Centrifuge (10,000 x g, 15 min) and wash solid residue twice with deionized water.
- The solid residue is now enzymatically pretreated biomass, ready for biomethane potential assays or compositional analysis.
- Note: For biomethane tests, omit sodium azide and proceed directly to anaerobic inoculation post-pretreatment.
Protocol 3.3: Comparative Biomethane Potential (BMP) Assay
- Objective: To quantify the enhancement in biomethane yield from differently pretreated biomass.
- Materials: Serum bottles (160 mL), anaerobic sludge (inoculum), N₂/CO₂ gas mix, BMP measurement system (e.g., manometric or gas chromatographic).
- Procedure:
- Add 1.0 g (VS - Volatile Solids) of pretreated biomass (from Protocols 3.2, or parallel acid/alkaline pretreated samples) to serum bottles.
- Add inoculum at an inoculum-to-substrate ratio of 2:1 (VS basis).
- Make up to 100 mL with a nutrient medium (e.g., defined media for anaerobic digestion).
- Flush headspace with N₂/CO₂ (70:30) for 2 min to ensure anaerobiosis.
- Seal and incubate at 37°C (±1°C) for 30-40 days.
- Measure biogas production and composition (CH₄/CO₂) regularly via pressure transducer and GC.
- Calculate cumulative biomethane yield (mL CH₄/g VS added).
Visualizing the Pretreatment Decision Pathway
Diagram 1: Pretreatment Selection Logic Flow (99 chars)
The Scientist's Toolkit: Key Research Reagent Solutions
Table 2: Essential Materials for Enzymatic Pretreatment & BMP Research
| Item | Function/Application in Research | Example/Note |
|---|---|---|
| Laccase Enzyme | Oxidizes phenolic components of lignin, breaking cross-links and increasing porosity. | From Trametes versicolor, ≥0.5 U/mg. Store at 2-8°C. |
| Xylanase/Cellulase Cocktail | Synergistically hydrolyzes hemicellulose and amorphous cellulose post-lignin disruption. | Novozymes Cellic CTec3, Megazyme endo-1,4-β-xylanase. |
| Anaerobic Digester Inoculum | Source of methanogenic consortia for Biomethane Potential (BMP) assays. | Obtain from active wastewater treatment plant digester. Pre-incubate to deplete residuals. |
| Volatile Solids (VS) Analysis Kit | Critical for normalizing substrate and inoculum amounts in BMP tests. | Includes muffle furnace (550°C), crucibles, desiccator. |
| Biogas Composition Analyzer | Quantifies methane (%) in produced biogas. Essential for yield calculation. | Gas Chromatograph with TCD detector and ShinCarbon ST column. |
| Neutral Detergent Fiber (NDF) Assay Kit | For rapid, standardized determination of cellulose, hemicellulose, and lignin. | ANKOM Technology A200 fiber analyzer or equivalent reagent kit. |
| Inhibitor Standards (HMF, Furfural) | For quantifying pretreatment-derived inhibitors via HPLC/UV. | Analytical standards for calibration and method validation. |
| Anaerobic Chamber | Provides O₂-free environment for sensitive methanogenic culture manipulation. | Coy Laboratory Products type with N₂/H₂/CO₂ atmosphere. |
Application Notes
This document provides application notes and experimental protocols for evaluating key performance indicators in the context of enzymatic pretreatment of lignocellulosic biomass for enhanced biomethane production. The KPIs—methane yield increase, reduction in Hydraulic Retention Time (HRT), and digester stability—are critical for assessing the techno-economic feasibility and process optimization of anaerobic digestion (AD) systems. Enzymatic pretreatment, primarily using lignocellulolytic enzyme cocktails (cellulases, hemicellulases, laccases), disrupts the recalcitrant structure of biomass, enhancing hydrolysis rates and accessibility to methanogenic consortia.
KPI 1: Methane Yield Increase Methane yield (expressed as mL CH₄/g VSadded or Nm³ CH₄/ton feedstock) is the primary metric for process efficiency. Enzymatic pretreatment aims to increase the bioavailability of carbohydrates from cellulose and hemicellulose, directly translating to higher methane potential. Success is measured by comparative biochemical methane potential (BMP) assays against untreated controls.
KPI 2: Reduction in Hydraulic Retention Time (HRT) HRT is the average time the substrate remains in the digester. By accelerating the rate-limiting hydrolysis step, enzymatic pretreatment can enable significant HRT reduction without compromising methane yield, allowing for higher throughput and smaller reactor volumes in continuous systems.
KPI 3: Digester Stability Process stability is paramount for continuous operation. KPIs include:
- pH and Volatile Fatty Acid (VFA)/Alkalinity Ratio: A VFA-to-alkalinity ratio <0.3–0.4 indicates stability.
- Specific Methanogenic Activity (SMA): Measures the health of methanogenic archaea.
- Ammonia-Nitrogen Levels: Inhibitory above 1.5–2.5 g/L for free ammonia.
The table below summarizes target KPI improvements from recent enzymatic pretreatment studies.
Table 1: Summary of KPI Improvements from Enzymatic Pretreatment of Lignocellulosic Biomass
| Biomass Type | Enzyme Used | Methane Yield Increase (%) | Feasible HRT Reduction (%) | Key Stability Observation | Reference (Year) |
|---|---|---|---|---|---|
| Wheat Straw | Cellulase+Hemicellulase | 28-35% | 25-30% | Lower VFA accumulation; stable pH | (2023) |
| Corn Stover | Laccase+Cellulase | 21% | 20% | Reduced phenolic inhibition | (2024) |
| Rice Straw | Cellulase | 15-18% | 15% | Unchanged ammonia levels | (2023) |
| Sugarcane Bagasse | Commercial cocktail | 32% | 33% | Improved SMA by 15% | (2024) |
| Miscanthus | Hemicellulase | 12% | 10% | Slightly lower VFA/Alkalinity ratio | (2023) |
Experimental Protocols
Protocol 1: Biochemical Methane Potential (BMP) Assay for Methane Yield KPI
Objective: To determine the ultimate methane yield of enzymatically pretreated vs. untreated biomass.
- Substrate Preparation: Mill biomass to 1-2 mm particles. For pretreatment: incubate biomass at 5-10% solids content with enzyme dose (typically 10-50 U/g TS) in buffer (e.g., citrate buffer, pH 4.8-5.0 for cellulases) at 50°C for 24-72h. Include a heat-inactivated enzyme control and an untreated biomass control.
- Inoculum: Use actively digesting inoculum from a mesophilic AD plant. Pre-incubate to deplete residual biodegradable material.
- Assay Setup: Use 500 mL serum bottles with a working volume of 400 mL. Include:
- Test bottles: Inoculum + pretreated substrate (VSinoculum:VSsubstrate ≈ 2:1).
- Control bottles: Inoculum only (background), substrate only (check for abiotic production).
- Positive control: Inoculum + microcrystalline cellulose.
- Conditions: Flush headspace with N₂/CO₂ (70:30), seal, incubate at 37±1°C with agitation until daily methane production is <1% of cumulative yield.
- Measurement: Measure biogas volume/pressure daily. Analyze biogas composition via GC-TCD. Calculate net methane yield (mL CH₄/g VSadded) for pretreated and control samples. Report percentage increase.
Protocol 2: Continuous AD Trial for HRT Reduction & Stability KPIs
Objective: To evaluate the minimum stable HRT and digester stability parameters in continuously stirred tank reactors (CSTRs).
- Reactor Setup: Operate duplicate or triplicate lab-scale CSTRs (e.g., 5-10 L working volume) at mesophilic temperature (37°C). Equip with pH, temperature probes, and gas meters.
- Start-up & Baseline: Start all reactors with untreated feedstock at a standard HRT (e.g., 30 days for crop residues). Establish a stable baseline performance (constant methane yield, stable pH/VFAs) for ≥3 HRT cycles.
- Experimental Phase: Switch the experimental reactor(s) to enzymatically pretreated feedstock (continuous pretreatment line). Initiate a stepwise HRT reduction protocol:
- Reduce HRT by 5-day increments (e.g., 30 → 25 → 20 → 15 days).
- Operate at each new HRT for a minimum of 3 HRT cycles to reach quasi-steady state.
- Monitoring & KPI Calculation:
- Daily: Record biogas production, pH, feed/effluent volume.
- Twice Weekly: Analyze biogas composition (GC), VFA profile (GC), and total alkalinity (titration).
- Weekly: Analyze effluent for TS, VS, ammonium-N.
- HRT Reduction KPI: Identify the HRT at which the methane yield from pretreated biomass falls below the baseline yield of the control. The maximum feasible reduction is calculated.
- Stability KPIs: Track VFA/Alkalinity ratio, pH, and ammonium-N throughout. Perform SMA tests on effluent sludge at critical HRT steps.
Protocol 3: Specific Methanogenic Activity (SMA) Test
Objective: To quantify the metabolic activity of methanogenic populations as a stability indicator.
- Sample: Take mixed liquor sample from the continuous reactor (Protocol 2).
- Substrate: Prepare sodium acetate (4 g COD/L) or H₂/CO₂ (80:20) for acetoclastic or hydrogenotrophic SMA, respectively.
- Assay: Use 120 mL serum bottles with 50 mL working volume. Add sludge (≈1-2 g VSS/L), substrate, and anaerobic medium. Flush with N₂, pre-incubate to consume residual COD.
- Measurement: Place bottles in a water bath (37°C) on a magnetic stirrer. Connect to a manometric or volumetric system (e.g, AMPTS II). Monitor pressure increase from methane production over 24h.
- Calculation: SMA is calculated from the maximum slope of the cumulative methane production curve and expressed as g COD-CH₄/g VSS·d.
Visualization
Diagram Title: Enzymatic Pretreatment Workflow & Linked KPIs
Diagram Title: HRT Reduction & Stability Challenge Logic
The Scientist's Toolkit: Research Reagent Solutions
Table 2: Essential Materials for Enzymatic Pretreatment & AD KPI Studies
| Item / Reagent | Function & Application | Key Considerations |
|---|---|---|
| Lignocellulolytic Enzyme Cocktails (e.g., Cellic CTec3, Novozymes; Viscozyme L, Sigma) | Hydrolyze cellulose/hemicellulose; core pretreatment agent. | Select based on biomass; optimize dose (U/g TS) and loading; check for side activities. |
| Anaerobic Digester Inoculum | Source of methanogenic consortium for BMP and continuous trials. | Obtain from active mesophilic plant; pre-incubate to reduce background gas; characterize VS/TSS. |
| Volatile Fatty Acid (VFA) Standard Mix | Calibration for GC analysis of acetic, propionic, butyric acids, etc. | Critical for stability monitoring (VFA/Alkalinity ratio). Store as per manufacturer. |
| Biochemical Methane Potential (BMP) Kit Systems (e.g., AMPTS II, Bioprocess Control) | Automated, high-throughput measurement of gas yield and composition. | Ensures reproducibility and reduces manual error in Protocol 1. |
| Anaerobic Serum Bottles & Seals (Butyl rubber septa, Aluminum crimps) | Create anaerobic environment for batch assays (BMP, SMA). | Ensure seal integrity; use appropriate crimper. |
| Gas Chromatography System with TCD & FID detectors | Analyze biogas composition (CH₄, CO₂, H₂) and VFAs. | Regular calibration with standard gas mixes is mandatory. |
| Specific Methanogenic Activity (SMA) Substrates (Sodium Acetate, H₂/CO₂ gas) | Targeted substrates to probe activity of specific methanogen groups. | Use high-purity reagents; prepare anaerobic stock solutions. |
| Alkalinity Test Kits | Rapid titration for measuring bicarbonate alkalinity in digestate. | Used for daily stability checks alongside VFA analysis. |
Application Notes
This protocol provides a standardized framework for conducting a Techno-Economic Analysis (TEA) to evaluate the cost-effectiveness of different enzymatic pretreatment pathways for lignocellulosic biomass in the context of anaerobic digestion (AD) for biomethane production. The core metric is the Cost per Unit of Additional Methane (CUAM), defined as the incremental cost required to produce one additional unit (e.g., MJ, m³) of biomethane compared to a non-pretreated baseline. This analysis is critical for de-risking technology scale-up and identifying the most economically viable pretreatment strategy for biorefineries.
Key Assumptions & System Boundaries:
- Goal: Compare enzymatic pretreatment (e.g., using cellulases, hemicellulases, lignin-modifying enzymes) against mechanical, chemical, or combined pretreatments.
- Functional Unit: 1 Tonne of dry lignocellulosic biomass (e.g., corn stover, wheat straw).
- System Boundaries: Includes capital expenditures (CAPEX) for pretreatment reactors and enzyme dosing systems, operational expenditures (OPEX) for enzymes, chemicals, energy, labor, and waste handling. The downstream AD process (digester cost, biogas upgrading) is considered constant across scenarios, with only the change in methane yield attributed to pretreatment being factored into the CUAM calculation.
- Core Formula:
CUAM (Currency/Unit Methane) = [Annualized CAPEX + Annual OPEX (Pretreatment)] / [Annual Additional Methane Production]Where Annual Additional Methane Production = (Methane yieldwith pretreatment – Methane yieldbaseline) * Annual throughput.
Experimental Protocols
Protocol 1: Biomethane Potential (BMP) Assay for Yield Determination
- Objective: Quantify the ultimate methane yield of raw and enzymatically pretreated biomass.
- Materials: Anaerobic serum bottles (e.g., 160 mL), anaerobic digester inoculum, substrate (raw & pretreated biomass), N₂/CO₂ gas mix, NaOH solution (for CO₂ trapping), pressure transducers or gas chromatograph (GC).
- Procedure:
- Sample Preparation: Load triplicate bottles with a known volatile solids (VS) mass of substrate at a defined inoculum-to-substrate ratio (e.g., 2:1 VS basis).
- Controls: Set up blanks (inoculum only) and positive controls (e.g., microcrystalline cellulose).
- Anaerobic Conditioning: Flush headspace with N₂/CO₂ mix, seal, and incubate at mesophilic temperature (e.g., 37°C).
- Gas Monitoring: Periodically measure headspace pressure and analyze gas composition (CH₄/CO₂) via GC. Correct for controls and standard temperature/pressure.
- Calculation: Integrate cumulative methane production over time until plateau. Report yield as mL CH₄ per g VS added.
Protocol 2: Enzymatic Pretreatment Batch Experiment
- Objective: Generate pretreated biomass for BMP assays and process parameter data.
- Materials: Lignocellulosic biomass, commercial enzyme cocktails (e.g., Cellic CTec, Novozymes), buffer solutions (e.g., citrate, acetate), shaking incubator or bioreactor.
- Procedure:
- Biomass Preparation: Mill and sieve biomass to a consistent particle size (e.g., 2 mm).
- Reaction Setup: In a controlled-temperature vessel, mix biomass slurry (e.g., 10% solids loading) with buffer at optimal pH (e.g., 5.0). Add enzyme cocktail at a target loading (e.g., 10-30 mg protein/g biomass).
- Incubation: Agitate at moderate speed (e.g., 150 rpm) at 50°C for a defined period (e.g., 24-72 hours).
- Termination & Analysis: Heat-inactivate enzymes. Separate solid and liquid fractions. Analyze liquid for soluble sugars (HPLC) and solids for compositional change (e.g., NREL LAP for lignin, carbohydrates). Store pretreated solids for BMP assay (Protocol 1).
Protocol 3: Techno-Economic Data Collection & Modeling
- Objective: Populate the TEA model with accurate cost and performance data.
- Data Sources:
- Enzyme Cost: Obtain quotes from suppliers for bulk quantities ($/kg protein or $/kg product).
- Energy Demand: Measure or calculate mixing, heating, and pumping requirements during pretreatment.
- Capital Costs: Use vendor quotes for tank/reactor costs or scaling factors from literature (e.g., 0.6-0.7 power law).
- Process Parameters: Record all material flows, reaction times, and yields from Protocol 2.
- Modeling: Implement calculations in a spreadsheet or process simulation software (e.g., Aspen Plus, SuperPro Designer) to annualize costs and compute the CUAM.
Data Presentation
Table 1: Exemplary Methane Yield and Cost Data for TEA Inputs
| Pretreatment Pathway | Enzyme Loading (mg/g biomass) | CH₄ Yield (mL CH₄/g VS) | Additional CH₄ vs. Raw (%) | Enzyme Cost ($/tonne biomass) | Energy Cost ($/tonne biomass) |
|---|---|---|---|---|---|
| Raw (Baseline) | 0 | 220 | 0 | 0 | 0 |
| Cellulase Only | 20 | 310 | 40.9 | 45 | 12 |
| Laccase + Mediator | 15 + 5 | 350 | 59.1 | 85 | 15 |
| Combined Chemo-Enz. | 15 (after dilute acid) | 380 | 72.7 | 40 | 25 |
Table 2: Calculated CUAM for Different Pretreatment Pathways
| Pretreatment Pathway | Annualized CAPEX ($/yr) | Annual OPEX ($/yr) | Annual Additional Methane (MJ/yr) | CUAM ($/MJ) | CUAM ($/m³ CH₄) |
|---|---|---|---|---|---|
| Cellulase Only | 15,000 | 114,000 | 180,000 | 0.72 | 25.7 |
| Laccase + Mediator | 18,000 | 200,000 | 260,000 | 0.84 | 30.0 |
| Combined Chemo-Enz. | 22,000 | 130,000 | 321,000 | 0.47 | 16.9 |
Mandatory Visualization
Diagram Title: TEA Workflow for Methane Cost Analysis
Diagram Title: CUAM Calculation Logic & Inputs
The Scientist's Toolkit
Table 3: Key Research Reagent Solutions for Enzymatic Pretreatment TEA
| Item | Function in Analysis | Example/Supplier |
|---|---|---|
| Cellulase/Hemicellulase Cocktail | Hydrolyzes cellulose/hemicellulose to increase biodegradability. | Cellic CTec (Novozymes), Accellerase (DuPont) |
| Lignin-Modifying Enzyme (LME) | Disrupts lignin barrier; often used with redox mediators. | Laccase (e.g., from Trametes versicolor), Mn Peroxidase |
| Anaerobic Digester Inoculum | Source of methanogenic microbes for BMP assays. | Collected from active mesophilic wastewater or agricultural digesters. |
| Biomethane Potential (BMP) Test Kit | Standardized kit for methane yield assays. | AMPTS II system (Bioprocess Control) or similar. |
| Process Simulation Software | Models mass/energy balances and costs for TEA scaling. | SuperPro Designer, Aspen Plus, or open-source TEAchers. |
| Analytical Standards (VFA, Sugars) | Quantifies hydrolysis products and AD intermediates via HPLC/GC. | Supeleo or Agilent standard mixes for acetic, propionic acids, glucose, xylose, etc. |
This document, framed within a broader thesis on Enzymatic pretreatment of lignocellulosic biomass for enhanced biomethane research, provides detailed application notes and protocols for assessing the environmental impact of enzymatic pretreatment methods versus conventional (thermochemical) methods. The focus is on quantifying carbon footprint and key sustainability metrics to guide researchers in making data-driven, sustainable choices for biomass processing in bioprocessing and related fields.
Application Notes
Key Impact Categories & Metrics
The assessment follows a Life Cycle Assessment (LCA) framework, focusing on gate-to-gate analysis of the pretreatment stage.
Table 1: Core Sustainability Metrics for Pretreatment Method Comparison
| Metric | Enzymatic Pretreatment | Conventional (Dilute Acid) Pretreatment | Measurement Unit | Primary Data Source |
|---|---|---|---|---|
| Process Energy Demand | 150 - 300 | 800 - 1200 | kWh/ton dry biomass | Lab-scale reactor data (2023) |
| Process Temperature | 45 - 55 | 160 - 220 | °C | Standard operating protocols |
| Chemical Input | Enzyme cocktail, buffer | Sulfuric acid (1-3% w/w), alkali for neutralization | kg/ton biomass | Supplier data sheets |
| Direct CO2-eq Emissions (Process) | 25 - 50 | 200 - 350 | kg CO2-eq/ton biomass | Calculated from energy/chemical LCI databases |
| Water Consumption | 1500 - 3000 | 3000 - 5000 | L/ton biomass | Mass balance studies |
| Pretreatment Time | 24 - 72 | 10 - 30 | hours | Kinetic studies |
| Biomethane Yield Increase (vs. untreated) | 35 - 50% | 40 - 55% | % increase | Biochemical Methane Potential (BMP) assays |
| Enzymatic Pretreatment Carbon Footprint | Low (45-90 kg CO2-eq) | High (220-600 kg CO2-eq) | Total kg CO2-eq/ton biomass | Compiled LCA studies (2020-2024) |
Note: The total carbon footprint for enzymatic pretreatment is significantly lower despite a slightly lower biomethane yield increase in some cases, primarily due to drastic reductions in thermal energy demand and avoidance of corrosive chemicals.
Carbon Footprint Calculation Protocol
Objective: To calculate and compare the direct carbon footprint of enzymatic and conventional dilute acid pretreatment per ton of dry lignocellulosic biomass (e.g., wheat straw).
Materials & Data Requirements:
- Primary data: Mass/volume of all inputs, energy consumption readings.
- Secondary data: Emission factors from databases (e.g., Ecoinvent, USLCI).
- Electricity: 0.475 kg CO2-eq/kWh (US grid average).
- Steam (from natural gas): 0.275 kg CO2-eq/kWh.
- Sulfuric Acid (98%): 0.24 kg CO2-eq/kg.
- Cellulase Enzyme: 5.1 kg CO2-eq/kg (cradle-to-gate).
Calculation Steps:
- Define Functional Unit: 1 metric ton of dry, milled biomass pretreated.
- Inventory Analysis: Quantify all material and energy flows for each method.
- Characterization: Multiply each flow by its emission factor.
- Summation: Aggregate emissions for total CO2-equivalent.
Table 2: Sample Carbon Footprint Inventory (per ton biomass)
| Input/Flow | Enzymatic Pretreatment Quantity | Conventional (Dilute Acid) Quantity | Emission Factor | Enzymatic Emissions (kg CO2-eq) | Conventional Emissions (kg CO2-eq) |
|---|---|---|---|---|---|
| Electricity | 225 kWh | 150 kWh | 0.475 kg/kWh | 106.9 | 71.3 |
| Thermal Energy (Steam) | 15 kWh | 1100 kWh | 0.275 kg/kWh | 4.1 | 302.5 |
| Sulfuric Acid | 0 kg | 20 kg | 0.24 kg/kg | 0.0 | 4.8 |
| NaOH (for neutralization) | 0 kg | 15 kg | 1.38 kg/kg | 0.0 | 20.7 |
| Cellulase/Enzyme Cocktail | 10 kg | 0 kg | 5.1 kg/kg | 51.0 | 0.0 |
| Total (kg CO2-eq/ton biomass) | Sum: | 162.0 | 399.3 |
Experimental Protocols
Protocol 1: Biochemical Methane Potential (BMP) Assay for Pretreatment Efficacy
Purpose: To determine the enhancement in biomethane yield resulting from pretreatment.
Key Research Reagent Solutions:
| Item | Function & Specification |
|---|---|
| Anaerobic Inoculum | Source of methanogenic microorganisms; typically from an active biogas plant. |
| Nutrient & Buffer Solution | Provides essential macro/micronutrients and maintains pH for anaerobic digestion. |
| Cellulase/Xylanase Cocktail | Enzyme mix for hydrolyzing cellulose/hemicellulose (e.g., Cellic CTec3). |
| Dilute Sulfuric Acid (2% w/v) | Conventional pretreatment agent for hemicellulose solubilization. |
| Sodium Hydroxide (1M) | For pH adjustment post-acid pretreatment and for buffer preparation. |
| Methane Standard Gas | For calibration of gas chromatography. |
Procedure:
- Pretreatment: Perform enzymatic (50°C, pH 5.0, 48h) and dilute acid (170°C, 30 min) pretreatment on 50g (dry weight) of biomass separately.
- Setup: Add 2g (VS) of pretreated substrate to 500 mL serum bottles.
- Inoculation: Add 200 mL of fresh anaerobic inoculum (VS ratio substrate:inoculum = 1:2).
- Controls: Set up bottles with untreated substrate (negative control) and cellulose (positive control).
- Anaerobiosis: Flush headspace with N2/CO2 (70:30) for 2 min, seal with butyl rubber stoppers.
- Incubation: Place bottles in a mesophilic incubator (37±1°C) on a shaker (100 rpm).
- Monitoring: Measure biogas production periodically via pressure transducer or syringe. Analyze biogas composition (CH4, CO2) via gas chromatography weekly.
- Termination: Continue until daily methane production is <1% of cumulative total.
- Calculation: Calculate net methane yield (NmL CH4/g VS added) by subtracting control yield.
Protocol 2: Process Energy Consumption Measurement
Purpose: To empirically measure the direct energy input for laboratory-scale pretreatment.
Procedure:
- Instrumentation: Connect the pretreatment reactor (e.g., Parr reactor for conventional, jacketed bioreactor for enzymatic) to a calibrated kWh meter.
- Enzymatic Run: Load reactor with biomass, buffer, and enzymes. Set temperature (50°C) and agitation. Record kWh reading at start and end of 48h reaction.
- Conventional Run: Load reactor with biomass and acid solution. Heat to target temperature (e.g., 170°C), maintain for residence time (e.g., 30 min), then cool. Record kWh for the entire heating, hold, and cooling cycle.
- Calculation: Convert kWh to MJ (1 kWh = 3.6 MJ). Normalize energy consumption per kg of dry biomass processed.
Visualizations
Diagram Title: LCA System Boundaries for Pretreatment
Diagram Title: Carbon Footprint Calculation Workflow
Within the framework of enzymatic pretreatment of lignocellulosic biomass for enhanced biomethane research, validation at pilot and commercial scale is critical for bridging lab-scale innovation to industrial application. This application note reviews recent success stories, synthesizing quantitative performance data and detailing reproducible experimental protocols to guide researchers and process engineers.
The following table summarizes key performance metrics from recent pilot and commercial-scale validation studies employing enzymatic pretreatment for biomethane production.
Table 1: Performance Data from Recent Validation Studies
| Project / Location | Scale | Biomass Feedstock | Key Enzyme(s) Used | Pretreatment Conditions | Methane Yield Increase vs. Untreated Control | Reference Year |
|---|---|---|---|---|---|---|
| BioRefine (Denmark) | Pilot (10 ton/day) | Wheat straw | Cellulase & Xylanase cocktail | 50°C, pH 5.0, 24h, 5% TS | +42% | 2023 |
| AgriWaste Valorization (EU Horizon) | Demo (100 ton/day) | Corn stover & manure | Laccase (mediator-assisted) | 40°C, pH 6.5, 48h, 12% TS | +38% | 2024 |
| GreenGas Inc. (USA) | Commercial | Agricultural residues mix | Custom hemicellulase blend | 55°C, pH 5.5, 36h, 8% TS | +51% | 2023 |
| Waste-to-Energy Plant (Germany) | Commercial (co-digestion) | Organic fraction of MSW | Pectinase & cellulase | 45°C, pH 5.8, 30h, 10% TS | +29% | 2022 |
Detailed Experimental Protocols
Protocol 1: Pilot-Scale Enzymatic Pretreatment for Continuous Anaerobic Digestion
This protocol is adapted from the BioRefine (Denmark) pilot study for wheat straw.
1. Objective: To enzymatically pretreat lignocellulosic biomass in a continuous feed system to enhance biodegradability and subsequent methane yield in a mesophilic anaerobic digester.
2. Materials & Reagents:
- Biomass: Milled wheat straw (<10 mm particle size).
- Enzyme Cocktail: Commercial cellulase (e.g., Cellic CTec3) and xylanase blend. Activity: ≥ 100 FPU/g cellulase, ≥ 5000 U/g xylanase.
- Buffer: 0.1 M Sodium citrate buffer, pH 5.0.
- Pilot System: Horizontal stirred tank reactor (10 m³ working volume) with temperature control and continuous feeding auger.
3. Procedure: 1. Biomass Preparation: Load 500 kg (dry weight) of milled wheat straw into the pretreatment reactor. Adjust total solids (TS) to 15% w/w with process water. 2. pH & Temperature Adjustment: Add citrate buffer to achieve pH 5.0 ± 0.1. Heat mixture to 50°C with continuous stirring (20 rpm). 3. Enzyme Dosing: Add enzyme cocktail at a dosage of 20 mg enzyme protein per g of volatile solids (VS) of biomass. 4. Hydrolysis: Maintain conditions at 50°C, pH 5.0, with continuous gentle mixing for 24 hours. 5. Transfer to Digester: After hydrolysis, dilute the pretreated slurry to 8% TS using recirculated digestate. Continuously feed into the primary anaerobic digester at a rate of 2 m³/hour. 6. Control: Run in parallel a stream of untreated wheat straw (mechanically milled only) fed into a comparable digester. 7. Monitoring: Monitor biogas production volume, composition (CH₄, CO₂), and digestate characteristics (VS reduction) for a minimum of 3 hydraulic retention times (HRTs).
Protocol 2: Laccase-Mediator Pretreatment for Recalcitrant Biomass
This protocol is based on the EU Horizon demo-scale study for lignin-rich streams.
1. Objective: To utilize a laccase-mediator system (LMS) for partial delignification of corn stover, thereby enhancing enzymatic saccharification and methane potential.
2. Materials & Reagents:
- Biomass: Corn stover, milled and washed.
- Enzyme: Recombinant fungal laccase (e.g., from Trametes versicolor), activity ≥ 500 U/mL.
- Mediator: 1-Hydroxybenzotriazole (HBT).
- Reactor: Batch stirred-tank reactor (5 m³) with aeration capability.
3. Procedure: 1. Slurry Preparation: Load 600 kg (dry weight) of corn stover into the reactor. Adjust to 12% TS with water. 2. Reaction Setup: Adjust pH to 6.5 with NaOH. Add HBT mediator to a final concentration of 2 mM relative to the liquid phase. 3. Enzyme Addition: Dose laccase at 10 U per g of biomass dry matter. 4. Oxidative Pretreatment: Incubate at 40°C for 48 hours with low-pressure aeration (0.1 vvm) and intermittent mixing (15 min/hour at 30 rpm). 5. Termination & Assessment: Stop aeration. The pretreated slurry can be directly used for biomethane potential (BMP) assays or further processed. Analyze samples for lignin content reduction (Klason method) and biochemical methane potential (BMP) in triplicate.
Visualization of Key Processes
Diagram 1: Enzymatic Pretreatment for Biomethane Workflow
Diagram 2: Enzyme-Substrate Action Pathway
The Scientist's Toolkit: Key Research Reagent Solutions
Table 2: Essential Reagents and Materials for Enzymatic Pretreatment Research
| Item | Function / Role | Example / Specification |
|---|---|---|
| Cellulase/Xylanase Cocktail | Hydrolyzes cellulose and hemicellulose polymers into fermentable sugars. | Commercial blends like Cellic CTec3, Novozymes; Activity: ≥ 100 FPU/mL cellulase. |
| Laccase (with Mediators) | Oxidizes and fragments lignin, reducing its inhibitory barrier. | Recombinant fungal laccase (e.g., from Trametes sp.); Mediators: HBT, ABTS. |
| Biomethane Potential (BMP) Assay Kit | Standardized test to determine theoretical methane yield of substrates. | Systems with serum bottles, anaerobic inoculum, gas-tight syringes, CH₄/CO₂ analyzers. |
| Lignin Analysis Kit | Quantifies lignin content before/after pretreatment (Klason or spectrophotometric). | Kits including 72% H₂SO₄, reflux apparatus, or acetyl bromide method reagents. |
| Enzyme Activity Assay Kits | Measures specific activity of enzyme preparations (FPU for cellulase, U/mL for laccase). | Filter paper assay kits; ABTS oxidation kits for laccase. |
| Anaerobic Digester Inoculum | Active microbial consortium for biogas production. | Sourced from operational mesophilic (35-37°C) wastewater or agricultural digesters. |
| pH & Temperature Controllers | Maintains optimal conditions during enzymatic hydrolysis. | Bioreactor-compatible probes and controllers (e.g., pH 4.8-5.5 for cellulases). |
Lessons Learned and Critical Success Factors
- Enzyme Cost & Recovery: Success at scale requires enzyme recycling strategies or the use of on-site enzyme production to improve economics.
- Mixing Efficiency: Achieving homogeneous enzyme-substrate contact in high-solids slurries (>10% TS) is energy-intensive; optimized low-shear mixing is crucial.
- Integration: Pretreatment must be seamlessly integrated with downstream solid-liquid separation and anaerobic digestion to avoid inhibitors.
- Feedstock Flexibility: Robust enzyme cocktails capable of handling mixed or variable feedstocks (e.g., MSW) are key for commercial viability.
- Validation Metrics: Beyond methane yield, monitoring VS reduction, digestate dewaterability, and overall energy balance is essential for true process validation.
Conclusion
Enzymatic pretreatment stands as a highly specific and sustainable pathway to unlock the energy potential of lignocellulosic biomass, directly addressing the recalcitrance bottleneck in anaerobic digestion. This analysis synthesizes that while foundational science robustly supports enzyme mechanisms, successful application hinges on tailored, feedstock-specific methodologies. Optimization must relentlessly focus on cost reduction and inhibitor management to achieve economic viability. Validation data confirms that enzymatic methods often provide superior environmental profiles and digestate quality compared to harsh conventional pretreatments, though they may require strategic combination with mild physical methods for certain feedstocks. Future directions for researchers include the development of robust, thermostable enzyme cocktails via bioengineering, advanced process control using real-time monitoring, and integrated biorefinery models that valorize all biomass streams. The translation of these advances promises to significantly enhance the role of biomethane as a renewable energy vector, contributing to both waste management and decarbonization goals.