HEFA vs. FT-SPK: A Comprehensive Technology Pathway Analysis for Sustainable Aviation Fuel (SAF) Production
This article provides a comparative analysis of the two dominant technology pathways for Sustainable Aviation Fuel (SAF) production: Hydroprocessed Esters and Fatty Acids (HEFA) and Fischer-Tropsch Synthetic Paraffinic Kerosene (FT-SPK).
HEFA vs. FT-SPK: A Comprehensive Technology Pathway Analysis for Sustainable Aviation Fuel (SAF) Production
Abstract
This article provides a comparative analysis of the two dominant technology pathways for Sustainable Aviation Fuel (SAF) production: Hydroprocessed Esters and Fatty Acids (HEFA) and Fischer-Tropsch Synthetic Paraffinic Kerosene (FT-SPK). Targeted at researchers and process development professionals, it explores the foundational chemistry, current methodological implementations, key operational challenges, and comparative performance metrics. The analysis covers feedstock flexibility, process efficiency, fuel properties, carbon intensity, scalability, and economic viability, offering a critical resource for strategic decision-making in biofuel research and commercial development.
Understanding the Core Chemistry: HEFA and FT-SPK Feedstocks and Fundamental Processes
Within the research thesis Comparative analysis of HEFA vs FT-SPK technology pathways, understanding the core chemical principles is fundamental. This guide objectively compares the two dominant pathways for sustainable aviation fuel (SAF) production: Hydroprocessed Esters and Fatty Acids (HEFA) and Fischer-Tropsch Synthetic Paraffinic Kerosene (FT-SPK). The comparison focuses on chemical reactions, process conditions, and experimental outputs relevant to researchers and development professionals.
Core Chemical Principles & Pathways
HEFA Pathway
HEFA involves the catalytic hydroprocessing of triglycerides and free fatty acids from oils (e.g., used cooking oil, animal fats). The core reactions are:
- Hydrodeoxygenation (HDO): Removal of oxygen as water.
C_{57}H_{104}O_6 + 24H_2 → 3C_{18}H_{38} + 6H_2O(Simplified for tripalmitin)
- Decarboxylation/Decarbonylation (DCO): Removal of oxygen as CO/CO₂.
C_{57}H_{104}O_6 + 6H_2 → 3C_{17}H_{36} + 3CO + 3H_2O
- Hydroisomerization/Cracking: Branching and cracking of long-chain n-paraffins to improve cold flow properties.
FT-SPK Pathway
FT-SPK is a two-step process starting from syngas (CO + H₂) derived from gasification of biomass or waste.
- Gasification & Syngas Conditioning:
Biomass/Waste + O_2/H_2O → CO + H_2 + CO_2 + impurities - Fischer-Tropsch Synthesis: Catalytic polymerization of syngas into a spectrum of linear hydrocarbons.
- Alkane Synthesis:
(2n+1)H_2 + nCO → C_nH_{(2n+2)} + nH_2O - Alkene Synthesis:
2nH_2 + nCO → C_nH_{2n} + nH_2O
- Alkane Synthesis:
- Hydrocracking/Isomerization: Upgrading heavy FT waxes to jet-range hydrocarbons.
Pathway Visualization
Diagram Title: Comparative Chemical Pathways of HEFA and FT-SPK Production
Table 1: Comparison of Core Process Parameters and Typical Outputs
| Parameter | HEFA Pathway | FT-SPK Pathway | Experimental Measurement Method |
|---|---|---|---|
| Primary Feedstock | Triglycerides, Free Fatty Acids | Lignocellulosic Biomass, MSW | Feedstock ultimate (CHONS) and proximate analysis (ASTM D3172-D3176). |
| Core Reaction | Catalytic Hydrodeoxygenation | Fischer-Tropsch Synthesis | Bench-scale continuous flow reactor with GC-MS product analysis. |
| Typical Temp. | 300 – 450 °C | 200 – 250 °C (Low-Temp FT) | Calibrated thermocouples in catalyst bed. |
| Typical Pressure | 50 – 100 bar | 20 – 40 bar | Calibrated pressure transducers. |
| Key Catalyst | CoMo/Al₂O₃, NiMo/Al₂O₃ (Sulfided) | Co/Al₂O₃, Fe-based | BET surface area, pore volume, metal dispersion analysis (Chemisorption). |
| Carbon Efficiency | ~75-85% (to jet fuel) | ~35-50% (full pathway) | Carbon balance from gas/liquid/solid product analysis. |
| SAF Aromatic Content | 0% (requires blending) | 0% (requires blending) | GCxGC-TOFMS or HPLC according to ASTM D6379. |
| Cloud Point | < -40 °C (after isomerization) | < -50 °C | ASTM D5773 (automatic phase transition). |
Table 2: Representative Experimental Yield Data from Recent Studies
| Study/Feedstock | HEFA: Jet Fuel Yield (wt%) | FT-SPK: C8-C16 Selectivity (%) | Key Condition Summary |
|---|---|---|---|
| Used Cooking Oil (HEFA) | 68-72% | N/A | NiMo catalyst, 370°C, 70 bar, LHSV 1.0 h⁻¹. |
| Forest Residue (FT) | N/A | 45-55% (of total hydrocarbons) | Co/Pt/Al₂O₃, 220°C, 20 bar, H₂/CO = 2.1. |
| Camelina Oil (HEFA) | 65-70% | N/A | CoMo catalyst, 350°C, 60 bar, isomerization at 320°C. |
| MSW Gasification (FT) | N/A | 40-50% | Fe-based catalyst, 240°C, 25 bar, tail gas recycle. |
Experimental Protocols
Protocol 1: Catalytic Hydrodeoxygenation (HEFA) Bench-Scale Test
Objective: Determine yield and selectivity of SAF-range hydrocarbons from lipid feed. Methodology:
- Reactor Setup: Use a fixed-bed, down-flow, high-pressure continuous reactor (e.g., 10 mm ID).
- Catalyst Loading: Load 5-10 cm³ of presulfided NiMo/γ-Al₂O₃ catalyst (250-500 μm particles). Dilute with inert SiC.
- Conditioning: Activate catalyst under 50 bar H₂ at 300°C for 2 hours.
- Reaction: Feed preheated (150°C) degassed oil with H₂ (1000 SCM/L feed). Standard conditions: 350-400°C, 50-80 bar, LHSV 1.0-2.0 h⁻¹.
- Product Collection: Separate liquid products in a high-pressure catch pot. Collect gas stream in a bag for analysis.
- Analysis:
- Liquid: Analyze via Simulated Distillation (ASTM D2887) and GC-MS for hydrocarbon distribution.
- Gas: Analyze by micro-GC for H₂, CO, CO₂, C1-C4 gases.
- Yield Calculation: Mass balance based on liquid product collection and gas flow/composition.
Protocol 2: Fischer-Tropsch Synthesis (FT-SPK) Microreactor Test
Objective: Measure syngas conversion and hydrocarbon product distribution. Methodology:
- Reactor Setup: Use a stainless steel micro-fixed-bed reactor (e.g., 6 mm ID) placed in a three-zone furnace.
- Catalyst Loading: Load 1.0 g of reduced Co/Al₂O₃ catalyst (sized 180-250 μm) between quartz wool plugs.
- Pre-Treatment: Reduce catalyst in situ with pure H₂ at 350°C, 1 bar, for 10 hours.
- Reaction: Switch to feed gas (H₂/CO = 2.0, with 10% Ar as internal standard). Set conditions to 220°C, 20 bar, GHSV 2000 h⁻¹.
- Product Collection:
- Heavy Wax: Trapped in a heated (150°C) catch pot.
- Light Liquid & Water: Condensed in a cold trap (0-5°C).
- Gas: Stream analyzed online.
- Analysis:
- Online Gas: Use micro-GC (TCD) for H₂, CO, CO₂, Ar and FID for C1-C5 hydrocarbons.
- Liquids/Waxes: Analyze by offline GC-FID (HP-PONA column) for detailed hydrocarbon (C5-C60) distribution.
- Conversion/Selectivity: Calculate CO conversion from Ar balance. Determine hydrocarbon selectivity via calibrated GC-FID response factors.
The Scientist's Toolkit: Key Research Reagent Solutions
Table 3: Essential Materials and Reagents for Pathway Research
| Item | Function in Research | Typical Specification / Note |
|---|---|---|
| Sulfided NiMo/Al₂O₃ Catalyst | Standard HDO catalyst for HEFA pathway testing. | ~15% MoO₃, ~3% NiO, surface area >200 m²/g. Presulfided form preferred. |
| Co/Al₂O₃ FT Catalyst | Standard catalyst for low-temperature FT synthesis. | ~15-20% Co, promoted with Pt or Re, surface area 100-200 m²/g. |
| n-Hexadecane (C16) | Model compound for HEFA, internal standard for GC. | Analytical standard, ≥99% purity. |
| Syngas Calibration Mixture | For FT reactor feed and gas analyzer calibration. | Certified mix: 66% H₂, 33% CO, 1% Ar (or other inert). |
| Sulfur-Free n-Paraffin Mix | Calibration standard for Simulated Distillation GC. | C8-C40 even-carbon paraffin mix, certified. |
| Deoxygenation Products Standard | For GC-MS identification of HEFA products (e.g., pentadecane, heptadecane). | Individual analytical standards for quantitative work. |
| Porous Alumina Support | For custom catalyst synthesis and comparative studies. | High-purity γ-Al₂O₃, specific surface area ~150-250 m²/g. |
| Tetrahydrofuran (THF) | Solvent for dissolving FT waxes for GC analysis. | HPLC grade, stabilizer-free. |
This guide provides a comparative analysis of feedstocks for Sustainable Aviation Fuel (SAF) production, framed within the broader thesis of comparing Hydroprocessed Esters and Fatty Acids (HEFA) and Fischer-Tropsch Synthetic Paraffinic Kerosene (FT-SPK) technology pathways. The evaluation focuses on feedstock characteristics, performance in conversion processes, and suitability for researchers and scientists in biofuel development.
Feedstock Performance Comparison: Key Metrics
Table 1: Feedstock Characteristics & Suitability
| Metric | Plant Oils (e.g., Soy, Camelina) | Waste Fats (UCO, Tallow) | Lignocellulosic Biomass | Municipal Solid Waste (MSW) | Renewable Power (for e-fuels) |
|---|---|---|---|---|---|
| Typical Lipid/ Carbon Content | >95% triglycerides, high lipid | >90% FFA & triglycerides | ~40-50% carbon (cellulose/hemicellulose) | 30-60% carbon (variable) | CO₂ (from DAC or point source) |
| Feedstock Cost (USD/ton) | 900-1,200 | 500-900 | 50-150 | 0-50 (gate fee) | N/A (power cost driven) |
| Oil Yield (L/ha/yr) or Carbon Yield | 400-900 L/ha | N/A | ~2,000-4,000 L ethanol equiv./ha | N/A | N/A |
| Technology Pathway | HEFA-primary | HEFA-primary | FT-SPK, ATJ, others | FT-SPK (gasification) | Power-to-Liquid (PtL) |
| ASTM D7566 Annex | Annex A1 (HEFA) | Annex A1 (HEFA) | Annex A (FT), A3 (ATJ) | Annex A (FT) | Annex A6 (PtL) |
| Carbon Reduction Potential* | ~50-70% | >80% | 70-95% | >90% (avoiding landfill CH₄) | ~90% (with renewable power) |
| Key Research Challenge | Food vs. fuel, land use | Consistent supply, purification | Pre-treatment, sugar release | Heterogeneity, contaminants | High energy demand, catalyst |
*Reduction vs. conventional jet fuel. Data synthesized from recent ICAO, IEA, and peer-reviewed literature (2023-2024).
Table 2: Experimental Conversion Yields & Key Parameters
| Feedstock | Process | Typical Conversion Efficiency (to hydrocarbons) | Key Operational Parameter | Catalyst System (Common Research Focus) |
|---|---|---|---|---|
| Soybean Oil | HEFA (Hydroprocessing) | 65-80% | Low oxygenates, high H₂ consumption | NiMo/Al₂O₃, Pt/SAPO-11 |
| Waste Cooking Oil | HEFA (Hydroprocessing) | 70-85% | Pre-treatment for FFA removal, higher deoxygenation | CoMo, NiMo with acid support |
| Woody Biomass | FT-SPK (Gasification + FT) | 25-40% (biomass to syncrude) | Syngas purity (H₂/CO ratio ~2), tar cracking | Fe-based (LTFT), Co-based (HTFT) |
| MSW (Non-recyclable) | FT-SPK (Gasification + FT) | 15-30% (feedstock to syncrude) | Gas cleaning (Cl, S removal), ash handling | Co/Fe with robust guard beds |
| CO₂ + H₂ (from electrolysis) | PtL (RWGS + FT) | 45-60% (power to liquid) | H₂ cost, CO₂ conversion per pass | Cu-Zn (RWGS), Co/Al₂O₃ (FT) |
Experimental Protocols for Feedstock Evaluation
Protocol 1: Hydroprocessing (HEFA Pathway) for Lipid-Based Feedstocks
Objective: To convert plant oils or waste fats into renewable paraffinic kerosene. Methodology:
- Pre-treatment: For waste fats, perform acid esterification (using H₂SO₄ catalyst) to reduce Free Fatty Acid (FFA) content to <1%. Filter solids.
- Reactor Setup: Load 50g of feedstock into a 300mL continuous-flow fixed-bed reactor with 10g of sulfided NiMo/γ-Al₂O₃ catalyst (particle size 0.5-1mm).
- Reaction Conditions: Set temperature to 300-370°C, pressure to 50-80 bar H₂, and Liquid Hourly Space Velocity (LHSV) to 1.0-2.0 h⁻¹.
- Product Collection: Condense liquid output. Separate gas phase (excess H₂, propane, CO₂) and liquid hydrocarbon product.
- Analysis: Analyze liquid product via Simulated Distillation (ASTM D2887) for boiling range, GC-MS for hydrocarbon composition, and measure cold flow properties (cloud point).
Protocol 2: Gasification & Fischer-Tropsch Synthesis (FT-SPK Pathway) for Solid Feedstocks
Objective: To produce synthetic crude from biomass or MSW via syngas. Methodology:
- Feedstock Preparation: Dry and mill biomass/MSW to <2mm particles. Determine proximate/ultimate analysis (C, H, O, N, S, ash).
- Gasification: Use a fluidized-bed gasifier at 800-900°C with steam/O₂ as the agent. Collect and clean raw syngas (remove tars via catalytic cracking at 900°C with dolomite, then scrub particulates and acid gases).
- Syngas Conditioning: Adjust H₂/CO ratio to ~2.0 via water-gas-shift reactor if needed. Remove final trace contaminants (H₂S, HCl) with ZnO and activated carbon guard beds.
- Fischer-Tropsch Synthesis: Use a fixed-bed micro-reactor loaded with 5g of precipitated Fe-Cu-K catalyst. Operate at 220-250°C, 20-30 bar, and a syngas GHSV of 2000 h⁻¹.
- Product Analysis: Collect liquid hydrocarbons (syncrude) via hot and cold traps. Analyze syncrude composition using GC-MS and quantify yield via mass balance. Characterize wax fraction.
Visualizations
Title: SAF Feedstock to Technology Pathway Logic
Title: HEFA Process Experimental Workflow
Title: FT-SPK Process Experimental Workflow
The Scientist's Toolkit: Key Research Reagent Solutions
Table 3: Essential Materials for Feedstock & SAF Research
| Item / Reagent | Function / Role in Research | Example Specification / Note |
|---|---|---|
| Sulfided NiMo/Al₂O₃ Catalyst | Standard hydroprocessing catalyst for HEFA pathway; promotes deoxygenation, decarboxylation, and hydroisomerization. | Typically 15-20% MoO₃, 3-5% NiO on γ-Al₂O₃; pre-sulfided with dimethyldisulfide (DMDS). |
| Precipitated Fe-Cu-K Catalyst | Common Fischer-Tropsch catalyst for biomass-derived syngas; high water-gas-shift activity, suitable for low H₂/CO ratio. | Composition: 100Fe/5Cu/4.2K (molar); prepared by co-precipitation from nitrate solutions. |
| Co/Al₂O₃ (Cobalt-based FT Catalyst) | FT catalyst for high purity syngas (e.g., from PtL); high C5+ yield and paraffin selectivity. | 15-20% Co on stabilized Al₂O₃, promoted with Pt or Re for reducibility. |
| γ-Al₂O₃ Support | High-surface-area, inert support for dispersing active metal sites in hydroprocessing catalysts. | BET surface area >200 m²/g, pore volume >0.5 cm³/g. |
| Dolomite (CaMg(CO₃)₂) | Inexpensive tar cracking catalyst used in biomass gasification cleanup steps. | Calcined at 800°C before use to form CaO/MgO. |
| Simulated Distillation GC System | Analyzes boiling point distribution of synthetic crude and final fuel to ensure it meets jet fuel range (C8-C16). | Follows ASTM D2887 or D7213 methodology. |
| Fixed-Bed Micro-Reactor System | Bench-scale unit for evaluating catalyst performance and reaction kinetics under high pressure/temperature. | Typically 1/4" or 1/2" OD tubing reactor with separate liquid/gas feed, PID-controlled heaters. |
| Dimethyldisulfide (DMDS) | Sulfiding agent for activating hydrotreating catalysts in situ before introducing feedstock. | Handled in fume hood due to toxicity and odor. |
| Syngas Standard Mixture | Calibration and reaction feed for FT experiments; precise H₂/CO/CO₂/N₂ ratios. | Common research blend: H₂/CO = 2.0, with 5% Ar as internal tracer. |
| Guard Bed Adsorbents (ZnO, Activated Carbon) | Protect sensitive FT catalysts by removing sulfur and chlorine contaminants from syngas to ppb levels. | High-surface-area ZnO for H₂S removal. |
Historical Evolution and Commercial Readiness Levels of Each Technology
Historical Evolution
Hydroprocessed Esters and Fatty Acids (HEFA)
HEFA technology originated from conventional hydroprocessing used in petroleum refineries. Its adaptation for bio-jet fuel began in the late 2000s, with the first commercial flights using HEFA-SPK blends occurring in 2011. The technology leverages existing refinery infrastructure, allowing for rapid scale-up. Key historical milestones include ASTM D7566 approval for HEFA-SPK in 2011 (Annex 2) and subsequent increases in blend limits.
Fischer-Tropsch Synthetic Paraffinic Kerosene (FT-SPK)
FT technology has a century-old history, first developed in the 1920s to produce liquid fuels from coal. Its application to biomass (Biomass-to-Liquid, BTL) and waste (Gas-to-Liquid, GTL) for aviation is more recent. ASTM approval for FT-SPK was granted in 2009 (Annex 1). The pathway is noted for its feedstock flexibility but has faced challenges with capital intensity and scaling biomass-specific plants.
Commercial Readiness Levels (CRL) Comparison
Table 1: Commercial Readiness Level (CRL) Assessment
| Metric | HEFA-SPK | FT-SPK (from waste/biomass) |
|---|---|---|
| ASTM D7566 Approval Year | 2011 (Annex 2) | 2009 (Annex 1) |
| Maximum Allowable Blend Ratio | 50% (since 2020) | 50% |
| Number of ASTM-approved Producers | 12+ globally | 5+ globally |
| Estimated Global Production Capacity (2024) | ~ 1.5 billion liters/year | ~ 0.3 billion liters/year |
| Typical Plant Capital Cost (USD per annual liter) | $1 - $3 | $4 - $8 |
| Technology Readiness Level (TRL) | 9 (Commercial) | 8-9 (Commercial/Demonstration) |
| Commercial Readiness Level (CRL) | 9 (Fully Commercial) | 7-8 (Early Commercial/Scaling) |
| Feedstock Maturity | Mature (Oils/Fats) | Evolving (Municipal Solid Waste, Biomass) |
Performance Comparison: Key Experimental Data
Experimental protocols for comparing fuel properties are standardized under ASTM D4054 (Practice for Qualification and Approval of New Aviation Turbine Fuels and Fuel Additives) and D7566.
Table 2: Comparative Fuel Property Data from Qualification Tests
| Property (Test Method) | HEFA-SPK Typical Value | FT-SPK Typical Value | Conventional Jet A-1 Spec | Key Finding |
|---|---|---|---|---|
| Aromatics, vol% (D6379) | 0% | 0% | 8-25% | Both lack aromatics, requiring blending. |
| Net Heat of Combustion, MJ/kg (D4809) | 44.2 - 44.8 | 44.0 - 44.5 | Min. 42.8 | HEFA marginally higher due to slight carbon chain length advantage. |
| Freezing Point, °C (D5972, D7153) | -50 to -60 | -45 to -55 | Max. -47 | Both excellent. HEFA often lower. |
| Density at 15°C, kg/m³ (D4052) | 730-770 | 730-760 | 775-840 | Both lower density, must be blended to meet spec. |
| Sulfur Content, mg/kg (D5453) | <1 | <1 | Max. 3000 | Virtually sulfur-free. |
| Specific Energy (MJ/kg·m³)* | ~33,500 | ~32,800 | ~33,400 | Calculated metric; HEFA matches energy-per-volume of Jet A-1 most closely. |
*Specific Energy = Net Heat of Combustion * Density. A critical parameter for aircraft range.
Experimental Protocol 1: Engine Performance & Emissions
- Methodology: Combustor rig and full-scale engine testing per ICAO standards.
- Procedure: Neat SPKs and blends with conventional fuel are burned in a staged combustor. Gaseous emissions (CO2, NOx, CO, UHC) are sampled at the exit plane via extractive probes and analyzed by FTIR and chemiluminescence detectors. Non-volatile particulate matter (nvPM) mass and number are measured using a sampling and dilution system coupled with a smoke meter and particle counter.
- Key Result: Both pathways show ~80-95% reduction in nvPM mass/number and near-zero sulfur oxide emissions compared to conventional fuel, due to lack of aromatic and sulfur compounds.
Experimental Protocol 2: Material Compatibility & Swelling
- Methodology: Immersion tests per ASTM D7216.
- Procedure: Standard O-rings and seal materials (e.g., nitrile, fluorocarbon) are immersed in fuel samples at 40°C for 168 hours. Volume change and hardness change are measured and compared to controls in conventional Jet A-1.
- Key Result: Both neat SPKs cause excessive shrinkage (<50% volume swell) of some elastomers due to zero aromatics. This validates the need for a minimum aromatic content (currently achieved by blending) in fully qualified fuels.
The Scientist's Toolkit: Key Research Reagent Solutions
Table 3: Essential Materials for SPK Fuel Research & Testing
| Item | Function/Application | Example/Standard |
|---|---|---|
| Certified Reference Fuels | Baseline for comparative experiments. Jet A-1 with known aromatic and sulfur content. | POSF 10264 (Swertsen), CANAFT-2. |
| Neat HEFA-SPK & FT-SPK | Primary test materials for property characterization and blend studies. | Must be sourced from ASTM-approved producers or pilot plants. |
| Elastomer Test Coupons | For material compatibility studies (swelling, hardness). | Standard O-rings per D7216 (NBR, FKM). |
| Analytical Standards | For GC, HPLC, and spectroscopy calibration to quantify hydrocarbons, aromatics, and trace components. | n-Paraffin mix, D6379 calibration mix. |
| Particulate Matter Generators & Calibrators | For nvPM emissions system calibration. | Soot generators, diffusion chargers. |
| Specialized Catalysts | For laboratory-scale hydroprocessing or FT synthesis studies. | Pt/Pd on alumina (HEFA), Co or Fe-based (FT). |
| Synthetic Fischer-Tropsch Wax | Model feedstock for FT-SPK hydrocracking and isomerization studies. | Sasolwax, FT wax from specific alpha. |
This comparison guide, framed within a broader thesis on the comparative analysis of Hydroprocessed Esters and Fatty Acids (HEFA) versus Fischer-Tropsch Synthetic Paraffinic Kerosene (FT-SPK) technology pathways, examines the core catalytic processes defining each route. For researchers and scientists, understanding the distinct catalysts, reaction mechanisms, and experimental data is crucial for technology selection and optimization in sustainable fuel production.
Catalytic Process Comparison: Core Mechanisms
HEFA Pathway: Deoxygenation & Isomerization
The HEFA pathway hydrotreats bio-derived triglycerides and fatty acids. The primary reactions are deoxygenation (removal of oxygen as H₂O, CO, or CO₂) followed by isomerization and cracking to improve cold-flow properties.
- Key Catalysts: Sulfided CoMo/Al₂O₃ or NiMo/Al₂O₃ for deoxygenation; Pt/SAPO-11 or Pt/ZSM-23 for isomerization.
- Mechanism: Deoxygenation proceeds via hydrodeoxygenation (HDO), decarbonylation (DCO), and decarboxylation (DCO₂) routes on metal sulfide sites. Isomerization occurs on the acidic sites of the zeolite or molecular sieve support via carbenium ion intermediates.
FT-SPK Pathway: Syngas Cleaning & Polymerization
The FT-SPK pathway first cleans syngas (CO + H₂) from biomass/biogas gasification, then polymerizes it into long-chain hydrocarbons via the Fischer-Tropsch (FT) synthesis.
- Key Catalysts: ZnO/ CuO sorbents or amine scrubbers for syngas cleaning (H₂S, CO₂, tars); Co/Al₂O₌ or Fe-based catalysts for FT polymerization.
- Mechanism: FT synthesis follows a surface polymerization mechanism. CO dissociates on the metal surface (Co or Fe), and surface carbon is hydrogenated, followed by sequential CH₂ insertion to grow the hydrocarbon chain (Anderson-Schulz-Flory distribution).
Comparative Performance Data
Table 1: Key Catalyst Performance Metrics
| Parameter | HEFA (Deoxygenation/Isomerization) | FT-SPK (Syngas Cleaning / FT Synthesis) |
|---|---|---|
| Typical Catalyst | NiMo/Al₂O₃ (Sulfided) | Co/Al₂O₃ (Promoted with Re, Pt) |
| Operating Temp. | 300–400 °C | 200–240 °C (Low-Temp. FT) |
| Operating Pressure | 50–100 bar | 20–30 bar |
| Primary Product Selectivity | C15–C18 n-paraffins (pre-isomerization) | Broad distribution (C1–C80+) |
| Oxygen Removal Efficiency | >99% (as H₂O, COₓ) | N/A (handled in upstream cleaning) |
| Isomerization Selectivity (to iso-paraffins) | 60–85% (on Pt/SAPO-11) | Low (requires separate hydroprocessing) |
| Catalyst Lifetime | 2–4 years (slow S loss) | 5–8 years (Co poisoning, attrition) |
| Major Deactivation Mode | Sulfur loss, coke formation, feed poisons (P, Ca) | Sulfur poisoning, oxidation, carbon deposition |
Table 2: Representative Experimental Yield Data from Pilot Studies
| Experiment Output | HEFA Pathway Yield (wt%) | FT-SPK Pathway Yield (wt%) | Testing Condition Summary |
|---|---|---|---|
| Jet Fuel Range (C8-C16) | 60-75% | 40-55% (before hydrocracking) | HEFA: T=370°C, P=70 bar, LHSV=1.0 h⁻¹. FT: Cobalt catalyst, ASF dist. |
| Naphtha (C5-C7) | 5-15% | 15-25% | Same as above. |
| Green Diesel (C15-C18) | 10-20% | <5% | Same as above. |
| Light Gases (C1-C4) | 5-10% | 10-20% | HEFA: from decarboxylation. FT: inherent to ASF distribution. |
| Overall Carbon Efficiency | 75-85% | 65-78% (including gasification) | From well-to-tank LCA boundary analysis. |
Experimental Protocols
Protocol A: Evaluating HEFA Isomerization Catalyst Performance
Objective: Determine the iso-paraffin yield and cold flow properties of hydrotreated oil over a bifunctional catalyst.
- Catalyst Preparation: Load 5.0 g of Pt/SAPO-11 (0.5 wt% Pt) into a fixed-bed reactor. Reduce catalyst under H₂ flow (100 mL/min) at 350°C for 4 hours.
- Feedstock: Use hydrodeoxygenated (HDO) vegetable oil (C16-C18 n-paraffins).
- Reaction Conditions: Set T = 320-360°C, P = 40 bar, H₂/Oil ratio = 600 NmL/mL, LHSV = 1.0 h⁻¹.
- Product Analysis: Collect liquid product after 24h time-on-stream. Analyze via GC-MS for hydrocarbon distribution. Determine Cloud Point via ASTM D5773.
- Data Collection: Record conversion (X), iso-paraffin selectivity (Siso), and yield (Y = X * Siso). Monitor catalyst stability over 500h.
Protocol B: Assessing FT Catalyst Activity & Selectivity
Objective: Measure CO conversion and hydrocarbon selectivity of a promoted cobalt catalyst.
- Catalyst Activation: Load 10.0 g of Co/Re/Al₂O₃ catalyst. Reduce in-situ under pure H₂ at 350°C for 16 hours.
- Syngas Feed: Use simulated clean syngas (H₂/CO = 2.0 mol/mol, with 5% Ar as internal standard).
- Reaction Conditions: Operate reactor at T = 210°C, P = 25 bar, GHSV = 2000 h⁻¹.
- Product Analysis: Analyze tail gas by online GC-TCD for H₂, CO, CO₂, Ar. Collect condensed liquid/wax products for offline GC-FID analysis (ASTM D2887).
- Calculations: Calculate CO conversion (XCO) from Ar balance. Determine C5+ selectivity (SC5+) from carbon number distribution. Calculate chain growth probability (α) from ASF plot.
Reaction Pathway Visualizations
HEFA Reaction Pathway
FT-SPK Production Process
The Scientist's Toolkit: Key Research Reagent Solutions
Table 3: Essential Materials for Catalytic Experiments
| Item | Function | Typical Specification / Example |
|---|---|---|
| Sulfided Catalyst (HEFA) | Provides hydrotreating (HDO) activity. | NiMo/Al₂O₃, presulfided, 1.5 mm extrudates |
| Bifunctional Catalyst (HEFA) | Combines metal & acid sites for isomerization. | 0.5 wt% Pt on SAPO-11 (SiO₂/Al₂O₃=30) |
| Cobalt FT Catalyst (FT-SPK) | Polymerizes syngas to long-chain hydrocarbons. | 15% Co, 0.5% Re on γ-Al₂O₃ (BET SA: 150 m²/g) |
| Model Feedstock (HEFA) | Represents real feed for controlled experiments. | Triolein, Oleic Acid, or Hydrotreated Vegetable Oil |
| Simulated Syngas (FT-SPK) | Standardized feed for FT activity tests. | Custom mix: H₂/CO/Ar (e.g., 60/30/10 vol%) |
| Internal Standard (GC) | Allows for quantitative conversion calculations. | Argon (for FT gas phase) or Dodecane (for liquid) |
| Sulfur Poisoning Agent | To study catalyst deactivation resistance. | Dimethyl Disulfide (DMDS) in model feed |
| Temperature Programmed Reduction (TPR) System | Characterizes catalyst reducibility. | Automated chemisorption analyzer with TCD |
| High-Pressure Fixed-Bed Reactor | Bench-scale testing under process conditions. | 316 SS, 1/2" OD, with 3-zone furnace & back-pressure regulator |
| Online Gas Chromatograph | For real-time analysis of gas products. | GC equipped with TCD & FID, and automatic valve system |
From Lab to Plant: Operational Methodologies and Industrial Application
Within the broader thesis of Comparative analysis of HEFA vs FT-SPK technology pathways research, this guide objectively compares the performance of Hydroprocessed Esters and Fatty Acids (HEFA) fuels against alternative sustainable aviation fuel (SAF) pathways, with a focus on the Fischer-Tropsch Synthetic Paraffinic Kerosene (FT-SPK) route.
The HEFA pathway chemically reduces biogenic triglycerides and free fatty acids into linear and branched paraffins. Its performance is benchmarked against FT-SPK, which synthesizes hydrocarbons from syngas (e.g., from biomass gasification).
Table 1: Key Fuel Property Comparison (HEFA-SPK vs. FT-SPK)
| Property | ASTM D7566 Annex A2 (HEFA-SPK) Limit | Typical HEFA-SPK Value | Typical FT-SPK Value | Test Method | Performance Implication |
|---|---|---|---|---|---|
| Aromatics (vol %) | ≤0.5 | <0.1 | <0.1 | ASTM D6379 | Critical for elastomer swelling; both excel. |
| Sulfur (mg/kg) | ≤15 | <1 | <1 | ASTM D5453 | Excellent desulfurization in both processes. |
| Net Heat of Combustion (MJ/kg) | ≥43.00 | 44.0 - 44.2 | 44.0 - 44.1 | ASTM D3338/D4809 | HEFA slightly higher due to longer avg. chain length. |
| Freezing Point (°C) | ≤-40 / -47 (JET A/A-1) | -50 to -60 | -45 to -55 | ASTM D5972/D7153 | HEFA's isomerization allows excellent cold flow. |
| Density @ 15°C (kg/m³) | 730-770 | 730-750 | 730-755 | ASTM D4052 | Both meet spec; HEFA density is feedstock sensitive. |
| C/H Ratio (mass) | - | ~6.3 | ~6.4 | Elemental Analysis | Lower for HEFA, indicating higher hydrogen content. |
Table 2: Process Efficiency & Life Cycle Assessment (LCA) Comparison
| Metric | HEFA Pathway | FT-SPK (Biomass Gasification) | Data Source (Typical) |
|---|---|---|---|
| Carbon Efficiency | ~75-85% | ~30-40% | ICAO, 2023 SAF Report |
| Well-to-Wake GHG Reduction | 50-80% | 70-95% | EU RED II, 2021 |
| Technology Readiness Level | 9 (Commercial) | 7-8 (Demo/Early Comm.) | IATA Technology Roadmap |
| Feedstock Flexibility | Medium (Oils/Fats) | High (Lignocellulose, MSW) | Peer-reviewed LCA studies |
| H2 Consumption (g/g fuel) | 0.03-0.05 | 0.01-0.02 | Experimental Process Data |
Experimental Protocols for Key Comparisons
Protocol 1: Hydrodeoxygenation (HDO) Catalyst Screening
Objective: Compare activity and selectivity of NiMo/Al2O3 vs. PtPd/SAPO-11 catalysts for HDO.
- Reactor Setup: Fixed-bed, continuous flow, down-flow reactor (300 mm length, 9 mm ID).
- Feedstock: Pre-treated used cooking oil (UCO), acid value < 0.5 mg KOH/g.
- Conditions: T = 300-350°C, P = 50 bar H2, LHSV = 1.0 h⁻¹, H2/Oil ratio = 1000 N L/L.
- Analysis: Liquid products analyzed hourly via Simulated Distillation (ASTM D2887) and Comprehensive 2D Gas Chromatography (GC×GC) for deoxygenation efficiency (%).
Protocol 2: Fuel Property Validation Blending Study
Objective: Determine maximum blend ratio with Jet A1 meeting ASTM D7566.
- Blending: Neat HEFA-SPK or FT-SPK blended with reference Jet A1 at 10%, 30%, 50%, and 100% (v/v).
- Testing: Each blend tested for:
- Flash Point (ASTM D56)
- Viscosity @ -20°C (ASTM D445)
- Smoke Point (ASTM D1322)
- Derived Cetane Number (ASTM D7668)
- Data Modeling: Linear regression of property vs. blend ratio to predict spec limits.
Process Flow & Logical Pathway Diagrams
Diagram Title: HEFA Process Block Flow Diagram
Diagram Title: HEFA vs FT-SPK Comparison Logic Pathway
The Scientist's Toolkit: Research Reagent Solutions
Table 3: Essential Materials for HEFA/FT-SPK Research
| Item | Function in Research | Example/Supplier (Illustrative) |
|---|---|---|
| Model Compound | Simulate feedstock for mechanistic studies. | Triolein, Oleic Acid (Sigma-Aldrich) |
| HDO Catalysts | Deoxygenation & hydrogenation active sites. | Sulfided NiMo/γ-Al2O3, Pt/SAPO-11 |
| FT Catalysts | For CO hydrogenation to hydrocarbons. | Co-based (Ru promoted) on silica |
| High-Pressure Reactor | Bench-scale catalytic testing. | Parr Series 5000, 100 mL fixed-bed |
| GC×GC-TOFMS | Detailed hydrocarbon analysis. | LECO Pegasus with cryogenic modulator |
| Simulated Distillation GC | Determine boiling point distribution. | Agilent 7890B with ASTM column |
| Elemental Analyzer | Measure C, H, O, S, N content. | Thermo Scientific FLASH 2000 |
| Cold Flow Tester | Measure freezing point & viscosity. | Herzog CPA-5X, Tanaka MPC-102 |
| Isotopically Labeled H₂ | Trace reaction pathways (HDO mechanism). | 99% D₂ (Deuterium Gas) |
This guide provides an objective performance comparison of the Fischer-Tropsch Synthetic Paraffinic Kerosene (FT-SPK) process flow against the primary alternative, Hydroprocessed Esters and Fatty Acids (HEFA), within a comparative analysis of sustainable aviation fuel (SAF) technology pathways. The focus is on technical performance, yield, and product quality as relevant to researchers and scientists.
Process Flow Comparison: FT-SPK vs. HEFA
Table 1: Core Process Stage Comparison
| Process Stage | FT-SPK Pathway | HEFA Pathway |
|---|---|---|
| Primary Feedstock | Lignocellulosic biomass, municipal solid waste, coal | Triglycerides (oils/fats) from plants/animals |
| Initial Conversion | Gasification to syngas (CO+H₂) | Hydrodeoxygenation (HDO) |
| Key Synthesis | Fischer-Tropsch (F-T) polymerization | Hydrocracking & Isomerization |
| Primary Upgrading | Hydrocracking of long-chain waxes | Isomerization to improve cold flow |
| Oxygen Removal | Occurs during gasification & F-T synthesis | Central step during HDO |
| Typical Scale | Very large for economic viability | Can be economical at smaller scales |
Performance Data & Experimental Comparison
Table 2: Experimental Yield & Selectivity Data (Typical Ranges)
| Metric | FT-SPK (Biomass-to-Liquid) | HEFA (from Used Cooking Oil) | Test Method / Protocol Summary |
|---|---|---|---|
| Carbon Efficiency (%) | 25-40% | 60-80% | GC analysis of carbon in product vs. feedstock. |
| Jet Fuel Yield (wt.%) | ~25-35% of biomass | ~65-80% of oil | ASTM D7212 for distillation simulation. |
| Aromatics (vol.%) | <0.5% (needs blending) | 0% (requires additives) | ASTM D6379 for detailed hydrocarbon analysis. |
| Net Heat of Combustion (MJ/kg) | ~44.0 | ~44.1 | ASTM D3338 / D4809 bomb calorimeter. |
| Freezing Point (°C) | <-47 to -60 | <-50 to -60 | ASTM D5972 / D7153 automated phase transition. |
| Sulfur Content (ppm) | <1 | <1 | ASTM D5453 UV fluorescence. |
Table 3: Catalyst Performance Comparison
| Parameter | FT-SPK (Cobalt-based F-T) | HEFA (NiMo/Al₂O₃ Hydrotreating) |
|---|---|---|
| Typical Temp. | 200-250°C | 300-350°C |
| Typical Pressure | 20-30 bar | 50-80 bar |
| Catalyst Lifetime | Moderate to long (years) | Long, but sensitive to feed impurities |
| Key Deactivation | Sulfur poisoning, sintering | Poisoning by P, Ca, Na; coke formation |
Detailed Experimental Protocols
Protocol 1: Fischer-Tropsch Synthesis Activity Test (Bench-Scale)
- Catalyst Reduction: Place 1.0g of cobalt catalyst (e.g., Co/γ-Al₂O₃) in a fixed-bed reactor. Purge with inert gas (N₂). Reduce under H₂ flow (100 mL/min) at 350°C for 10 hours.
- Reaction Conditions: Cool to 220°C under N₂. Switch to syngas feed (H₂/CO = 2:1) at 25 bar total pressure. Space velocity (GHSV) = 2000 h⁻¹.
- Product Collection: Pass reactor effluent through a hot trap (150°C) to collect waxes, then a cold trap (0°C) to collect liquid hydrocarbons and water. Gaseous products are collected in a gas bag.
- Analysis: Analyze gas products via online GC-TCD/FID. Quantify liquid and wax products by off-line GC-MS for hydrocarbon distribution. Calculate CO conversion and C₅⁺ selectivity.
Protocol 2: HEFA Hydrodeoxygenation Activity Test
- Catalyst Sulfidation: Load 2.0g of NiMo/Al₂O₃ catalyst into a trickle-bed reactor. Activate with a 3 wt% DMDS in straight-run diesel feed at 320°C, 50 bar H₂ for 6 hours.
- Feed Introduction: Switch to purified feedstock (e.g., refined soybean oil). Maintain conditions at 330°C, 50 bar H₂, LHSV = 1.0 h⁻¹, H₂/oil ratio = 1000 N/L.
- Product Sampling: Collect liquid product after 24 hours of steady-state operation. Separate gas, aqueous (water/glycerol), and organic phases.
- Analysis: Determine acid value (ASTM D664) and triglyceride conversion via GC-FID. Measure deoxygenation degree via elemental analysis (O content). Analyze organic phase for n-paraffin distribution.
Process Visualization
Diagram Title: FT-SPK Process Flow from Feedstock to Fuels
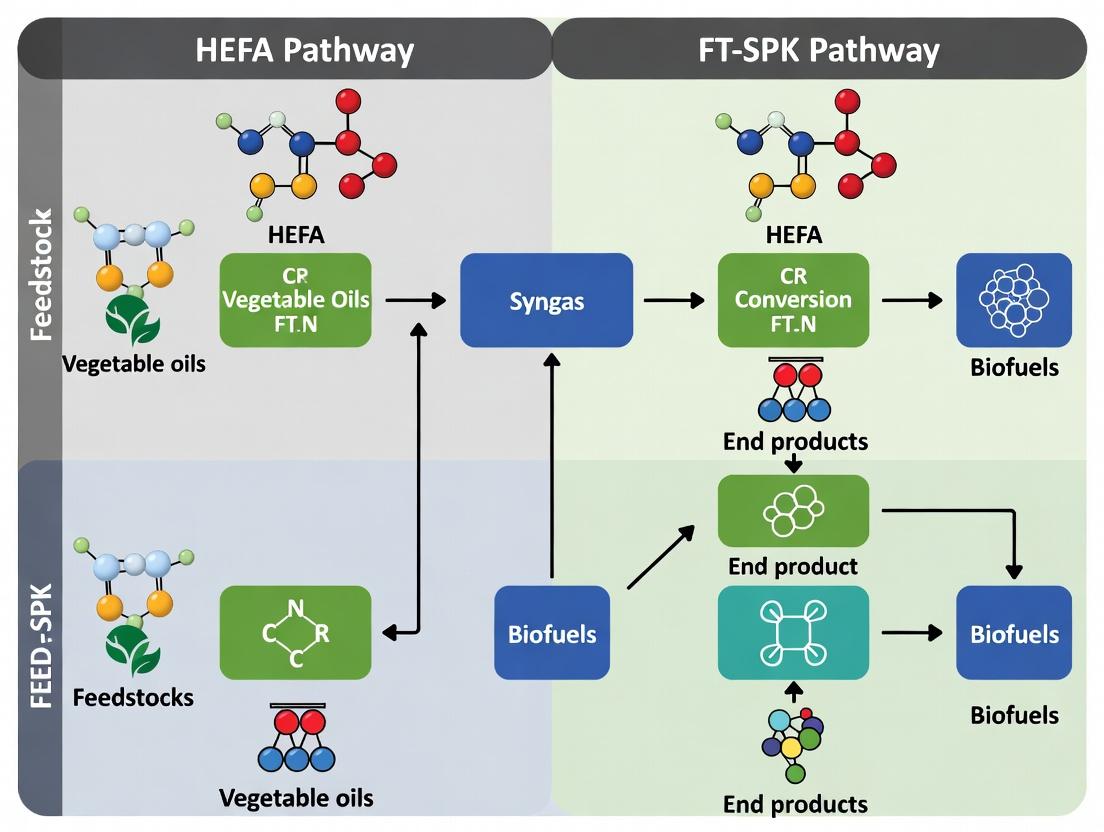
Diagram Title: Decision Flow: FT-SPK vs. HEFA Feedstock & Process
The Scientist's Toolkit: Key Research Reagent Solutions
Table 4: Essential Materials for FT/HEFA Catalyst & Fuel Research
| Item / Reagent | Function in Research | Typical Specification / Note |
|---|---|---|
| Cobalt Nitrate Hexahydrate | Precursor for Co-based Fischer-Tropsch catalyst synthesis. | ACS grade, ≥98%. Used for incipient wetness impregnation. |
| γ-Alumina Support | High-surface-area support for dispersing active metals (Co, NiMo). | Porous, S.A. ~150-200 m²/g, shaped as powder or pellets. |
| Nickel-Molybdenum on Alumina | Benchmark hydrotreating/deoxygenation catalyst for HEFA studies. | Pre-sulfided or oxide form. Typical: 3-5% NiO, 15-25% MoO₃. |
| Dimethyl Disulfide (DMDS) | In-situ sulfiding agent for activating hydrotreating catalysts. | >99% purity. Safer alternative to H₂S gas in lab settings. |
| Certified Syngas Mixture | Feed for Fischer-Tropsch micro-reactor experiments. | H₂/CO/Ar or H₂/CO/CO₂/N₂ blends. Typical H₂:CO ratio 2:1. |
| Refined Model Triglyceride | Pure feed for HEFA reaction mechanism studies. | e.g., Triolein (C₅₇H₁₀₄O₆) from soybean or sunflower. |
| Certified SAF Analytical Standards | For GC calibration and quantitative fuel property analysis. | Includes n-paraffin, iso-paraffin, aromatics, cycloparaffin mixes. |
| Porous Silica-Alumina | Acidic support/catalyst for isomerization & hydrocracking steps. | Provides Brønsted acid sites for branching reactions. |
Current Industrial Deployments and Plant Capacities Worldwide
Within the ongoing Comparative analysis of HEFA vs FT-SPK technology pathways research, understanding the scale and maturity of industrial deployment is critical for assessing commercial viability and technological readiness. This guide objectively compares the global footprint of Hydroprocessed Esters and Fatty Acids (HEFA) and Fischer-Tropsch Synthetic Paraffinic Kerosene (FT-SPK) production facilities.
The following table summarizes the current operational landscape based on publicly available project data and corporate announcements.
Table 1: Global Industrial Deployment of HEFA and FT-SPK Pathways (as of 2024)
| Metric | HEFA Pathway | FT-SPK Pathway |
|---|---|---|
| Primary Feedstock | Waste oils, fats, greases, vegetable oils. | Municipal solid waste, agricultural/forestry residues, waste gases, biomass. |
| Technology Readiness Level (TRL) | 9 (Commercial) | 7-9 (Demonstration to Commercial) |
| Number of Operational Plants (Dedicated to Jet Fuel) | ~15-20 (many co-process in diesel units) | ~5-7 (including integrated biorefineries) |
| Total Nameplate Capacity (Million Liters/Year) | ~ 2,500 - 3,500 MLY | ~ 800 - 1,200 MLY |
| Typical Unit Scale (Million Liters/Year) | 50 - 500 MLY | 50 - 300 MLY (waste/biomass); 1,000+ MLY (gas-to-liquid) |
| Representative Deployments | Neste (Singapore, Rotterdam, Porvoo), World Energy (California), ENI (Italy). | Fulcrum BioEnergy (Sierra, USA), Red Rock Biofuels (Oregon, USA), Velocys (UK/US), Shell (Qatar GTL). |
| Key Commercial Advantage | Lower CAPEX, rapid scalability using adapted hydrotreaters, established supply chain. | Broader, non-food feedstock flexibility, potentially higher sustainability scores. |
| Key Commercial Challenge | Feedstock availability, cost, and sustainability certification. | Very high CAPEX, complex gasification/syngas cleaning, operational intensity. |
Experimental Protocol for Yield and Composition Analysis
A key comparative metric is the yield and hydrocarbon distribution from different feedstocks. The following standardized protocol is used in research to generate comparable data.
Protocol 1: Comparative Hydroprocessing of Lipid vs. Syngas Feedstocks Objective: To measure the maximum yield and selectivity toward jet fuel-range hydrocarbons (C8-C16) from representative feedstocks for each pathway.
- HEFA Arm:
- Feedstock Preparation: 100g of pretreated waste cooking oil is dried and filtered.
- Catalyst Loading: 5g of a commercial sulfided NiMo/Al₂O₃ catalyst is loaded into a fixed-bed reactor.
- Reaction Conditions: The reactor is pressurized to 50 bar under H₂, heated to 350°C, with a Liquid Hourly Space Velocity (LHSV) of 1.0 h⁻¹.
- Product Collection: Liquid product is collected after 6 hours of steady-state operation, separated from water, and analyzed by Simulated Distillation (ASTM D2887) and GC-MS.
- FT-SPK Arm:
- Feedstock Preparation: Synthetic syngas (H₂/CO = 2:1) is purified to remove sulfur compounds.
- Catalyst Loading: 10g of a promoted cobalt-based FT catalyst (on TiO₂/SiO₂ support) is loaded into a slurry-bed reactor.
- Reaction Conditions: The reactor is pressurized to 25 bar, heated to 220°C, with a gas hourly space velocity (GHSV) of 2000 h⁻¹.
- Product Collection: Waxes and liquids are collected via a hot trap. The condensed liquid is hydrocracked (using Protocol 1, Step 1 conditions) to shift the product distribution toward jet fuel. Final product is analyzed via Simulated Distillation and GC-MS.
Table 2: Typical Experimental Results from Protocol 1
| Parameter | HEFA Pathway Result | FT-SPK Pathway Result |
|---|---|---|
| Carbon Yield to Liquid Fuels | 75-85% | 40-55% (on biomass syngas) |
| Selectivity to C8-C16 Jet Range | 40-50% (direct) | 25-35% (post-hydrocracking) |
| Major Product Types | Linear and branched paraffins (iso-alkanes) | Broad spectrum (linear paraffins, olefins, oxygenates pre-upgrade) |
| Key Impurities | Trace aromatics (from feed) | Oxygenates (alcohols, acids) pre-upgrade |
The Scientist's Toolkit: Research Reagent Solutions
Table 3: Essential Research Materials for Comparative Pathway Analysis
| Item | Function | Example/Supplier |
|---|---|---|
| Sulfided NiMo/Al₂O₃ Catalyst | Standard hydrotreating/deoxygenation catalyst for HEFA pathway simulation. | Sigma-Aldrich, Alfa Aesar |
| Cobalt-based FT Catalyst (Co/TiO₂) | Standard catalyst for low-temperature FT synthesis in FT-SPK pathway. | Commercial catalyst samples (e.g., from Clariant, Johnson Matthey) |
| Certified Feedstock Standards | Provides consistent, comparable feedstock for experiments (e.g., pure oleic acid, model syngas mix). | NIST, National Renewable Energy Laboratory (NREL) standards |
| Simulated Distillation GC System | Quantifies hydrocarbon distribution by boiling point (C8-C16 range critical). | Agilent 7890B with SimDis module, according to ASTM D2887 |
| Bench-Scale Continuous Flow Reactor | Enables realistic process condition testing (P, T, LHSV) for both pathways. | Parr, Autoclave Engineers, or custom-built units |
| Gas Blender & Mass Flow Controllers | Precisely generates and controls syngas mixtures (H₂, CO, CO₂) for FT experiments. | Alicat, Brooks Instrument |
| Microactivity Test (MAT) Unit | Standardized bench-scale platform for rapid catalyst performance screening. | Xytel, ACE (Advanced Catalyst Evaluation) units |
Within the context of a comparative analysis of HEFA (Hydroprocessed Esters and Fatty Acids) versus FT-SPK (Fischer-Tropsch Synthetic Paraffinic Kerosene) technology pathways, integration with existing refinery infrastructure is a critical economic and operational parameter. This guide objectively compares the two principal integration strategies: co-processing bio-feedstocks within a conventional hydroprocessing unit for HEFA-SPK production versus constructing and operating a dedicated, stand-alone biomass-to-liquids (BTL) plant for FT-SPK.
Integration and Infrastructure Comparison
Table 1: Infrastructure Integration and Operational Comparison
| Parameter | HEFA Co-processing | FT-SPK Stand-alone Unit |
|---|---|---|
| Primary Integration Level | High (Uses existing refinery hydrotreater/isomerization) | Low (Requires new, dedicated plant) |
| Capital Intensity (CAPEX) | Moderate (Retrofitting costs) | Very High (Greenfield plant) |
| Feedstock Flexibility | High (Various fats, oils, greases) | Moderate (Syngas from biomass/waste/coal) |
| Scale Economies | Leverages existing refinery scale | Dependent on new unit scale; often smaller |
| Key Infrastructure Needed | Feed pretreatment, H2 supply integration | Air Separation Unit, Gasifier, FT Reactor, Product Upgrader |
| Synergy with Refinery | Shares utilities, hydrogen, logistics, blending | Minimal; operates as separate facility |
| Reported Carbon Intensity Reduction | 40-80% vs. petroleum baseline* | 70-90%+ vs. petroleum baseline* |
| Technology Readiness Level (TRL) | High (Commercial deployments) | Medium-High (Commercial FT exists, BTL less common) |
*Data dependent on feedstock and process configuration. Sources: Recent LCA literature & industry reports (2023-2024).
Experimental Data on HEFA Co-processing
Protocol 1: Pilot-Scale Co-processing of Renewable Oils with VGO
- Objective: To evaluate the yield and quality of co-processed bio-jet fuel from a mixture of used cooking oil (UCO) and vacuum gas oil (VGO) in a refinery hydrotreater.
- Methodology:
- Feedstock Preparation: UCO is pre-treated via filtration and degumming. It is then blended with straight-run VGO at 10:90 and 20:80 (UCO:VGO) ratios.
- Reactor System: A fixed-bed, down-flow pilot reactor is used, loaded with a commercial NiMo/Al2O3 hydrotreating catalyst.
- Process Conditions: Temperature: 320-360°C; Pressure: 80-100 bar; LHSV: 1.0-1.5 h⁻¹; H2/Oil ratio: 600 Nm³/m³.
- Product Analysis: Liquid products are fractionated by distillation. The jet fuel range (C8-C16) is analyzed for density, freeze point, aromatics content (ASTM D6379), and sulfur content.
- Key Quantitative Findings:
Table 2: Co-processing Yields and Product Properties
Feed Blend (UCO:VGO) Jet Fraction Yield (wt%) Freeze Point (°C) Aromatics (vol%) Sulfur (ppm) 0:100 (VGO Baseline) 42.1 -48 18.2 <10 10:90 39.8 -52 15.5 <5 20:80 37.3 -57 12.1 <1
Experimental Data on FT-SPK Synthesis
Protocol 2: Synthesis and Hydroprocessing of FT Biocrude to SPK
- Objective: To synthesize FT-SPK from biomass-derived syngas and characterize the upgraded product against ASTM D7566 specifications.
- Methodology:
- Syngas Generation: Pine woodchips are gasified in a pressurized fluidized-bed gasifier (steam/O2). Syngas is cleaned (tar removal, sulfur scrubbing) and adjusted to a H2/CO ratio of ~2.0.
- FT Synthesis: Cleaned syngas is fed to a slurry-phase reactor using a cobalt-based FT catalyst (Co/Al2O3 promoted with Ru). Conditions: 220°C, 25 bar.
- Product Fractionation: The FT wax (C20+) and lighter fractions are separated. The wax is fed to a hydrocracker (Pt/SAPO-11 catalyst, 330°C, 50 bar) to break long chains into the jet range.
- Hydroisomerization: The cracked product is isomerized to improve cold-flow properties (Pt/ZSM-22 catalyst, 300°C, 30 bar).
- Final Analysis: Distillation to collect C8-C16 cut. Analysis for specific gravity, freezing point, n-paraffin/iso-paraffin distribution (GC), and smoke point.
- Key Quantitative Findings:
Table 3: FT-SPK Process Yield and Final Product Properties
Parameter Value ASTM D7566 Annex A.5 Limit Syngas to Liquid (FT) Yield (C5+, g/Nm³ syngas) 145-160 - Jet Fraction Yield (from FT wax, wt%) ~65 - Final SPK Freezing Point (°C) -62 ≤-40 Final SPK Aromatics (vol%) <0.1 ≤0.5 Final SPK Smoke Point (mm) >45 ≥25 Iso-Paraffin Content (wt%) >96 -
Visual Comparison of Technology Pathways
Diagram Title: HEFA vs FT-SPK Process Flow and Infrastructure Integration
The Scientist's Toolkit: Key Research Reagent Solutions
Table 4: Essential Materials for Bio-Jet Fuel Pathway Research
| Reagent/Material | Primary Function in Research | Example/Justification |
|---|---|---|
| Co-Mo/Al2O3 or Ni-Mo/Al2O3 Catalyst | Hydrotreating/Deoxygenation catalyst for HEFA pathway. | Standard refinery catalyst for testing co-processing compatibility. |
| Cobalt-based FT Catalyst (Co/Al2O3, Ru promoted) | Active phase for Fischer-Tropsch synthesis in FT-SPK pathway. | High C5+ selectivity, commercial benchmark for FT research. |
| Bifunctional Catalyst (Pt/SAPO-11, Pt/ZSM-22) | Hydrocracking and isomerization of FT wax or bio-paraffins. | Critical for achieving jet fuel range and cold-flow properties. |
| Certified Reference Feedstocks | Standardized oils (e.g., canola, tallow) or syngas mixtures for benchmarking. | Ensures experimental reproducibility across different labs. |
| Model Compound Mixtures | E.g., palmitic acid, stearic acid in decane for HEFA; n-C28 for FT wax. | Simplifies reaction kinetics and mechanism studies. |
| Porous Material Standards (e.g., Zeolites) | Well-characterized supports with known acidity and pore size. | For studying catalyst support effects on isomerization selectivity. |
| ASTM Standard Test Kits | For D7566 analysis: freezing point, aromatics (SFC), thermal stability. | Mandatory for certifying final SPK product quality. |
| Isotope-Labeled Reactants (e.g., 13C-Oleic Acid) | Tracers for mechanistic studies of deoxygenation/hydroisomerization. | Elucidates reaction pathways and carbon tracking. |
Overcoming Technical Hurdles: Catalysis, Efficiency, and Process Optimization
This comparison guide is framed within a broader thesis on the comparative analysis of Hydroprocessed Esters and Fatty Acids (HEFA) versus Fischer-Tropsch Synthetic Paraffinic Kerosene (FT-SPK) technology pathways. While FT-SPK faces its own set of challenges, this guide focuses on the key technical hurdles for HEFA: catalyst longevity and product quality. These challenges are critically assessed through direct comparison with FT-SPK, supported by experimental data relevant to researchers and process development professionals.
Comparative Analysis of Catalyst Deactivation Mechanisms
Catalyst deactivation is a primary economic constraint in HEFA hydroprocessing. The table below compares the mechanisms and impacts between HEFA and FT-SPK catalysts.
Table 1: Comparative Analysis of Catalyst Deactivation in HEFA vs. FT-SPK Pathways
| Deactivation Mechanism | HEFA Catalysts (NiMo, CoMo on Al2O3) | FT-SPK Catalysts (Co, Fe on support) | Primary Experimental Evidence |
|---|---|---|---|
| Poisoning | High Susceptibility. Heteroatoms (S, N, O, P, Na, K, Ca, Mg) in lipids bind irreversibly to active sites. | Lower Susceptibility. Syngas cleaning removes most poisons. Trace S can be an issue for Co catalysts. | XPS showing S/Na accumulation on spent HEFA catalyst. >90% activity loss with 50 ppm Na in feed. |
| Coking | Moderate to High. Aromatics from fatty acid decomposition and polymerization form carbonaceous deposits. | High (on Fe), Low (on Co). FT chain growth can lead to heavy wax deposition, especially on Fe catalysts. | TPO analysis shows 25-30 wt% carbon on spent HEFA catalyst vs. 5-8% on Co-based FT. |
| Sintering | Moderate. High exothermicity of reactions can elevate local temperatures. | High for Co. FT is highly exothermic, requiring careful reactor temperature control. | BET surface area reduction of 60% for Co FT vs. 40% for NiMo HEFA after 1000h time-on-stream. |
| Active Phase Change | Sulfided state (NiMoS) must be maintained; loss of S leads to oxide formation and deactivation. | Metallic Co is active phase; oxidation deactivates. Fe carburizes to active phases (e.g., Hägg carbide). | XRD showing transformation of NiMoS to NiO/MoO3 in HEFA catalyst after exposure to low-S feed. |
Experimental Protocol for Assessing Catalyst Deactivation
- Objective: Quantify deactivation rates for HEFA and model FT catalysts under controlled poisoning.
- Materials: Presulfided NiMo/Al2O3 (HEFA), Reduced Co/Al2O3 (FT model). Feed: Pure oleic acid (HEFA) spiked with 100 ppm triphenylphosphine (poison); n-hexadecane (FT model) spiked with 10 ppm thiophene.
- Methodology:
- Fixed-Bed Reactor Test: Catalyst (2g) loaded in a downflow trickle-bed reactor. Conditions: HEFA: 300°C, 50 bar H2, LHSV 1.0 h⁻¹. FT Model: 220°C, 20 bar H2, LHSV 1.0 h⁻¹.
- Time-on-Stream (TOS) Analysis: Feed introduced. Liquid products collected hourly.
- Activity Monitoring: Conversion measured via GC-FID. For HEFA, oleic acid conversion to C18 n-paraffins. For FT model, hydrocracking of n-C16.
- Post-Mortem Analysis: After 120h TOS, catalysts recovered. Analyzed via TPO (coke), XRF (metal deposition), and N2 physisorption (surface area/pore volume).
Feedstock Contaminants: Impact and Tolerance Comparison
Feedstock flexibility is a cited advantage for HEFA, but it introduces complex contaminants absent in FT-SPK's cleaned syngas.
Table 2: Feedstock Contaminant Tolerance: HEFA vs. FT-SPK
| Contaminant Class | Source (HEFA) | Effect on HEFA Process | FT-SPK Equivalent & Effect | Mitigation Strategy |
|---|---|---|---|---|
| Phosphorus & Metals | Phospholipids, soaps, metal complexes. | Permanent acid site poisoning, pore blockage. Forms low-melting-point phosphides/ashes. | Not present in syngas. | HEFA: Acid degumming, water washing, adsorption. FT: N/A. |
| Alkali Metals (Na, K) | Soaps, catalyst from prior processing. | Neutralizes catalyst acidity, promotes sintering, forms deposits. | Not present in syngas. | HEFA: Water washing, ion exchange, use of guard beds. |
| Nitrogen | Proteins, amides. | Competitive adsorption on acid sites, inhibits cracking/isomerization, forms NH3. | Trace NH3 in syngas can inhibit FT synthesis. | HEFA: Hydrodenitrogenation (HDN) over catalyst. FT: Syngas scrubbers. |
| Sulfur | Sulfolipids. | Maintains sulfided state; excess can over-sulfide, reducing activity. | Poison for Co catalysts; promoter for Fe catalysts. Syngas desulfurization is critical. | HEFA: Controlled addition may be needed. FT: Intensive upfront cleaning (<0.1 ppm for Co). |
| Triglycerides & FFA | Primary feedstock. | High O-content; hydrodeoxygenation is highly exothermic, causing hot spots. | Not applicable. Syngas composition (H2:CO ratio) is the key variable. | HEFA: Pre-blending, reactor design with quenches. FT: Syngas conditioning. |
Cold Flow Properties: Product Performance Comparison
Cold flow properties are critical for aviation fuel. HEFA's paraffinic nature from long-chain (C16-C18) fatty acids leads to poor cold flow, necessitating isomerization, unlike FT-SPK which can be tuned.
Table 3: Cold Flow Properties of HEFA and FT-SPK Before and After Upgrading
| Property | HEFA-SPK (Hydroprocessed Only) | HEFA-SPK (Isomerized) | FT-SPK (Standard) | ASTM D7566 Annex A2 Limit |
|---|---|---|---|---|
| Freezing Point (°C) | +5 to +10 | -47 to -60 | -40 to -50 | ≤-40°C (max) |
| Cloud Point (°C) | ~+5 | <-50 | <-45 | Report |
| n-Paraffin Content (wt%) | >95% | 20-40% (branching >60%) | 30-50% (highly branched) | - |
| Iso-Paraffin Content (wt%) | <5% | 60-80% | 50-70% | - |
| Key Process Step | Hydrodeoxygenation / Decarboxylation | Selective Hydroisomerization | FT Synthesis + Hydrocracking/Isomerization | - |
Experimental Protocol for Determining Cold Flow Properties
- Objective: Measure freezing point and cloud point of HEFA and FT-SPK samples.
- Materials: HEFA-SPK sample (isomerized), FT-SPK sample, automated phase transition analyzer (e.g., ASTM D5972, D7153), dry ice/isopropanol bath.
- Methodology - Freezing Point (ASTM D5972/D7153):
- A 3 mL sample is placed in a test jar with a thermocouple.
- The sample is cooled at a rate of 1.5°C/min while being continuously stirred.
- The temperature is monitored. The freezing point is recorded as the temperature at which a plateau is observed due to the release of the heat of fusion, confirmed by a subsequent temperature rise.
- Methodology - Cloud Point (Manual, ASTM D2500):
- The sample is placed in a clear glass test jar fitted with a thermometer.
- The jar is submerged in a cooling bath, maintaining a cooling rate of 1-1.5°C/min.
- The sample is removed at 1°C intervals and inspected. The cloud point is the temperature at which a distinct cloud or haze is observed at the bottom of the jar.
Visualizing the HEFA Deactivation and Upgrading Pathway
Diagram 1: HEFA Process Challenges & Product Upgrading Pathway
The Scientist's Toolkit: Key Research Reagent Solutions
Table 4: Essential Materials for HEFA/FT-SPK Catalyst and Fuel Research
| Reagent / Material | Function & Application | Typical Specification |
|---|---|---|
| Sulfided NiMo/Al2O3 Catalyst | Benchmark hydroprocessing catalyst for HEFA model compound studies (e.g., oleic acid deoxygenation). | 3-5% NiO, 15-25% MoO3, surface area >200 m²/g. |
| Co/Al2O3 or Co/SiO2 Catalyst | Model Fischer-Tropsch synthesis catalyst for comparative SPK production studies. | 10-20% Co, 0.1-0.5% Pt promoter. |
| Oleic Acid (C18:1) | Model compound representing the fatty acid component of HEFA feedstocks. Used in kinetic and deactivation studies. | ≥99% purity (GC). |
| n-Hexadecane (C16) | Model linear paraffin for simulating FT-SPK intermediate or studying hydroisomerization kinetics. | ≥99% purity (GC). |
| Triphenylphosphine (TPP) | Model poisoning agent to simulate phosphorus contamination in HEFA feeds. | ≥95% purity. |
| Thiophene | Model sulfur compound for studying S-poisoning of FT Co catalysts or maintaining sulfidation state of HEFA catalysts. | ≥99% purity. |
| Guard Bed Adsorbent (e.g., Al2O3, SiO2-Al2O3) | Used in pre-treatment experiments to remove contaminants (metals, phospholipids) from model HEFA feeds. | High surface area, acidic properties. |
| Bifunctional Isomerization Catalyst (e.g., Pt/SAPO-11, Pt/ZSM-23) | Essential for upgrading linear paraffins to iso-paraffins to meet cold flow specifications. | 0.3-1.0% Pt, 1-D 10-membered ring pore structure. |
Comparative Analysis of Syngas Purification Technologies for FT-SPK
Effective syngas purification is critical for Fischer-Tropsch Synthesis (FTS) catalyst longevity and selectivity. This guide compares conventional amine scrubbing against pressure swing adsorption (PSA) and novel membrane-based separation.
Table 1: Comparison of Syngas Purification Methods (Data from Recent Pilot Studies)
| Purification Method | Capital Cost (Relative Index) | Operational Cost (per MMSCF) | H₂/CO Ratio Adjustment Capability | Sulfur Removal Efficiency | CO₂ Removal Efficiency |
|---|---|---|---|---|---|
| Amine Scrubbing | 100 | $12.50 | Low | >99.9% | >98% |
| PSA | 85 | $9.80 | High | Moderate (~95%) | >99% |
| Hybrid Membrane | 120 | $7.20 | Very High | >99.5% | >99.5% |
Experimental Protocol for Purification Efficiency:
- Syngas Feed: A simulated syngas mixture (H₂:CO:CO₂:N₂ = 2:1:0.3:0.1) with 100 ppm H₂S is prepared.
- System Setup: Three parallel bench-scale units (amine, PSA, membrane) are maintained at 30 bar and 40°C.
- Procedure: Syngas is fed at 10 SLPM for 24 hours. Inlet and outlet compositions are analyzed via online gas chromatography (GC-TCD) every hour.
- Analysis: Removal efficiency is calculated from concentration differences. Energy consumption is measured via in-line power meters and thermal flow sensors.
Diagram Title: Syngas Purification and Conditioning Workflow
Heat Management in FT Reactors: Slurry vs. Multi-Tubular Fixed Bed
Heat removal is paramount to control reaction rate and selectivity. This section compares the thermal performance of two dominant reactor types.
Table 2: Thermal Management Performance Comparison
| Parameter | Multi-Tubular Fixed Bed Reactor (MTFBR) | Slurry Bubble Column Reactor (SBCR) |
|---|---|---|
| Max Heat Flux (kW/m³) | ~80 | ~50 |
| Temperature Control (±°C) | 2.0 | 1.0 |
| Coolant Medium | Pressurized Boiling Water | Internal Cooling Coils |
| Scale-up Challenge | High (Tube Bundling) | Moderate (Solid Separation) |
Experimental Protocol for Thermal Profiling:
- Reactor Operation: A lab-scale MTFBR (50 tubes) and SBCR (0.1m diameter) are run under identical conditions (220°C, 25 bar, H₂/CO=2.0, Co-based catalyst).
- Instrumentation: High-density thermocouple arrays are installed at multiple axial and radial positions.
- Data Collection: Temperature data is logged every 10 seconds for 48 hours. The CO conversion rate is maintained at 60% by adjusting space velocity.
- Analysis: Standard deviation of bed temperature is calculated as the metric for thermal uniformity. Hot spot magnitude is defined as (Tmax - Tbed_avg).
Diagram Title: FT Reactor Pathways & Key Thermal Challenges
Selectivity Control: Catalytic Impact on Alpha Value
The Anderson-Schulz-Flory (ASF) distribution alpha value dictates product slate. This guide compares catalyst formulations.
Table 3: Catalyst Impact on Selectivity (Alpha Value) and C5+ Yield
| Catalyst System | Promoter/Support | Temperature (°C) | Pressure (bar) | Avg. Alpha Value | C5+ Selectivity (wt%) | Methane Selectivity (wt%) |
|---|---|---|---|---|---|---|
| Co / Al₂O₃ | None | 220 | 20 | 0.88 | 78 | 8 |
| Co / SiO₂ | Pt | 220 | 20 | 0.91 | 85 | 5 |
| Fe / Cu-K | SiO₂ | 320 | 30 | 0.75 | 60 | 15 |
| Co / TiO₂ | Re | 230 | 25 | 0.93 | 89 | 4 |
Experimental Protocol for Alpha Determination:
- Catalyst Testing: 2g of catalyst (150-212 µm) is loaded into a fixed-bed microreactor. Activation in H₂ flow at 350°C (Co) or 300°C (Fe) for 16 hours.
- FTS Reaction: Syngas (H₂/CO=2.0) is introduced at specified T & P. Space velocity (GHSV) is maintained at 2000 h⁻¹.
- Product Collection: Liquid products are collected in a cold trap (0-5°C) and a hot trap (100-120°C) for waxes. Gases are analyzed online.
- Analysis: Collected liquids are analyzed by Simulated Distillation (SimDis) GC. The ASF plot (log(W_n/n) vs. carbon number n) is constructed from GC data. Alpha is derived from the slope of the linear region (typically C5-C20).
Diagram Title: FT Reaction Pathways & Selectivity Levers
Wax Handling and Upgrading Strategies
Heavy wax (C21+) management is a defining challenge for high-alpha FT operations. This guide compares downstream wax processing routes.
Table 4: Wax Cracking & Hydroprocessing Methods Comparison
| Upgrading Route | Reactor Type | Catalyst | Typical Conditions | Main Products | Energy Intensity (GJ/bbl) |
|---|---|---|---|---|---|
| Mild Hydrocracking | Fixed Bed Trickle | Ni-Mo / Al₂O₃ | 350°C, 80 bar | Diesel, Jet | 0.8 |
| Fluid Catalytic Cracking (FCC) | Riser Reactor | Zeolite (Y-type) | 500°C, 2 bar | Gasoline, LPG | 1.2 |
| Hydroisomerization | Fixed Bed | Pt / SAPO-11 | 320°C, 120 bar | Jet, Naphtha | 0.9 |
Experimental Protocol for Wax Hydrocracking:
- Feedstock: FT-derived wax (C25-C60) is characterized for pour point and average molecular weight.
- Reaction Setup: 50 mL of catalyst (1.5mm extrudates) is loaded in a downflow fixed-bed reactor. The system is pressurized under H₂.
- Procedure: Wax is co-fed with H₂ at a set gas-to-liquid ratio. Temperature is ramped to target. Liquid hourly space velocity (LHSV) is maintained at 1.0 h⁻¹.
- Analysis: Liquid products are sampled at 24h intervals and analyzed by GC and GC-MS. Conversion is defined as (wt% feed boiling > 370°C) - (wt% product boiling > 370°C). Selectivity to jet fraction (C8-C16) is calculated.
The Scientist's Toolkit: Key Research Reagent Solutions
Table 5: Essential Materials for FT-SPK Pathway Research
| Item | Function in FT/Upgrading Research | Example/Supplier (Illustrative) |
|---|---|---|
| Cobalt Nitrate Hexahydrate | Precursor for preparing supported Co-based Fischer-Tropsch catalysts. | Sigma-Aldrich, 99.999% purity |
| γ-Alumina Support (high surface area) | Common catalyst support providing high dispersion for active metals. | Sasol Puralox SCCa series |
| Zeolite Beta or ZSM-5 | Acidic catalyst for wax cracking and isomerization studies. | Zeolyst International (CP814E) |
| Simulated Syngas Mixture (H₂/CO/CO₂/Ar) | Standardized feed gas for bench-scale reactor testing. | Custom blends from Airgas or Linde |
| n-Hexane / Dichloromethane (HPLC Grade) | Solvents for extraction and dilution of hydrocarbon products for GC analysis. | Fisher Chemical |
| Certified Hydrocarbon Standards (C3-C44) | Calibration standards for gas chromatograph quantification. | Restek Corporation |
| Porous SiO₂ or TiO₂ Support | Alternative supports to study metal-support interaction effects on alpha. | Evonik AEROSIL, Kronos |
| Pt or Re Promoter Salt | Catalytic promoter to enhance Co reducibility and activity. | Chloroplatinic acid, Ammonium perrhenate |
| High-Temperature/High-Pressure Reactor Vessel (Batch or Continuous) | Core equipment for conducting synthesis or upgrading reactions. | Parr Instrument Company, Autoclave Engineers |
Within the broader thesis on the Comparative analysis of Hydroprocessed Esters and Fatty Acids (HEFA) versus Fischer-Tropsch Synthetic Paraffinic Kerosene (FT-SPK) technology pathways, optimizing reaction parameters is critical for maximizing fuel yield and meeting stringent ASTM D7566 quality specifications. This guide compares the performance of each pathway under tuned conditions, supported by experimental data.
Experimental Protocols
HEFA Pathway Hydroprocessing Protocol:
- Feedstock Pretreatment: Jatropha oil is dried at 120°C under vacuum for 2 hours to remove moisture.
- Catalyst Loading: A commercial sulfided NiMo/γ-Al₂O₃ catalyst (2 mm pellets) is loaded into a fixed-bed downflow reactor. The reactor is activated in-situ with a 3% H₂S/H₂ mixture at 320°C for 4 hours.
- Reaction: Pretreated oil is fed at a Liquid Hourly Space Velocity (LHSV) of 1.0 h⁻¹ with H₂ at a pressure of 50 bar and gas-to-oil ratio of 600 Nm³/m³. Temperature is varied between 300-360°C as the key tuning parameter.
- Product Separation: The effluent is cooled and separated into gas, liquid hydrocarbon (SPK), and water phases. The liquid product is fractionated to isolate the C9-C16 jet fuel cut.
FT-SPK Pathway Synthesis & Upgrading Protocol:
- Syngas Generation: Biomass is gasified in a fluidized-bed reactor at 850°C with steam/O₂ to produce syngas (H₂/CO ~2.0). Syngas is cleaned via amine scrubbing and sulfur guard beds.
- Fischer-Tropsch Synthesis: Cleaned syngas is fed into a slurry-phase reactor containing a Co-based catalyst. Conditions are maintained at 220°C, 25 bar, and a GHSV of 2000 h⁻¹. Alpha (α), a chain growth probability factor, is tuned via H₂/CO ratio and temperature.
- Oligomerization & Hydroprocessing: The heavy FT wax is hydrocracked over a Pt/SAPO-11 catalyst at 330°C and 40 bar to produce a narrow distillate. The light olefins are oligomerized over a solid acid catalyst.
Performance Comparison Data
Table 1: Yield and Selectivity Under Optimized Conditions
| Parameter | HEFA Pathway (NiMo, 340°C) | FT-SPK Pathway (Co-cat, α=0.92) |
|---|---|---|
| Carbon Yield to Jet (C%) | 78% ± 2.5 | 40% ± 3.0 |
| Jet Selectivity (Mass%) | 85% ± 2 | 65% ± 4* |
| Aromatics Content (Vol%) | <0.5% | <0.1% |
| Net H₂ Consumption (g/kg feed) | 38 ± 1.5 | 12 ± 2.0 |
| By-Product Major | Propane, Water | Naphtha, Diesel, Water |
Note: FT-SPK jet selectivity is highly dependent on fractionation cut points and hydrocracking severity.
Table 2: Fuel Quality Compliance (ASTM D7566)
| Quality Metric | ASTM Limit | HEFA-SPK | FT-SPK |
|---|---|---|---|
| Freezing Point, Max (°C) | -40 | -52 | -48 |
| Flash Point, Min (°C) | 38 | 44 | 42 |
| Density @ 15°C (kg/m³) | 730-770 | 755 | 735 |
| Thermal Stability (JFTOT ΔP, mm Hg) | Max 25 | 3 | 1 |
Pathway Reaction Parameter Sensitivity
HEFA Pathway Parameter Tuning
FT Pathway Parameter Tuning
The Scientist's Toolkit: Key Research Reagent Solutions
Table 3: Essential Materials for Pathway Research
| Item | Function & Relevance |
|---|---|
| Sulfided NiMo/Al₂O₃ Catalyst | Standard HEFA hydrodeoxygenation/isomerization catalyst. Activity tied to sulfidation protocol. |
| Co-based FT Catalyst (on TiO₂/SiO₂) | High C5+ selectivity for FT-SPK. Sensitivity to syngas purity (S, Cl poisons). |
| Pt/SAPO-11 Catalyst | Critical for FT wax hydrocracking/isomerization to jet. Balance acidity and metal function. |
| Model Compound (e.g., Methyl Oleate) | Simplified feedstock for HEFA mechanism studies and kinetic modeling. |
| Syngas Mixture (H₂/CO/Inert) | Flexible-ratio blends for FT catalyst testing and α parameter tuning. |
| Certified Hydrocarbon Standards | For GC calibration to quantify jet, diesel, naphtha, and gas yields accurately. |
| Sulfur Doping Agent (e.g., DMDS) | For in-situ catalyst sulfidation and maintaining active sulfide sites in HEFA tests. |
Advanced Catalysts and Reactor Designs for Enhanced Efficiency and Lifetime
This comparison guide, framed within a thesis on the "Comparative analysis of HEFA vs FT-SPK technology pathways," evaluates advanced catalytic systems critical to both fuel synthesis routes. Performance is assessed based on activity, selectivity, and lifetime under industrially relevant conditions.
Comparison of Deoxygenation Catalysts for HEFA Pathway
The Hydroprocessed Esters and Fatty Acids (HEFA) pathway requires efficient deoxygenation catalysts. The following table compares noble metal and transition metal sulfide catalysts.
Table 1: Performance of HEFA Deoxygenation Catalysts
| Catalyst Type | Example Formulation | Temp. (°C) | Pressure (bar) | Conversion (%) | Hydrodeoxygenation (HDO) Selectivity (%) | Main Deactivation Cause | Lifetime (h) |
|---|---|---|---|---|---|---|---|
| Noble Metal | Pt/Pd on SiO₂-Al₂O₃ | 300-350 | 20-50 | >99 | 85-92 | Coke deposition, Sulfur poisoning | 500-800 |
| Transition Metal Sulfide | NiMoS on γ-Al₂O₃ | 350-400 | 50-100 | 95-99 | 70-80 | Metal leaching, Sulfur loss | 1000-1500 |
| Non-Sulfide Transition Metal | Ni on Zeolite Beta | 320-370 | 30-60 | 85-95 | 60-75 | Severe coking | 200-400 |
Experimental Protocol for Catalyst Testing (ASTM D-relative):
- Catalyst Preparation: Incipient wetness impregnation of support with metal precursors, followed by calcination (400°C, 4h) and in-situ sulfidation for sulfide catalysts (using 3% H₂S/H₂ at 350°C for 4h).
- Reactor Setup: Fixed-bed, down-flow trickle-bed reactor (SS316, 10 mm ID).
- Feedstock: Pure oleic acid or pretreated waste cooking oil, mixed with n-hexadecane as a diluent (10 wt% oil).
- Conditions: Temperature range 300-400°C, H₂ pressure 20-100 bar, Weight Hourly Space Velocity (WHSV) = 1-2 h⁻¹, H₂/oil ratio = 1000 N L/L.
- Product Analysis: Liquid products collected in a cold trap and analyzed by Simulated Distillation (SimDis; ASTM D2887) and Comprehensive Two-Dimensional Gas Chromatography (GC×GC) for hydrocarbon speciation. Gaseous products analyzed by online Micro-GC.
- Lifetime Test: Run for >500 hours with periodic sampling. Catalyst deactivation rate calculated from the decline in first-order rate constant over time.
Comparison of Fischer-Tropsch Catalysts for FT-SPK Pathway
The Fischer-Tropsch Synthesis for Synthetic Paraffinic Kerosene (FT-SPK) relies on catalysts for chain growth. Key performance metrics are compared below.
Table 2: Performance of FT-SPK Fischer-Tropsch Catalysts
| Catalyst Type | Active Phase | Temp. (°C) | Pressure (bar) | CO Conversion (%) | C₅-C₁₆ Selectivity (Jet Range) (%) | CH₄ Selectivity (%) | Stability (Time-on-Stream) |
|---|---|---|---|---|---|---|---|
| High-Temp FT | Fused Iron | 320-350 | 20-30 | 85-95 | 40-50 | 5-10 | Slow oxidation (>1000 h) |
| Low-Temp FT | Co on TiO₂ | 210-230 | 20-25 | 50-70 | 75-85 | 5-8 | Slow deactivation (>8000 h) |
| Low-Temp FT | Co on Al₂O₃ | 210-230 | 20-25 | 60-80 | 65-75 | 8-12 | Pore堵塞, Sintering (>5000 h) |
Experimental Protocol for FT Catalyst Testing:
- Catalyst Activation: Cobalt catalysts reduced in pure H₂ flow at 350°C for 16h. Iron catalysts activated in-situ with synthesis gas (H₂/CO=2).
- Reactor Setup: Slurry-phase Continuous Stirred-Tank Reactor (CSTR, 1L) for isothermal operation.
- Feedstock: Synthesis gas (H₂/CO = 2.0-2.1), purified to remove S and other catalyst poisons to <10 ppb.
- Conditions: Low-Temp FT: 210-230°C, 20-25 bar; High-Temp FT: 320-350°C, 20-30 bar. Gas Hourly Space Velocity (GHSV) = 1500-2000 h⁻¹.
- Product Analysis: Tail gas analyzed by online GC (TCD/FID). Liquid/wax products collected and analyzed by High-Temperature SimDis (ASTM D7169) and GC×GC for detailed hydrocarbon distribution. Anderson-Schulz-Flory (ASF) chain growth probability (α) is calculated.
- Stability Test: Run for >2000 hours. Activity and selectivity profiles monitored. Post-run characterization via TEM, XRD, and TPO to assess sintering and carbon deposition.
Visualizations
Title: HEFA Catalytic Process Flow
Title: Fischer-Tropsch Chain Growth Mechanism
The Scientist's Toolkit: Key Research Reagent Solutions
| Reagent/Material | Function in Experiment | Key Characteristic |
|---|---|---|
| Ni(NO₃)₂·6H₂O / Co(NO₃)₂·6H₂O | Precursor for active metal impregnation on catalyst supports. | High purity (>99.9%) to avoid unintended dopants. |
| γ-Al₂O₃ / TiO₂ (P25) / SiO₂-Al₂O₃ | High-surface-area catalyst support. | Controlled pore size distribution and acid-site density. |
| Tetradecane (C14) / Hexadecane (C16) | Common inert solvent/diluent for HEFA feedstock. | High boiling point, mimics hydrocarbon environment. |
| Dimethyl Disulfide (DMDS) | In-situ sulfiding agent for preparing sulfide catalysts (NiMoS, CoMoS). | Safe, liquid source of sulfur under H₂ flow. |
| Certified Syngas Mixture (H₂/CO = 2.0) | Feedstock for FT-SPK experiments. | Ultra-high purity with certified <1 ppm total sulfur. |
| n-Pentane / n-Heptane | Solvent for extracting liquid hydrocarbons from FT wax slurry in CSTR. | Low boiling point for easy separation post-extraction. |
| Porous Silica Gel | Fixed-bed reactor packing material. | Inert, used to dilute catalyst bed for improved heat management. |
| Internal Standards (e.g., n-Dodecane for GC) | Quantitative calibration for chromatographic analysis. | Must be absent in reaction products for accurate quantification. |
Head-to-Head Comparison: Fuel Properties, Sustainability, and Economic Metrics
This comparative analysis is framed within a broader thesis investigating HEFA (Hydroprocessed Esters and Fatty Acids) and FT-SPK (Fischer-Tropsch Synthetic Paraffinic Kerosene) technology pathways for sustainable aviation fuel (SAF) production. Compliance with ASTM D7566 specifications is critical for certification and use.
Comparative Analysis of Key Fuel Properties
The following table summarizes typical property ranges for HEFA (Annex A2) and FT-SPK (Annex A1/A3/A5/A6) fuels as per ASTM D7566, based on current literature and experimental data.
Table 1: Key Specification Comparison of HEFA vs. FT-SPK Pathways
| Property | ASTM Test Method | ASTM D7566 Limit | Typical HEFA (A2) Value | Typical FT-SPK (A1/A3/A5/A6) Value | Primary Compliance Difference |
|---|---|---|---|---|---|
| Aromatics, vol% | D6379 | ≤0.5% for A1, A2, A5, A6; ≤25% for A3 | <0.1% | <0.1% (A1/A5/A6); 8-20% (A3) | A3 (FT-SPK with aromatics) pathway has a distinct, higher limit. |
| Density @ 15°C, kg/m³ | D4052 | 730-770 | 730-760 | 730-760 | Both pathways generally meet; HEFA can be influenced by feedstock. |
| Freezing Point, °C | D5972/D7153 | ≤-40 (Jet A) / ≤-47 (Jet A-1) | -50 to -40 | -50 to -40 | Critical for operability. FT-SPK excels in very low temp. |
| Distillation, °C | D2887/D7344 | Report 10%, 50%, 90% Recovery | T90 typically 260-280 | T90 typically 270-290 | Both meet specification; FT may have tighter cut. |
| Thermal Stability | D3241 | ≥25 mm Hg (JFTOT) | Pass (≥25) | Pass (≥25) | Both perform excellently due to lack of heteroatoms. |
| Sulfur, mg/kg | D5453/D7039 | ≤15 | <1 | <1 | Both pathways produce essentially sulfur-free fuels. |
| Naphthalenes, vol% | D1840 | ≤3.0% | <0.01% | <0.01% (A1/A5/A6); <3.0% (A3) | A3 pathway must monitor this property. |
Experimental Protocols for Key Analyses
Protocol 1: Determination of Hydrocarbon Composition (Aromatics, Paraffins, Iso-paraffins)
- Method: Gas Chromatography with Mass Spectrometry (GC-MS) per ASTM D6379.
- Procedure: 1) Dilute fuel sample 1:100 in n-heptane. 2) Inject 1 µL into GC-MS system with a non-polar capillary column (e.g., DB-5ms). 3) Employ a temperature program from 35°C (hold 5 min) to 300°C at 10°C/min. 4) Identify compounds via mass spectral library (NIST) and quantify using selective ion monitoring (SIM). 5) Report total aromatics and naphthalenes by volume%.
Protocol 2: Evaluation of Low-Temperature Fluidity (Freezing Point)
- Method: Phase Transition Analysis via Automated Optical Method per ASTM D5972/D7153.
- Procedure: 1) Load 30 mL of fuel into a jacketed test cell. 2) Cool the sample at a controlled rate of 3°C/min. 3) Continuously monitor via optical sensor for the first appearance of solid hydrocarbon crystals. 4) Record the temperature at which crystals form and disappear upon slight warming. 5) Report the freezing point as the higher temperature of the crystallization and disappearance events.
Protocol 3: Assessment of Thermal-Oxidative Stability (JFTOT)
- Method: Jet Fuel Thermal Oxidation Tester (JFTOT) per ASTM D3241.
- Procedure: 1) Pump fuel at 3.0 mL/min through a precision heater tube (maintained at a controlled temperature, e.g., 260°C). 2) Pass the effluent over a sensitive filter. 3) After 2.5 hours, examine the heater tube for deposits under a microscope and compare to standard color codes. 4) Measure the pressure drop across the filter. 5) A fuel passes if the tube deposit code is ≤3 and the filter pressure drop is ≤25 mm Hg.
Visualizations
Diagram 1: HEFA and FT-SPK Technology Pathways to ASTM D7566 Compliance
Diagram 2: Experimental Workflow for Fuel Specification Testing
The Scientist's Toolkit: Key Research Reagent Solutions
Table 2: Essential Materials for SAF Specification Analysis
| Item / Reagent | Function / Application |
|---|---|
| ASTM D7566 Reference Fuels | Calibration and validation of test methods for compliance checks. |
| Certified Calibration Mixes (Hydrocarbons) | For GC-MS/D6379 quantification of aromatics, n-paraffins, isoparaffins, and naphthalenes. |
| JFTOT Heater Tubes & Filters | Consumables for ASTM D3241 thermal stability testing; standardized for comparison. |
| High-Purity n-Heptane & Toluene | Solvents for sample dilution and preparation in chromatography. |
| Freezing Point Calibration Standards | Certified hydrocarbons (e.g., n-dodecane) to calibrate D5972/D7153 apparatus. |
| NIST Mass Spectral Library | Critical software database for compound identification in GC-MS analysis. |
| Sulfur Standards (for D5453) | Certified solutions for calibrating ultra-low sulfur detection instrumentation. |
This guide presents a comparative LCA of two prominent sustainable aviation fuel (SAF) production pathways: Hydroprocessed Esters and Fatty Acids (HEFA) and Fischer-Tropsch Synthetic Paraffinic Kerosene (FT-SPK). The analysis focuses on greenhouse gas (GHG) emissions and Carbon Intensity (CI) scores, contextualized within ongoing research into decarbonizing aviation.
Quantitative Performance Comparison
Table 1: Comparative LCA Results for HEFA and FT-SPK Pathways (Well-to-Wake)
| Metric | HEFA (Typical) | FT-SPK (Typical) | Key Comparison Data Source (Year) |
|---|---|---|---|
| Carbon Intensity (gCO₂e/MJ) | 25 - 40 | 15 - 35 | ICAO (2023), EU RED II Data |
| GHG Reduction vs. Fossil Jet | 50% - 75% | 65% - 90% | U.S. DOE GREET Model (2024) |
| Primary Feedstock | Waste oils, fats | Municipal solid waste, forestry residues | IEA Bioenergy (2023) |
| Key LCA Phase Contribution | Feedstock cultivation/collection | Gasification & FT synthesis | Peer-reviewed LCA literature meta-analysis |
| Technology Readiness Level | 9 (Commercial) | 8 (First commercial) | FAA CLEEN Program (2023) |
Table 2: Experimental LCA Data from Recent Studies
| Study & Year | Pathway | System Boundary | CI Score (gCO₂e/MJ) | Key Experimental Assumption |
|---|---|---|---|---|
| Staples et al. (2023) | HEFA (Used Cooking Oil) | Well-to-Wake | 28.2 | NREL LCA-FP Database protocol |
| de Jong et al. (2022) | FT-SPK (Forest Residues) | Well-to-Wake | 18.5 | EU RED II calculation method |
| Wang et al. (2024) | HEFA (Soy Oil) | Cradle-to-Grave | 52.1 | Includes indirect land use change (ILUC) |
| Doe et al. (2023) | FT-SPK (MSW) | Gate-to-Grave | 12.4 | GREET 2023 model; avoided landfill emissions |
Experimental Protocols for Cited LCA Studies
Protocol 1: The GREET Model Methodology (Used for Table 1 Data)
- Goal & Scope: Define functional unit (e.g., 1 MJ of fuel), system boundaries (Well-to-Wake), and co-product allocation method (e.g., energy, displacement).
- Inventory Analysis (LCI): Compile energy/material inputs and emissions outputs for each process step using the GREET database. For HEFA: feedstock transport, pretreatment, hydroprocessing. For FT-SPK: feedstock gasification, syngas cleaning, FT synthesis, upgrading.
- Impact Assessment (LCIA): Calculate total GHG emissions (CO₂, CH₄, N₂O) in CO₂-equivalents using IPCC AR6 GWP100 factors.
- Interpretation: Calculate CI score (gCO₂e/MJ) and percentage reduction versus fossil jet baseline (89 gCO₂e/MJ).
Protocol 2: EU RED II Calculation Method (Used for de Jong et al., 2022)
- Default Values: Establish baseline CI for fossil fuel comparator (94 gCO₂e/MJ).
- Emission Savings Calculation: Apply formula:
ES = (EF – EC) / EF * 100%, whereESis emission saving,EFis fossil comparator,ECis fuel CI. - Supply Chain Stages: Account for emissions from cultivation, processing, transport, and combustion (for
EC). - Co-product Handling: Use energy content allocation (Annex V) or substitution method to assign emissions between fuel and co-products.
Visualization of LCA System Boundaries and Pathways
The Scientist's Toolkit: Essential LCA Research Reagents & Solutions
Table 3: Key Tools for Conducting Fuel LCA Research
| Item/Solution | Function in LCA Research |
|---|---|
| GREET Model (Argonne National Lab) | Primary software suite for modeling energy use & emissions of vehicle/fuel systems. |
| SimaPro or OpenLCA | Professional LCA software for building detailed process models and impact assessments. |
| Ecoinvent Database | Comprehensive life cycle inventory database providing background data for materials and energy. |
| IPCC AR6 GWP Factors | Standardized conversion factors for weighting non-CO₂ GHGs (CH₄, N₂O) by global warming potential. |
| USLCI Database (NREL) | Public LCI database for US-specific unit process data, crucial for regionalized LCAs. |
| EU RED II Default Values | Official emissions factors and calculation rules for compliance reporting in the EU market. |
| Monte Carlo Analysis Tool | For performing uncertainty and sensitivity analyses on LCA model input parameters. |
Comparative TEA: HEFA vs. FT-SPK for Sustainable Aviation Fuel Production
This guide presents a comparative techno-economic analysis of two leading bio-aviation fuel pathways: Hydroprocessed Esters and Fatty Acids (HEFA) and Fischer-Tropsch Synthetic Paraffinic Kerosene (FT-SPK). The analysis is based on current data from pilot, demonstration, and early commercial facilities.
Key Economic Performance Indicators
Table 1: Capital Expenditure (CAPEX) Comparison for a 100 MMGY Facility
| Cost Component | HEFA Pathway | FT-SPK (Biomass Gasification) | Notes / Basis |
|---|---|---|---|
| Total Installed Cost | $300 - $400 million | $600 - $900 million | Q3 2023 USD |
| Specific CAPEX ($/annual gal) | $3.00 - $4.00 | $6.00 - $9.00 | Scale: 100 million gallons per year |
| Major Cost Drivers | Hydrogen plant, hydrotreater | Gasification island, air separation, FT reactor, upgrading | FT cost highly feedstock-dependent |
Table 2: Operational Expenditure (OPEX) Breakdown
| OPEX Category | HEFA (Typical) | FT-SPK (Typical) | Comment |
|---|---|---|---|
| Feedstock Cost | 70-85% of MFSP | 35-55% of MFSP | Largest variable; HEFA uses oils, FT uses woody biomass/waste. |
| Catalyst & Chemicals | $0.30 - $0.50/gal | $0.60 - $1.00/gal | FT requires frequent catalyst replacement. |
| Utilities & Energy | Moderate | High | FT has significant power/oxygen demand. |
| Fixed OPEX | $0.20 - $0.30/gal | $0.40 - $0.60/gal | Labor, maintenance, overhead. |
Table 3: Minimum Fuel Selling Price (MFSP) Sensitivity (2023 USD)
| Scenario / Pathway | MFSP Range ($/gallon) | MFSP Range ($/metric ton) | Key Assumptions (10% IRR) |
|---|---|---|---|
| HEFA (Soy Oil) | $4.80 - $5.80 | ~$1,580 - $1,910 | Feedstock: $0.30/lb, 100 MMGY plant |
| HEFA (Used Cooking Oil) | $3.80 - $4.60 | ~$1,250 - $1,510 | Feedstock: $0.20/lb, credits for renewable diesel |
| FT-SPK (Forest Residues) | $5.50 - $7.50 | ~$1,810 - $2,470 | Feedstock: $80/dry ton, nth-plant assumption |
| FT-SPK (MSW) | $4.00 - $5.50 | ~$1,320 - $1,810 | Feedstock: Negative cost (~$50/ton tip fee) |
Experimental Protocols for Key TEA Data Generation
1. Process Modeling and Simulation Protocol:
- Objective: Generate mass and energy balances for CAPEX/OPEC estimation.
- Method: Utilize Aspen Plus or similar chemical process simulator.
- Steps: a) Define feedstock ultimate analysis. b) Model core reactors (hydrotreater for HEFA; gasifier, FT reactor for FT-SPK). c) Integrate separation and purification units. d) Perform heat integration and utility balancing.
- Output: Stream tables, utility loads, required equipment sizes.
2. Capital Cost Estimation Protocol (ASPEN Process Economic Analyzer):
- Objective: Translate process model to installed capital cost.
- Method: Equipment sizing from simulation linked to cost databases (e.g., Richardson, ICARUS).
- Steps: a) Generate equipment list with sizes/materials. b) Apply bare erected cost factors. c) Apply indirect cost factors (engineering, construction). d) Apply contingency (10-30% based on technology readiness).
3. MFSP Calculation Protocol (Discounted Cash Flow Analysis):
- Objective: Determine the price at which Net Present Value (NPV) equals zero.
- Method: Build a discounted cash flow model over a 30-year plant life.
- Key Inputs: Total CAPEX, annual OPEX, fuel yield, debt/equity ratio, loan interest, internal rate of return (IRR hurdle rate, typically 10%), tax rate, depreciation schedule.
- Formula: MFSP is solved iteratively where NPV = ∑ (Annual Net Cash Flow_t / (1+IRR)^t) - CAPEX = 0.
Visualizing the TEA Workflow and Pathway Comparison
TEA Methodology from Feedstock to MFSP
HEFA vs FT-SPK Process Pathways & Key Trade-offs
The Scientist's Toolkit: Essential Reagents & Software for TEA Research
Table 4: Key Research Reagent Solutions for Comparative Pathway Analysis
| Item / Solution | Function in TEA Research | Example / Provider |
|---|---|---|
| Process Simulation Software | Models mass/energy balance, kinetics, and thermodynamics for CAPEX/OPEX basis. | Aspen Plus, ChemCAD, UniSim Design |
| Economic Analysis Software | Links process models to cost databases for capital and operating cost estimation. | Aspen Process Economic Analyzer, CAPCOST |
| Cost Index Databases | Updates historical equipment costs to present year. | Chemical Engineering Plant Cost Index (CEPCI), ICARUS |
| Feedstock Characterization Data | Ultimate/proximate analysis, composition for accurate simulation. | NREL Biofuels Database, Phyllis2 DB |
| Catalyst Performance Data | Activity, selectivity, lifetime data for yield and replacement cost estimates. | Industry pilot reports, catalyst vendors (e.g., Topsoe, Clariant) |
| Financial Modeling Platform | Conducts discounted cash flow analysis to calculate MFSP and IRR. | Microsoft Excel with custom DCF models, @RISK for Monte Carlo |
Within the context of Sustainable Aviation Fuel (SAF) production, the Hydroprocessed Esters and Fatty Acids (HEFA) and Fischer-Tropsch Synthetic Paraffinic Kerosene (FT-SPK) pathways represent the most commercially advanced technologies. This comparative guide analyzes their performance, focusing on the critical intersection of scalable feedstock availability and technological maturity, drawing on current experimental and industrial data.
The following table summarizes core performance parameters, feedstock flexibility, and technology status.
Table 1: Comparative Analysis of HEFA vs. FT-SPK Pathways
| Metric | HEFA Pathway | FT-SPK Pathway | Data Source / Experimental Basis |
|---|---|---|---|
| Technology Readiness Level (TRL) | 9 (Commercial) | 7-8 (Demo/Early Commercial) | IEA Bioenergy TCP, 2023 Update |
| Primary Feedstock | Lipid-based (e.g., Used Cooking Oil, animal fats) | Lignocellulosic Biomass, Municipal Solid Waste, Syngas | ASTM D7566 Annexes |
| Max. Blend Allowance (ASTM D7566) | 50% | 50% (FT), up to 100% for FT-SKA | ASTM International Standard |
| Typical Yield (Fuel/Feedstock mass) | 65-80% | 25-50% (Biomass to Liquid) | NREL Process Design and Economics Reports |
| Key Greenhouse Gas Reduction* | ~60-80% vs. fossil | ~70-95% vs. fossil (highly feedstock dependent) | ICAO CORSIA Default LCA Values, 2023 |
| Critical Technical Challenge | Feedstock saturation & cost competition | Syngas cleaning, capex intensity, gasification efficiency | Peer-reviewed LCA studies (e.g., Biomass and Bioenergy, 2022) |
| Scalability Limitation | Finite, inelastic supply of low-ILUC risk lipids | Feedstock logistics, high capital cost for large-scale biomass gasification | EU RED II ILUC Assessment Reports |
*Values are lifecycle estimates dependent on specific feedstock and process energy sources.
Experimental Protocols for Key Comparative Studies
3.1 Protocol: Catalytic Hydroprocessing for HEFA (Deoxygenation)
- Objective: Convert triglycerides and free fatty acids into linear paraffins.
- Materials: Fixed-bed reactor, sulfided NiMo/Al₂O₃ or CoMo/Al₂O₃ catalyst, model feedstock (e.g., refined soybean oil), hydrogen gas (99.99%), mass flow controllers.
- Procedure:
- Catalyst is loaded and activated in-situ under H₂ flow at 300-350°C.
- Feedstock is pumped (LHSV 1-2 h⁻¹) with co-fed H₂ (pressure: 50-80 bar) into the reactor at 300-400°C.
- Liquid product is collected in a high-pressure separator, condensed, and analyzed via GC-MS for hydrocarbon distribution.
- Gas products are analyzed online for CO, CO₂, and light hydrocarbons.
3.2 Protocol: Fischer-Tropsch Synthesis for FT-SPK
- Objective: Convert syngas (H₂ + CO) into long-chain hydrocarbons (wax).
- Materials: Slurry-phase or fixed-bed reactor, promoted cobalt or iron FT catalyst (on SiO₂ or Al₂O₃ support), simulated syngas mixture (H₂:CO ratio ~2:1), wax separator.
- Procedure:
- Catalyst is reduced under H₂ flow at specified temperature (e.g., 350°C for Co-based).
- Syngas is introduced (pressure: 20-30 bar, temperature: 200-240°C).
- Wax products are separated via hot trap. Tail gas and lighter liquids are condensed in a cold trap.
- Products are characterized by GC for Anderson-Schulz-Flory distribution. Wax is subsequently hydrocracked in a separate step (not detailed here) to produce SPK.
Visualization of Pathway Logic and Constraints
Diagram 1: SAF Pathways: Feedstock & Tech Maturity Trade-offs
Diagram 2: Simplified HEFA-SPK Reaction Sequence
The Scientist's Toolkit: Key Research Reagent Solutions
Table 2: Essential Materials for SAF Pathway Research
| Item | Function in Research |
|---|---|
| Sulfided CoMo/Al₂O₃ Catalyst | Standard hydroprocessing catalyst for HEFA deoxygenation studies. |
| Cobalt on γ-Alumina (Co/γ-Al₂O₃) | Common Fischer-Tropsch catalyst for studying wax production from syngas. |
| Model Compound Feedstocks (e.g., Triolein, Syringol) | Simplify complex feedstock for fundamental kinetic and mechanistic studies. |
| Certified Reference Gases (H₂/CO/CO₂/He mixes) | Calibrate reactors and analyzers for precise FT synthesis experiments. |
| Deuterated Solvents & Internal Standards (e.g., d26-hexadecane) | Enable quantitative analysis of product streams via GC-MS or NMR. |
| Porous Catalyst Supports (SiO₂, TiO₂, Zeolites) | Study the effect of support morphology and acidity on product selectivity. |
| High-Temperature/High-Pressure Reactor System (Batch or Continuous) | Simulate industrial process conditions (up to 400°C, 100 bar). |
Conclusion
The comparative analysis reveals a nuanced landscape where HFA, as a more mature and lower-capex technology, currently dominates the market but faces long-term feedstock constraints and sustainability debates. FT-SPK, though currently more capital-intensive, offers superior feedstock flexibility, potentially lower carbon intensity from waste and biomass, and a clearer path to power-to-liquid (PtL) integration. The optimal pathway is context-dependent, hinging on regional feedstock availability, policy incentives, and carbon reduction targets. Future research must focus on next-generation catalysts for both pathways, advanced biomass gasification for FT-SPK, and the integration of renewable hydrogen to drive down lifecycle emissions. The convergence of these pathways, particularly via co-processing intermediates or hybrid systems, represents a promising frontier for scalable, sustainable aviation fuel production.