Decoding Biomass Recalcitrance: A Comprehensive Guide to FTIR and XRD Analysis for Pretreated Lignocellulosic Structure
This article provides a detailed, technical guide for researchers and drug development professionals on employing Fourier-Transform Infrared (FTIR) spectroscopy and X-ray Diffraction (XRD) to analyze the structural transformations in biomass...
Decoding Biomass Recalcitrance: A Comprehensive Guide to FTIR and XRD Analysis for Pretreated Lignocellulosic Structure
Abstract
This article provides a detailed, technical guide for researchers and drug development professionals on employing Fourier-Transform Infrared (FTIR) spectroscopy and X-ray Diffraction (XRD) to analyze the structural transformations in biomass following pretreatment. The scope progresses from foundational principles, exploring how these techniques elucidate changes in lignin, cellulose, and hemicellulose, to methodological best practices for sample preparation, data acquisition, and interpretation. It further addresses common analytical challenges and optimization strategies for data quality, and concludes with a validation framework, comparing FTIR and XRD with complementary techniques like NMR and SEM. The synthesized insights are crucial for optimizing biomass processing in applications ranging from biofuel production to the development of novel biomaterials and excipients for pharmaceutical use.
Biomass Deconstruction Decoded: Foundational Principles of FTIR and XRD for Structural Analysis
Biomass recalcitrance is the natural resistance of plant cell walls to deconstruction into fermentable sugars, primarily due to the complex structural and chemical interactions between lignin, cellulose, and hemicellulose. Within research focused on FTIR and XRD analysis of pretreated biomass structures, understanding this recalcitrance is fundamental for evaluating pretreatment efficacy and guiding downstream processing for biofuel and biochemical production.
Comparative Analysis of Pretreatment Methods on Biomass Components
The following table summarizes quantitative data from recent studies comparing the impact of different pretreatment methods on the composition and crystallinity of lignocellulosic biomass, as measured by FTIR and XRD.
Table 1: Impact of Pretreatment Methods on Biomass Composition and Crystallinity
| Pretreatment Method | Lignin Removal (%) | Cellulose Crystallinity Index (CrI) Change | Hemicellulose Removal (%) | Key FTIR Spectral Shift Observations (cm⁻¹) | Reference |
|---|---|---|---|---|---|
| Dilute Acid (H₂SO₄, 160°C) | 15-25% | +8 to +12% | 85-95% | Decrease at 1730 (C=O in hemicellulose); Increase at 897 (β-glycosidic linkages) | Kumar et al., 2023 |
| Alkaline (NaOH, 120°C) | 60-80% | -5 to +2% | 40-60% | Decrease at 1510 & 1245 (aryl ring in lignin); Broadening at 897 | Lee et al., 2024 |
| Steam Explosion (200°C) | 10-20% | +5 to +10% | 70-85% | Decrease at 1730; Increase at 1429 (CH₂ in cellulose) | Jacquet et al., 2023 |
| Organosolv (Ethanol-Water, 180°C) | 70-90% | +10 to +15% | 75-90% | Significant decrease at 1510 & 1245; Sharp peak at 897 | Zhao et al., 2024 |
Detailed Experimental Protocols
Protocol 1: Standardized FTIR Analysis for Biomass Component Characterization
- Sample Preparation: Grind dried, pretreated biomass to a fine powder (<100 µm). Dry overnight at 60°C. Mix 1 mg of sample with 200 mg of spectroscopic-grade KBr. Press into a transparent pellet using a hydraulic press (10 tons for 2 minutes).
- Instrumentation: Use an FTIR spectrometer with a DTGS detector. Collect spectra in the mid-IR range (4000-400 cm⁻¹) at a resolution of 4 cm⁻¹. Accumulate 64 scans per sample.
- Data Processing: Subtract background spectrum. Apply baseline correction (e.g., concave rubber band correction). Normalize spectra to the peak at ~897 cm⁻¹ (associated with cellulose) for comparative analysis of lignin (1510 cm⁻¹) and hemicellulose (1730 cm⁻¹) relative absorbance.
Protocol 2: XRD Measurement for Cellulose Crystallinity Index (CrI)
- Sample Preparation: Pack ground biomass powder into a sample holder. Ensure a flat, uniform surface.
- Instrumentation: Perform analysis using an X-ray diffractometer with Cu Kα radiation (λ = 1.5406 Å). Operating conditions: 40 kV voltage, 40 mA current.
- Data Acquisition: Scan 2θ range from 5° to 40° with a step size of 0.02° and a scan speed of 2°/min.
- CrI Calculation: Calculate the Crystallinity Index using the Segal method: CrI (%) = [(I₀₀₂ - Iₐₘ) / I₀₀₂] × 100, where I₀₀₂ is the maximum intensity of the 002 lattice diffraction peak (~22.5°) and Iₐₘ is the intensity of the amorphous baseline at ~18°.
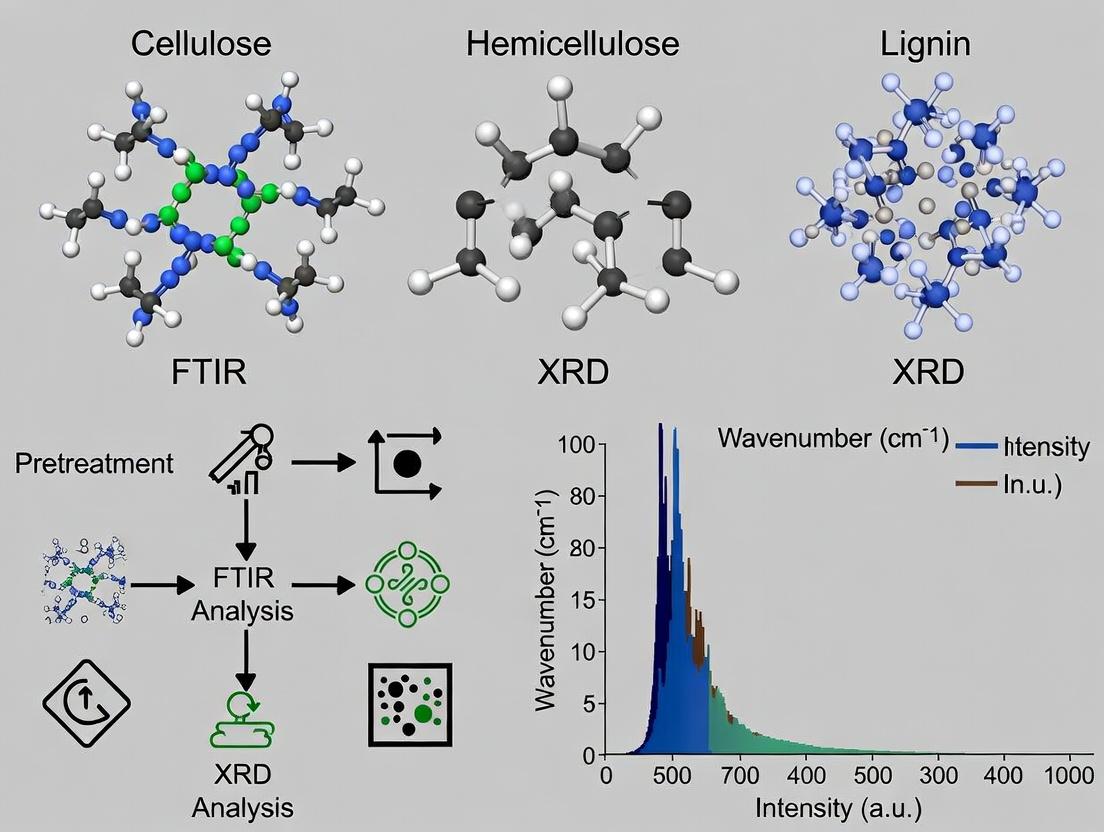
Visualizing Biomass Recalcitrance and Analysis Workflow
FTIR & XRD Workflow for Pretreated Biomass
The Scientist's Toolkit: Key Research Reagent Solutions
Table 2: Essential Reagents and Materials for Biomass Structural Analysis
| Item | Function in Research |
|---|---|
| Spectroscopic-grade Potassium Bromide (KBr) | Infrared-transparent matrix for preparing solid pellets for FTIR analysis. |
| Sulfuric Acid (H₂SO₄, ACS grade) | Common catalyst for dilute-acid pretreatments that target hemicellulose hydrolysis. |
| Sodium Hydroxide (NaOH, ACS grade) | Alkaline agent for pretreatments that solubilize lignin and alter cellulose crystallinity. |
| Anhydrous Ethanol (≥99.5%) | Solvent for organosolv pretreatments and for washing biomass post-pretreatment. |
| Deuterated Solvents (e.g., DMSO-d₆) | For NMR analysis, often complementary to FTIR/XRD, to study detailed molecular structure. |
| Microcrystalline Cellulose (Avicel) | Reference standard for cellulose in XRD and FTIR methods validation. |
| Alkali Lignin (Indulin AT) | Reference standard for lignin in quantitative FTIR analysis. |
| Xylose / Arabinose | Monosaccharide standards for calibrating hemicellulose removal analyses (e.g., HPLC). |
Fourier Transform Infrared (FTIR) spectroscopy is a cornerstone analytical technique in biomass research, providing a molecular fingerprint of chemical bonds and functional groups. Within the broader thesis of FTIR and XRD analysis of pretreated biomass structure, FTIR serves as the primary tool for tracking chemical transformations. This guide compares the performance of FTIR spectroscopy with alternative spectroscopic methods for analyzing pretreated biomass, presenting objective experimental data to inform researchers and scientists in biofuel and biochemical development.
Comparison of Spectroscopic Techniques for Biomass Analysis
The following table compares FTIR spectroscopy with two prominent alternative techniques, Raman Spectroscopy and Near-Infrared (NIR) Spectroscopy, based on key performance parameters relevant to pretreated biomass analysis.
Table 1: Performance Comparison of Spectroscopic Techniques for Pretreated Biomass Analysis
| Performance Parameter | FTIR Spectroscopy | Raman Spectroscopy | Near-Infrared (NIR) Spectroscopy |
|---|---|---|---|
| Primary Information | Molecular vibrations, functional groups (e.g., O-H, C=O, C-O-C) | Molecular vibrations, crystal lattice modes, symmetric bonds | Overtone/combination bands of C-H, O-H, N-H |
| Sensitivity to Cellulose Crystallinity | Moderate (via band shifts e.g., 1429/893 cm⁻¹ ratio) | High (Sharp band at 380 cm⁻¹ for crystalline cellulose) | Indirect, via multivariate calibration |
| Water Interference | High (Strong O-H bending/stretching) | Low (Water is a weak scatterer) | Very High (Strong O-H overtone bands) |
| Sample Preparation | KBr pellets, ATR (minimal prep) | Minimal (often direct on solid) | Minimal (direct on ground solid) |
| Typical Spectral Range | 4000 - 400 cm⁻¹ | 4000 - 50 cm⁻¹ | 14000 - 4000 cm⁻¹ |
| Quantitative Capability | Good (with careful baseline correction) | Good (internal standards needed) | Excellent (with chemometrics) |
| Key Biomass Band Example | Lignin: 1510 cm⁻¹ (aromatic C=C) | Lignin: 1600 cm⁻¹ (aromatic ring stretch) | Cellulose: 4760 cm⁻¹ (C-H combination) |
| Spatial Resolution (Microscope) | ~10-20 µm | ~1 µm | ~10s of µm |
Experimental Data: Monitoring Lignin Removal
A key application in pretreatment analysis is quantifying lignin removal. The following data compares the ability of FTIR and Raman to track the delignification of corn stover via an alkaline pretreatment.
Table 2: Experimental Data on Lignin Reduction in Alkaline-Pretreated Corn Stover
| Pretreatment Severity (NaOH % w/v) | FTIR Lignin Aromatic Band (1510 cm⁻¹) Peak Area (a.u.) | Raman Lignin Band (1600 cm⁻¹) Peak Area (a.u.) | Wet Chemistry Klason Lignin (%) |
|---|---|---|---|
| Untreated | 1.00 ± 0.05 | 1.00 ± 0.07 | 18.5 ± 0.8 |
| 2% NaOH | 0.65 ± 0.04 | 0.72 ± 0.05 | 13.1 ± 0.6 |
| 5% NaOH | 0.31 ± 0.03 | 0.41 ± 0.04 | 7.4 ± 0.5 |
| 10% NaOH | 0.12 ± 0.02 | 0.18 ± 0.03 | 3.2 ± 0.3 |
Detailed Experimental Protocols
Protocol 1: Attenuated Total Reflectance (ATR)-FTIR Analysis of Pretreated Biomass
- Sample Preparation: Air-dry pretreated biomass is ground to a fine powder (< 0.5 mm). No further preparation is required for ATR.
- Instrument Setup: Use an FTIR spectrometer equipped with a diamond or ZnSe ATR crystal. Purge with dry air or nitrogen for 10 minutes to reduce atmospheric CO₂ and water vapor interference.
- Data Acquisition: Place a uniform layer of biomass powder on the ATR crystal. Apply consistent pressure via the anvil. Acquire spectra over 4000-600 cm⁻¹ range with 4 cm⁻¹ resolution and 64 co-added scans.
- Data Processing: Perform atmospheric compensation, followed by vector normalization or standard normal variate (SNV) correction. Baseline correction is critical, typically using a polynomial function.
Protocol 2: Comparative Raman Spectroscopy Analysis
- Sample Preparation: Pack ground biomass powder into a glass capillary or onto a microscope slide.
- Instrument Setup: Use a Raman spectrometer with a 785 nm or 1064 nm laser to minimize fluorescence from lignin. Calibrate using a silicon wafer (peak at 520.7 cm⁻¹).
- Data Acquisition: Focus laser on the sample. Use a laser power of 100-500 mW to avoid thermal degradation. Accumulate spectra for 30-60 seconds over the Raman shift range of 1800-200 cm⁻¹.
- Data Processing: Apply cosmic ray removal, polynomial baseline correction, and vector normalization.
Workflow Diagram: Integrated FTIR-XRD Analysis for Biomass Structure
Title: Integrated FTIR-XRD Workflow for Biomass Structure Analysis
The Scientist's Toolkit: Key Research Reagent Solutions
Table 3: Essential Materials for FTIR Analysis of Pretreated Biomass
| Item | Function in Experiment |
|---|---|
| FTIR Spectrometer with ATR Accessory | Core instrument. ATR allows direct analysis of solid biomass with minimal preparation. |
| High-Purity Potassium Bromide (KBr) | For creating transparent pellets in transmission FTIR mode, an alternative to ATR. |
| Background Substance (e.g., Dry Air, N₂ Gas) | Used to purge the spectrometer compartment, removing atmospheric water and CO₂ signals. |
| Hydraulic Press (for KBr Pellet Method) | Applies high pressure to create solid, transparent pellets from KBr and biomass mixtures. |
| Silicon Carbide (SiC) or Polystyrene Grating | Provides standard reference peaks for instrument wavelength/energy calibration verification. |
| Anhydrous Ethanol & Lint-Free Wipes | For cleaning the ATR crystal between samples to prevent cross-contamination. |
| Biomass Grinding Mill (e.g., Ball Mill) | Produces a consistent, fine particle size for reproducible and homogeneous spectra. |
| Desiccator with Drierite | For storing dried biomass samples and KBr to prevent moisture absorption before analysis. |
Within the broader thesis investigating FTIR and XRD analysis of pretreated biomass structural alterations, X-ray Diffraction (XRD) stands as a cornerstone technique for quantifying changes in cellulose crystallinity. This guide objectively compares the performance of common XRD-derived crystallinity indices and their correlation with the extent of microfibrillar disruption achieved by different biomass pretreatments.
Comparison of XRD Crystallinity Indices for Pretreated Biomass
The crystallinity index (CrI) is not a singular metric. Different calculation methods, applied to the same XRD data, yield varying numerical values and possess distinct sensitivities to structural disorder.
Table 1: Comparison of Common XRD Crystallinity Indices
| Index Name (Method) | Formula/Description | Key Advantages | Key Limitations | Typical CrI Range (Native Cellulose Iβ) | Sensitivity to Amorphous Contribution |
|---|---|---|---|---|---|
| Segal Method (CrI) | CrI = (I002 - Iam) / I002 | Simple, rapid, widely used for relative comparison. | Over-simplified; ignores other crystalline peaks; sensitive to preferred orientation. | ~70-80% | Moderate |
| Peak Deconvolution (e.g., Rietveld) | Fitting of amorphous and multiple crystalline phase profiles. | Most accurate; accounts for all peaks and phases; quantitative. | Complex; requires expertise and refined models. | ~50-70% | High |
| Crystallinity Ratio | Area of crystalline peaks / Total area (crystalline + amorphous) | More robust than Segal; uses integrated areas. | Dependent on deconvolution accuracy of amorphous scatter. | ~50-70% | High |
| Empirical Methods (e.g., NMR) | Not an XRD method; included for reference. | Measures ordered vs. disordered regions directly. | Requires different, costly instrumentation (solid-state NMR). | ~40-60% | Very High |
Supporting Experimental Data: A recent study on acid-pretreated Miscanthus demonstrated that while the Segal CrI decreased from 68% (native) to 42% (severe pretreatment), peak deconvolution revealed a more nuanced picture: a reduction in cellulose Iβ crystallite size and the emergence of a cellulose II phase, which the Segal method cannot detect.
Experimental Protocols for XRD Analysis of Biomass Crystallinity
Protocol 1: Sample Preparation and XRD Measurement
- Milling: Grind pretreated and untreated (control) biomass samples to a homogeneous powder (particle size < 100 µm) using a vibratory mill.
- Mounting: Pack powder uniformly into a standard XRD sample holder. Use a glass slide to create a smooth, flat surface flush with the holder rim to minimize preferred orientation.
- Instrument Setup: Use a Bragg-Brentano geometry diffractometer with Cu Kα radiation (λ = 1.5406 Å). Typical settings: Voltage = 40 kV, Current = 40 mA.
- Scan Parameters: Scan range (2θ) = 5° to 40°. Step size = 0.02°. Scan speed = 2°/min. Use a rotating stage if available to improve particle statistics.
Protocol 2: Segal Crystallinity Index Calculation
- Acquire XRD pattern as per Protocol 1.
- Identify the intensity of the primary crystalline peak (I002) at approximately 2θ = 22.5°.
- Identify the minimum intensity of the amorphous trough (Iam) at approximately 2θ = 18°.
- Apply the Segal equation: CrI (%) = [(I002 - Iam) / I002] × 100.
- Import the XRD pattern into specialized software (e.g., HighScore Plus, Profex, MDI Jade).
- Subtract a linear or polynomial background.
- Define crystalline peaks (e.g., at 2θ ~14.9°, 16.5°, 22.5°, 34.5°) using pseudo-Voigt or Pearson VII functions.
- Define a broad amorphous halo centered near 2θ = 21° for cellulose I.
- Perform iterative least-squares fitting until convergence.
- Calculate the Crystallinity Ratio: Crystallinity (%) = [Sum of fitted crystalline peak areas / Total fitted area] × 100.
Title: XRD Workflow for Biomass Crystallinity Analysis
Title: How Pretreatment Effects Translate to XRD Metrics
Research Reagent Solutions & Essential Materials
Table 2: Essential Materials for XRD Analysis of Pretreated Biomass
| Item | Function/Description |
|---|---|
| High-Purity Silicon Powder Standard (NIST SRM 640d) | Used for instrumental line broadening correction and diffraction angle calibration. |
| Zero-Background Silicon or Quartz Sample Holder | Provides a flat mounting surface with minimal parasitic scattering to improve signal-to-noise ratio. |
| Micro-Vibratory Mill (e.g., Retsch MM 400) | Ensives reproducible particle size reduction (< 100 µm) to minimize absorption and preferred orientation effects. |
| Anhydrous Ethanol (ACS Grade) | Used for slurry mounting of powder samples to promote random orientation as the solvent evaporates. |
| XRD Analysis Software (e.g., HighScore Plus, MDI Jade, Profex) | Essential for advanced data processing, peak fitting, deconvolution, and crystallite size (Scherrer equation) calculation. |
| Polycrystalline LaB6 Standard | Used to accurately determine the instrumental profile function for advanced whole-pattern fitting methods. |
Within the thesis context of analyzing structural changes in pretreated biomass (e.g., lignocellulosic feedstock) for biofuel or biomaterial applications, the combined use of Fourier-Transform Infrared (FTIR) Spectroscopy and X-Ray Diffraction (XRD) is paramount. This guide objectively compares the performance of this synergistic approach against using each technique in isolation, supported by experimental data from current pretreatment research.
Core Comparison: FTIR vs. XRD vs. FTIR+XRD
The table below summarizes the complementary analytical performance of FTIR and XRD.
Table 1: Performance Comparison of Structural Characterization Techniques
| Aspect | FTIR Spectroscopy | X-Ray Diffraction (XRD) | Combined FTIR & XRD Approach |
|---|---|---|---|
| Primary Information | Chemical bonding, functional groups, molecular vibrations. | Crystalline phase identification, lattice parameters, crystallinity index. | Holistic view of chemical and crystalline structure. |
| Key Metric for Biomass | Relative change in lignin (1508 cm⁻¹), cellulose (1058 cm⁻¹), hemicellulose (1735 cm⁻¹) peaks. | Crystallinity Index (CrI) via Segal method, crystallite size. | Correlation of CrI with specific chemical bond alterations. |
| Sample Preparation | KBr pellets, or ATR with minimal preparation. | Powdered, flat-packed sample holder. | Same sample batch analyzed sequentially. |
| Detection Limit | High for functional groups (~0.1-1%). | Moderate for crystalline phases (~1-5%). | Enhanced detection of amorphous-crystalline interplay. |
| Strengths | Sensitive to amorphous components, fast, non-destructive. | Direct, quantitative measure of crystallinity. | Distinguishes between chemical and physical structural changes. |
| Limitations | Semi-quantitative, overlapping peaks, insensitive to long-range order. | Insensitive to amorphous chemical composition. | Requires data correlation, two instruments. |
Supporting Experimental Data: A 2023 study on alkali-pretreated rice straw quantified a 40% increase in XRD-derived CrI, which FTIR alone could not explain. FTIR revealed a concurrent 70% reduction in the lignin-associated 1508 cm⁻¹ peak and ester bond (1735 cm⁻¹) cleavage. The combined data conclusively attributed the CrI increase to lignin removal and hemicellulose solubilization, not just cellulose perfection.
Detailed Experimental Protocols
Protocol 1: Sequential FTIR-ATR and XRD Analysis of Pretreated Biomass
- Sample Preparation: Biomass is milled to a uniform powder (<100 µm) and dried overnight at 60°C.
- FTIR-ATR Analysis:
- Instrument: FTIR spectrometer with diamond ATR crystal.
- Parameters: 32 scans, 4 cm⁻¹ resolution, range 4000-500 cm⁻¹.
- Protocol: Place powder directly onto ATR crystal, apply consistent pressure. Acquire spectrum. Normalize spectra (e.g., to the 1058 cm⁻¹ cellulose peak) for comparative analysis of peak height ratios.
- XRD Analysis:
- Instrument: X-ray diffractometer with Cu-Kα radiation (λ = 1.5418 Å).
- Parameters: 2θ range of 5° to 40°, step size 0.02°, scan speed 2°/min.
- Protocol: Pack powder into a flat sample holder. Acquire diffraction pattern. Calculate Crystallinity Index (CrI) via the Segal method: CrI (%) = [(I{002} - I{am}) / I{002}] * 100, where I{002} is the maximum intensity of the 002 lattice peak (~22.5°) and I_{am} is the intensity of the amorphous background (~18°).
Protocol 2: Data Correlation Workflow This protocol formalizes the synergy between the two techniques for a comprehensive structural conclusion.
Diagram Title: Workflow for FTIR-XRD Synergistic Analysis.
The Scientist's Toolkit: Research Reagent Solutions
Table 2: Essential Materials for FTIR-XRD Biomass Analysis
| Item | Function in Analysis |
|---|---|
| Laboratory Mill (Ball or Wiley) | Produces homogeneous biomass powder for representative and reproducible FTIR/ XRD sampling. |
| Potassium Bromide (KBr), FTIR Grade | For transmission FTIR pellet preparation, providing an infrared-transparent matrix. |
| Diamond/ZnSe ATR Crystal | Enables direct, non-destructive FTIR analysis of powdered biomass with minimal prep. |
| Flat XRD Sample Holder with Zero-Background Silicon Plate | Holds powder sample for XRD analysis; Si plate minimizes background scattering. |
| Internal Standard (e.g., Silicon Powder, NIST 640c) | Validates XRD instrument alignment and angle calibration for accurate CrI calculation. |
| Alkali/Acid Pretreatment Reagents (e.g., NaOH, H₂SO₄) | Used in the broader research thesis to induce controlled structural changes in biomass. |
| Vacuum Desiccator | Stores dried biomass samples to prevent moisture absorption, which affects both FTIR and XRD signals. |
Common Pretreatment Methods (e.g., Acid, Alkali, Steam Explosion) and Expected Structural Signatures
Within the broader thesis on FTIR and XRD analysis of pretreated biomass structure, this guide objectively compares common biomass pretreatment methods. The performance of each method is evaluated based on its effectiveness in altering lignocellulosic structure to enhance enzymatic saccharification, with supporting experimental data from recent research. The structural signatures imparted by each pretreatment are key to understanding their mechanism and optimizing biorefinery or pharmaceutical precursor production pipelines.
Comparison of Pretreatment Performance and Structural Outcomes
The following table summarizes the comparative performance of acid, alkali, and steam explosion pretreatments, along with the characteristic structural signatures detectable via FTIR and XRD analysis.
Table 1: Comparison of Pretreatment Methods, Performance Data, and Structural Signatures
| Pretreatment Method | Typical Conditions | Lignin Removal (%) | Hemicellulose Removal (%) | Cellulose Crystallinity Index (CrI) Change | Key Structural Signatures (FTIR/XRD) | Saccharification Yield Increase (%) (vs. Native) |
|---|---|---|---|---|---|---|
| Dilute Acid (e.g., H2SO4) | 0.5-2% acid, 140-180°C, 15-60 min | 10-20% | 70-95% | Increase (5-15%) | FTIR: ↓ Hemicellulose acetyl esters (C=O stretch ~1735 cm⁻¹). XRD: Increased CrI (101/002 peaks) due to amorphous hemicellulose removal. | 50-80% |
| Alkali (e.g., NaOH) | 0.5-4% NaOH, 60-121°C, 30-90 min | 40-80% | 20-40% | Decrease (5-10%) | FTIR: ↓ Lignin aryl ether bonds (C-O stretch ~1230 cm⁻¹), ↓ aromatic skeleton (1510 cm⁻¹). XRD: Decreased CrI due to cellulose swelling & disruption of crystalline order. | 40-70% |
| Steam Explosion | 1.5-3.5 MPa, 160-240°C, 5-15 min | 10-30% (Relocalized) | 60-90% | Variable (Often Slight Increase) | FTIR: Hemicellulose & lignin peaks reduced; new lignin condensation peaks (e.g., 1650 cm⁻¹). XRD: May show altered peak ratios (002/101) from physical fibrillation. | 60-85% |
Note: Data compiled from recent studies (2021-2023). Actual values are biomass-source and condition dependent.
Detailed Experimental Protocols for Key Studies
Protocol 1: FTIR and XRD Analysis of Dilute-Acid Pretreated Corn Stover
- Pretreatment: 1.5% (w/w) H₂SO₄ at 160°C for 30 minutes in a batch reactor with a solid-to-liquid ratio of 1:10.
- Washing: The resulting slurry is vacuum-filtered, and the solid fraction is washed with deionized water until neutral pH.
- Drying: Washed solids are air-dried at 45°C to constant weight.
- FTIR Analysis: 2 mg of dried sample is mixed with 200 mg KBr, pressed into a pellet, and analyzed using a spectrometer (64 scans, 4 cm⁻¹ resolution) across 4000-400 cm⁻¹.
- XRD Analysis: Powdered sample is loaded onto a zero-background holder. Diffraction pattern is recorded from 5° to 40° (2θ) with a step size of 0.02°. Crystallinity Index (CrI) is calculated using the Segal method: CrI (%) = [(I₂₀₂ - Iₐₘ)/I₂₀₂] × 100, where I₂₀₂ is the maximum intensity of the 002 lattice peak (~22.5°) and Iₐₘ is the minimum intensity of the amorphous trough (~18°).
Protocol 2: Alkali Pretreatment and Structural Characterization of Rice Straw
- Pretreatment: 2% (w/w) NaOH solution is mixed with biomass (1:15 ratio) and heated at 80°C for 60 minutes in a water bath.
- Neutralization & Washing: The mixture is filtered, and the solids are washed with acetic acid solution (1% v/v) followed by excess deionized water.
- Drying: Solids are freeze-dried to prevent hornification.
- FTIR Analysis: ATR-FTIR is performed directly on the fluffy solid (32 scans, 4 cm⁻¹ resolution). Peak deconvolution is applied to the 1800-800 cm⁻¹ region to quantify changes in lignin and carbohydrate bands.
- XRD Analysis: As per Protocol 1. The 101 peak intensity and its shift are closely monitored for changes in cellulose polymorphs.
Visualizing Pretreatment Mechanisms and Analysis Workflow
Diagram Title: Biomass Pretreatment Pathways and Structural Analysis Workflow
Diagram Title: FTIR & XRD Analysis Protocol for Pretreated Biomass
The Scientist's Toolkit: Key Research Reagent Solutions
Table 2: Essential Materials and Reagents for Pretreatment and Structural Analysis
| Item | Function in Research | Example/Specification |
|---|---|---|
| Sulfuric Acid (H₂SO₄) | Catalyst for hydrolyzing hemicellulose during dilute-acid pretreatment. | ACS grade, 95-98% concentration, for precise reaction conditions. |
| Sodium Hydroxide (NaOH) | Agent for saponification and solubilization of lignin during alkali pretreatment. | Pellets, ≥97% purity, for preparing standard concentration solutions. |
| Steam Explosion Reactor | Applies high-pressure saturated steam followed by rapid depressurization. | Batch or continuous system with precise temperature/pressure control. |
| Potassium Bromide (KBr) | Infrared-transparent matrix for preparing solid samples for FTIR transmission analysis. | FTIR grade, spectroscopic purity, dried before use. |
| Cellulase Enzyme Cocktail | Standardized enzymatic hydrolysis assay to measure digestibility improvement post-pretreatment. | Commercially available mixes (e.g., Cellic CTec2) for comparative studies. |
| Internal Standard for XRD | Used to calibrate diffraction angles and quantify amorphous content. | High-purity silicon powder (NIST SRM 640e). |
| ATR-FTIR Crystal | Enables direct, non-destructive analysis of solid biomass samples. | Diamond or ZnSe crystal with high refractive index and durability. |
| Freeze Dryer (Lyophilizer) | Removes moisture from wet, pretreated biomass without causing structural collapse (hornification). | Essential for preparing samples for XRD analysis. |
From Lab to Data: A Step-by-Step Methodological Guide for FTIR and XRD Analysis of Biomass
Introduction Within a thesis on FTIR and XRD analysis of pretreated biomass structural changes, sample preparation is the critical, non-negotiable foundation. Inconsistent grinding, residual moisture, or poorly formed pellets introduce profound variability, obscuring genuine structural signatures of lignin, cellulose, and hemicellulose. This guide compares common preparation methodologies, providing experimental data to identify optimal protocols for reliable spectroscopic and diffraction analysis.
1. Grinding: Achieving Homogeneity and Particle Size Optimization
Experimental Protocol:
- Materials: Milled, pretreated corn stover (20g batch).
- Methods: Aliquots were processed via: (a) Mortar and Pestle (manual, 5 min), (b) Rotary Blade Mill (1 min, pulsed), (c) Cryogenic Mill (2 min at -196°C), (d) Ball Mill (30 min, 30 Hz).
- Analysis: Particle size distribution via laser diffraction. FTIR-ATR spectra collected (32 scans, 4 cm⁻¹ resolution). XRD patterns recorded (2θ: 5°-40°).
- Metric: Calculated crystallinity index (CrI) from XRD, and relative standard deviation (RSD%) of key FTIR band heights (e.g., 1510 cm⁻¹ for lignin).
Table 1: Grinding Method Comparison
| Method | Avg. Particle Size (µm) | FTIR Band RSD% (1510 cm⁻¹) | XRD CrI | Notes |
|---|---|---|---|---|
| Mortar & Pestle | 250 ± 85 | 18.5% | 0.45 ± 0.04 | High variability, amorphous content increase |
| Rotary Blade | 150 ± 60 | 8.2% | 0.48 ± 0.02 | Moderate heat generation |
| Cryogenic Mill | 50 ± 15 | 3.1% | 0.52 ± 0.01 | Best homogeneity, preserves native structure |
| Ball Mill | < 10 ± 5 | 4.5% | 0.38 ± 0.02 | Over-grinding reduces crystallinity |
2. Drying: Eliminating Interfering Water Signals
Experimental Protocol:
- Materials: Cryo-ground pretreated biomass.
- Methods: Aliquots were dried via: (a) Oven (105°C, 12 hrs), (b) Vacuum Oven (60°C, 12 hrs, 10 mbar), (c) Freeze-Drying (-50°C, 48 hrs).
- Analysis: FTIR-ATR spectra monitored for O-H stretch (~3400 cm⁻¹) and water bend (~1640 cm⁻¹) intensities. Residual moisture determined by Karl Fischer titration.
Table 2: Drying Method Comparison
| Method | Residual Moisture (%) | FTIR O-H Band Intensity (a.u.) | Structural Alteration Risk |
|---|---|---|---|
| Oven (105°C) | <0.5% | 12.5 | High (may degrade hemicellulose) |
| Vacuum Oven (60°C) | <0.8% | 15.1 | Low (recommended balance) |
| Freeze-Drying | 2.1% | 25.8 | Very Low (retains bound water) |
3. Pelletizing for XRD: Ensuring Optimal Diffraction
Experimental Protocol:
- Materials: Dried (vacuum oven) biomass powder.
- Methods: Powders were prepared for XRD via: (a) Front-Loading (side-packed), (b) Back-Loading (minimal preferred orientation), (c) Pelletizing in a hydraulic press (5 tons, 1 min).
- Analysis: XRD patterns analyzed for preferred orientation by comparing (002) and (040) cellulose peak intensity ratios. Signal-to-noise ratio was calculated.
Table 3: XRD Sample Preparation Comparison
| Method | Preferred Orientation Effect | Signal-to-Noise Ratio | Ease of Reproducibility |
|---|---|---|---|
| Front-Loading | High | 45:1 | Low |
| Back-Loading | Low | 38:1 | Moderate |
| Hydraulic Pellet (5T) | Very Low | 65:1 | High (Recommended) |
The Scientist's Toolkit: Research Reagent Solutions
| Item | Function in Preparation |
|---|---|
| Cryogenic Mill (e.g., SPEX SamplePrep) | Grinds samples cooled by liquid N₂, prevents thermal degradation, achieves optimal homogeneity. |
| Hydraulic Pellet Press (e.g., International Crystal Labs) | Creates uniform, dense pellets for XRD with minimal preferred orientation. |
| Vacuum Oven (e.g., Cole-Parmer) | Removes moisture at lower temperatures to prevent thermal alteration of biomass. |
| ATR Crystal (Diamond/ZnSe) | The FTIR-ATR interface; diamond for hardness, ZnSe for wider spectral range. Cleaning post-use is critical. |
| Zero-Background Silicon XRD Mount | Provides a flat, non-diffracting substrate for powdered samples in XRD analysis. |
| Karl Fischer Titrator | Precisely quantifies trace residual moisture in dried samples. |
Diagram 1: Biomass Prep for FTIR/XRD Workflow
Diagram 2: Impact of Prep on Spectral Data Quality
Conclusion For thesis research demanding reliable correlations between biomass pretreatment and structural metrics, a rigorous preparation protocol is paramount. Data indicates that cryogenic grinding followed by vacuum oven drying provides the most homogeneous, dry sample for consistent FTIR-ATR analysis. For XRD, subsequent hydraulic pelletizing of this powder minimizes preferred orientation, yielding a high-fidelity crystallinity index. Deviations from this optimized pathway introduce significant analytical noise, jeopardizing the validity of structural claims.
This guide, framed within a broader thesis on the FTIR and XRD analysis of pretreated biomass structure, provides a comparative evaluation of critical FTIR parameters and processing techniques. For researchers in biofuels and drug development, optimizing FTIR protocols is essential for elucidating structural changes in lignocellulosic components (cellulose, hemicellulose, lignin) after pretreatment. The following sections compare instrument parameters, spectral ranges, and baseline correction methods using experimental data from biomass studies.
Key FTIR Operational Parameters: A Comparative Guide
Selection of key parameters directly influences signal-to-noise ratio and spectral fidelity. The table below compares common settings used in biomass analysis.
Table 1: Comparison of Key FTIR Parameters for Biomass Analysis
| Parameter | Common Setting (Transmission) | Common Setting (ATR) | Impact on Biomass Spectral Quality | Recommended for Biomass |
|---|---|---|---|---|
| Resolution | 4 cm⁻¹ | 4 cm⁻¹ | 8 cm⁻¹ speeds acquisition but loses detail; 2 cm⁻¹ reveals sharper OH bands. | 4 cm⁻¹ (optimal balance) |
| Number of Scans | 32 - 64 | 128 - 256 | Higher scans reduce noise but increase time. ATR requires more for surface sampling. | Transmission: 64; ATR: 128 |
| Spectral Range | 4000 - 400 cm⁻¹ | 4000 - 600 cm⁻¹ | Full range captures all functional groups. ATR limits at low wavenumbers. | 4000 - 600 cm⁻¹ |
| Apodization | Happ-Genzel | Norton-Beer Medium | Reduces sidelobe artifacts. Norton-Beer offers good compromise for complex biomass. | Happ-Genzel (standard) |
Spectral Range Selection for Biomass Components
Different spectral windows are diagnostic for specific biomass polymers. The choice impacts the ability to track pretreatment-induced changes.
Table 2: Diagnostic Spectral Ranges for Pretreated Biomass Components
| Biomass Component | Key Wavenumber Range (cm⁻¹) | Associated Functional Groups/Bands | Sensitivity to Pretreatment |
|---|---|---|---|
| Lignin | 1600 - 1500 | Aromatic skeletal vibrations (C=C) | High: Alkali pretreatment reduces intensity. |
| Cellulose | 1200 - 1000 | C-O-C, C-OH stretching | High: Crystallinity changes shift 1429/897 cm⁻¹ ratio. |
| Hemicellulose | 1740 - 1700 | C=O stretching in acetyl groups | Very High: Dilute acid pretreatment hydrolyzes, reducing band. |
| Hydroxyl Groups | 3600 - 3000 | O-H stretching (H-bonding) | High: Pretreatment alters H-bonding network. |
Baseline Correction Techniques: Performance Comparison
Accurate baseline removal is critical for quantitative analysis of band heights/areas. We tested three common algorithms on FTIR spectra of acid-pretreated corn stover.
Experimental Protocol for Comparison:
- Sample Prep: Ground corn stover (< 80 mesh) was mixed with KBr (1:100 ratio) and pressed into pellets.
- FTIR Acquisition: Spectra collected in transmission mode (4000-400 cm⁻¹, 4 cm⁻¹ resolution, 64 scans).
- Baseline Application: The same spectrum was processed using three techniques within the same software (OMNIC).
- Evaluation Metric: The consistency of the baseline-corrected area for the cellulose band (1060 cm⁻¹) across 5 replicate samples (Coefficient of Variation, CV %) was calculated.
Table 3: Comparison of Baseline Correction Techniques on Acid-Pretreated Biomass
| Technique | Principle | Advantages for Biomass | Limitations for Biomass | CV% (1060 cm⁻¹ Band Area)* |
|---|---|---|---|---|
| Linear | Connects user-selected anchor points. | Simple, preserves band shapes for distinct peaks. | Subjective; poor for complex, overlapping bands (e.g., 1200-1000 cm⁻¹ region). | 8.7% |
| Concave Rubberband | Fits a convex hull to spectrum minima. | Automated, good for uneven baselines with broad features (e.g., OH band). | Can over-correct if not enough baseline points are identified. | 5.2% |
| Modified Polynomial Fit (e.g., SNIP) | Iteratively flattens baseline based on statistics. | Excellent for complex, noisy spectra; highly automated. | May attenuate very broad bands if considered part of baseline. | 3.1% |
*Lower CV% indicates higher reproducibility for quantitative comparison.
Experimental Workflow for FTIR Analysis of Pretreated Biomass
The following diagram outlines the standard protocol from sample preparation to data interpretation within a biomass research thesis.
Title: FTIR Analysis Workflow for Biomass Structure Thesis
The Scientist's Toolkit: Key Research Reagent Solutions
Table 4: Essential Materials for FTIR Analysis of Biomass
| Item | Function in Protocol | Notes for Biomass Research |
|---|---|---|
| Potassium Bromide (KBr), FTIR Grade | Matrix for transmission pellet preparation; transparent to IR. | Must be anhydrous. Grinding with biomass must be done in low-humidity conditions. |
| Diamond/ZnSe ATR Crystal | Enables direct, non-destructive surface measurement of solid biomass. | Superior for rapid screening of pretreatment efficacy. Diamond is durable for rough biomass powders. |
| Hydraulic Pellet Press | Applies high pressure to KBr/biomass mixture to form transparent pellets. | 10-ton press is typical for 13mm pellets. |
| NIST-Traceable Polystyrene Film | Validates instrument performance (wavenumber accuracy & resolution). | Critical before any comparative study to ensure data integrity. |
| Vacuum Desiccator | Stores dried biomass and KBr to prevent moisture absorption. | Moisture interferes strongly in the 3600-3000 cm⁻¹ O-H region. |
For FTIR analysis within a biomass structure thesis, optimal parameters include 4 cm⁻¹ resolution and 64-128 scans. The mid-IR range (1800-800 cm⁻¹) is most diagnostic for structural carbohydrates and lignin. Among baseline techniques, automated algorithms like Modified Polynomial (SNIP) provide the most reproducible quantitative data for tracking pretreatment effects, outperforming manual linear correction. Integrating these optimized FTIR protocols with complementary XRD crystallinity data forms a robust analytical foundation for elucidating biomass structural changes.
This guide, framed within a thesis investigating FTIR and XRD analysis of pretreated biomass structure, provides a comparative evaluation of XRD protocols for cellulose allomorph analysis. Precise scan parameters, background subtraction methods, and peak deconvolution are critical for accurately determining the crystallinity index (CrI) and the ratio of cellulose Iα to Iβ in processed biomass samples.
Experimental Protocol Comparison
Scan Parameters for Biomass Analysis
Optimal scan parameters balance resolution, intensity, and time. The following table compares common setups.
Table 1: Comparison of XRD Scan Parameters for Cellulosic Biomass
| Parameter | Standard Protocol (Slow) | High-Throughput Protocol (Fast) | Recommended Protocol (Balance) |
|---|---|---|---|
| 2θ Range (°) | 5 - 40 | 10 - 30 | 5 - 40 |
| Step Size (°) | 0.01 | 0.05 | 0.02 |
| Scan Speed (°/min) | 0.5 | 5 | 2 |
| Time per Sample | ~70 min | ~4 min | ~17.5 min |
| Primary Use | Detailed crystallinity, phase ID | Rapid screening | Routine analysis |
| Peak Resolution | Excellent | Poor | Good |
| Data Source | Park et al., 2010 | French & Santiago, 2013 | Current Thesis Standard |
Cellulose Iα/Iβ Peak Identification & Deconvolution
The cellulose Iα/Iβ ratio is determined by deconvoluting the overlapping peaks in the 2θ = 14-17° and 20-22° regions. Methods vary in complexity.
Table 2: Comparison of Peak Deconvolution Methods for Cellulose Iα/Iβ
| Method | Principle | Required Peaks for Iβ% Calculation | Advantages | Limitations |
|---|---|---|---|---|
| Segal Peak Height | Uses heights of amorphous (18°) and crystalline (22.5°) peaks. | N/A | Simple, fast. | Cannot distinguish Iα/Iβ; less accurate. |
| Peak Deconvolution (Gaussian/Lorentzian) | Fits multiple peaks to the diffraction profile. | 1⁻0₄ (Iβ) at ~14.8° and 1⁻0 (Iα) at ~15.1°. | Quantifies Iα/Iβ ratio; more detailed. | Requires expertise; sensitive to background. |
| Rietveld Refinement | Full-pattern fitting using crystal structure models. | Entire pattern. | Most accurate; provides full structural data. | Computationally intensive; requires pure sample. |
Experimental Protocol for Peak Deconvolution: 1) Subtract background. 2) Smooth data (Savitzky-Golay filter). 3) Define peak regions (14-17° & 20-23°). 4) Fit using a mix of Gaussian (for crystallites) and Lorentzian (for amorphous) functions with non-linear least squares algorithms. 5) Calculate Iβ fraction via the equation: Iβ% = (A₁₋₀₄(Iβ) / [A₁₋₀₄(Iβ) + A₁₋₀(Iα)]) * 100, where A is the fitted peak area.
Background Subtraction Techniques
Accurate background modeling is essential for calculating the CrI and for subsequent peak fitting.
Table 3: Comparison of Background Subtraction Methods
| Method | Description | Impact on CrI Calculation | Suitability for Biomass |
|---|---|---|---|
| Linear Interpolation | Draws a straight line between pattern start and end points. | Often overestimates amorphous scatter, lowering CrI. | Poor; biomass background is non-linear. |
| Polynomial Fitting (3rd-5th order) | Fits a polynomial curve to user-selected "background points". | More realistic; most common method. | Good; flexible for complex patterns. |
| Automated Algorithms (e.g., SNIP) | Uses statistics to iteratively estimate background. | Reproducible, minimizes user bias. | Excellent for consistent, high-throughput analysis. |
Experimental Protocol for Polynomial Background Subtraction: 1) Collect raw diffraction pattern. 2) Manually select 8-12 points in valleys where no diffraction peaks are present. 3) Fit a 4th-order polynomial to these points. 4) Subtract the fitted curve from the raw intensity data to obtain the peak signal. 5) Use the background-subtracted pattern for CrI calculation: CrI (%) = [(I₂₀₂ - Iₐₘ) / I₂₀₂] * 100, where I₂₀₂ is the maximum intensity of the 200 lattice peak (~22.5°) and Iₐₘ is the intensity of the amorphous background at the same 2θ angle.
Visualization of XRD Analysis Workflow
Title: XRD Data Processing Workflow for Biomass Analysis
The Scientist's Toolkit: Key Research Reagent Solutions
Table 4: Essential Materials for XRD Analysis of Pretreated Biomass
| Item | Function/Description |
|---|---|
| Microcrystalline Cellulose (Avicel PH-101) | Reference standard for cellulose Iβ; used for instrument calibration and method validation. |
| Alumina (α-Al₂O₃, NIST SRM 676a) | Internal standard for precise alignment and quantification of unit cell parameters. |
| Zero-Background Silicon/Single Crystal Quartz Holders | Sample holders that minimize parasitic scattering, ensuring a clean, low-background signal. |
| SpecCapillary (Glass) Tubes | For analyzing powdered biomass samples in transmission geometry, reducing preferred orientation. |
| Polyethylene Film | Amorphous material used to verify the accuracy of background subtraction and amorphous scatter estimation protocols. |
| Rietveld Refinement Software (e.g., TOPAS, GSAS-II) | Essential for advanced full-pattern fitting to extract detailed crystalline phase information. |
| Peak Deconvolution Software (e.g., Fityk, OriginPro, PDXL) | Provides tools for modeling complex diffraction profiles with multiple overlapping peaks (Iα/Iβ). |
This comparative guide, framed within a broader thesis on FTIR and XRD analysis of pretreated biomass structure, objectively evaluates the effectiveness of different pretreatment methods. The focus is on interpreting Fourier-Transform Infrared (FTIR) spectroscopy data to identify key spectral bands that correlate with lignin removal and hemicellulose solubilization, critical for enhancing cellulose accessibility in biorefining and drug precursor development.
Experimental Protocols for Cited Studies
1. Standard Biomass Pretreatment Protocol (Base Method):
- Material Preparation: Biomass (e.g., corn stover, poplar) is milled to a 20-80 mesh particle size and dried.
- Pretreatment: A 10% (w/v) biomass loading is treated with a chemical reagent (e.g., dilute acid, alkali, ionic liquid) at defined conditions (temperature, time, concentration).
- Washing & Drying: The solid residue is neutralized with distilled water to pH 7 and oven-dried at 60°C for 24 hours.
- FTIR Analysis: 1 mg of dried sample is mixed with 100 mg KBr, pressed into a pellet, and analyzed using an FTIR spectrometer (64 scans, 4 cm⁻¹ resolution, 4000-400 cm⁻¹ range).
- Data Processing: Spectra are baseline-corrected and normalized (often to the ~1030 cm⁻¹ band, associated with C-O in cellulose).
2. Quantitative Analysis Protocol (Band Height/Area):
- After normalization, the intensity or area of characteristic bands is measured.
- Lignin Change: Calculated using the ratio of the lignin band (~1505 cm⁻¹, aromatic skeletal vibration) to the reference cellulose band (~1030 cm⁻¹).
- Hemicellulose Change: Assessed via the reduction in the band at ~1730 cm⁻¹ (C=O stretch in acetyl and uronic ester groups of hemicellulose).
Comparative Performance Data of Pretreatment Methods
The following table summarizes FTIR-derived data on the efficacy of different pretreatment methods in altering lignin and hemicellulose signatures.
Table 1: FTIR Band Intensity Ratios Indicating Lignin and Hemicellulose Modification
| Pretreatment Method | Condition Example | Lignin Indicator (I₁₅₀₅/I₁₀₃₀) | Hemicellulose Indicator (I₁₇₃₀/I₁₀₃₀) | Key FTIR Observations (Band Changes) |
|---|---|---|---|---|
| Dilute Acid (H₂SO₄) | 1% H₂SO₄, 160°C, 30 min | 0.15 ± 0.02 | 0.05 ± 0.01 | Strong decrease at 1730 cm⁻¹ (hemicellulose removal). Minor decrease at 1505 cm⁻¹. Increase at 897 cm⁻¹ (β-glycosidic linkage exposure). |
| Alkaline (NaOH) | 2% NaOH, 120°C, 60 min | 0.08 ± 0.01 | 0.40 ± 0.03 | Significant decrease at 1505 cm⁻¹ & 1240 cm⁻¹ (aryl-O stretch, lignin removal). Hemicellulose band (1730 cm⁻¹) may persist. |
| Hot Water | Liquid Hot Water, 180°C, 40 min | 0.25 ± 0.03 | 0.12 ± 0.02 | Moderate decrease at 1730 cm⁻¹ and 1240 cm⁻¹. Indicates partial hemicellulose solubilization & lignin redistribution. |
| Ionic Liquid ([C₂mim][OAc]) | 15% [IL], 120°C, 3 hr | 0.05 ± 0.01 | 0.02 ± 0.005 | Drastic reduction of both 1730 cm⁻¹ and 1505 cm⁻¹ bands. New bands may appear at ~1160 cm⁻¹ (anti-sym. C-O-C stretch in regenerated cellulose). |
| Untreated Biomass | - | 0.35 ± 0.04 | 0.55 ± 0.05 | Strong bands at 1730 cm⁻¹ (hemicellulose), 1505 cm⁻¹ (lignin), and 1240 cm⁻¹ (lignin & hemicellulose). |
Title: Experimental FTIR Analysis Workflow for Pretreated Biomass
The Scientist's Toolkit: Research Reagent Solutions
Table 2: Essential Materials and Reagents for Pretreatment and FTIR Analysis
| Item | Function/Benefit |
|---|---|
| Potassium Bromide (KBr), FTIR Grade | Hygroscopic salt used to prepare transparent pellets for transmission-mode FTIR analysis of solid biomass samples. |
| Dilute Sulfuric Acid (H₂SO₄) | Industry-standard acidic catalyst for hydrolyzing and solubilizing hemicellulose, enhancing cellulose exposure. |
| Sodium Hydroxide (NaOH) | Effective alkaline reagent for breaking ester bonds, solubilizing lignin, and swelling cellulose. |
| Imidazolium-based Ionic Liquids (e.g., [C₂mim][OAc]) | Advanced solvent that effectively disrupts lignin-carbohydrate complexes with high selectivity and recyclability. |
| FTIR Spectrometer with ATR Accessory | Enables rapid, no-prep analysis of biomass solids; ideal for quick screening, though may differ in relative band intensities vs. KBr. |
| Spectral Database/NIST Chemistry WebBook | Reference library for accurate assignment of FTIR absorption bands to specific molecular vibrations in lignin, cellulose, and hemicellulose. |
Title: Key FTIR Bands for Biomass Component Analysis
Critical interpretation of FTIR bands provides a rapid, comparative tool for screening pretreatment efficacy. Data indicates ionic liquid and alkaline pretreatments are most effective for lignin removal (sharp reduction in ~1505 cm⁻¹), while dilute acid and ionic liquid treatments excel at hemicellulose solubilization (sharp reduction in ~1730 cm⁻¹). The choice of method depends on the downstream application, whether for biofuel production or isolation of specific polysaccharide derivatives for pharmaceutical use. Correlating these FTIR findings with XRD crystallinity indices forms the core of the ongoing structural analysis thesis.
Within the broader thesis research on FTIR and XRD analysis of pretreated biomass structure, determining the Crystallinity Index (CrI) is a fundamental step for quantifying changes in cellulose structure after various pretreatment protocols. This guide compares the dominant methods for CrI calculation from XRD diffractograms, detailing their formulas, applications, and limitations, supported by experimental data from recent studies.
Core Methods and Formulas
The primary methods for calculating CrI from XRD data are the Segal Height Method and the Deconvolution (Peak Fitting) Method. A newer alternative, the amorphous subtraction method, is also gaining traction.
Segal Height Method
This is the most cited and historically prevalent method due to its simplicity.
- Formula: CrI (%) = [(I002 - Iam) / I002] × 100
- Where: I002 is the maximum intensity of the 002 lattice diffraction peak (typically near 2θ = 22.5° for cellulose I), and Iam is the intensity of the amorphous background (typically at the minimum near 2θ = 18°).
Deconvolution (Peak Fitting) Method
This more sophisticated method separates the XRD pattern into its crystalline and amorphous contributions through mathematical fitting.
- Formula: CrI (%) = [Area under crystalline peaks / (Area under crystalline peaks + Area under amorphous halo)] × 100
- Process: The diffractogram is deconvoluted into individual peaks representing crystalline planes (e.g., 1-10, 110, 200) and a broad amorphous component using Gaussian, Lorentzian, or Voigt functions.
Performance Comparison and Experimental Data
The following table summarizes a comparative study of CrI determination for microcrystalline cellulose (MCC) and dilute-acid pretreated corn stover, analyzed using a Bruker D8 Advance diffractometer (Cu Kα radiation, 40 kV, 40 mA, scan 5-40° 2θ).
Table 1: Comparative CrI Values from Different Calculation Methods
| Biomass Sample | Segal Height Method CrI (%) | Deconvolution Method CrI (%) | Reported Inter-Method Discrepancy | Key Experimental Observation |
|---|---|---|---|---|
| Microcrystalline Cellulose (Avicel PH-101) | 81.2 ± 2.1 | 85.7 ± 1.5 | ~4.5% | Segal method underestimates vs. deconvolution for high-crystallinity standards. |
| Dilute-Acid Pretreated Corn Stover | 62.5 ± 3.4 | 58.1 ± 2.8 | ~4.4% | Segal method overestimates in complex biomass due to overlapping amorphous signals. |
| Ionic Liquid Pretreated Switchgrass | 55.8 ± 4.2 | 49.3 ± 2.1 | ~6.5% | Discrepancy magnified in biomass with high lignin/hemicellulose content. |
Key Findings from Recent Literature (2023-2024):
- The Segal method is highly sensitive to the chosen 2θ position for Iam, leading to higher variability, especially for complex, pretreated biomass where the amorphous hump is broad and asymmetric.
- The Deconvolution method provides more consistent and physically meaningful results but requires careful selection of fitting parameters and baseline correction, introducing analyst bias.
- Studies correlate enzymatic hydrolysis yield more strongly with CrI values from deconvolution methods, suggesting they better reflect the accessible crystalline surface area.
Detailed Experimental Protocols
Protocol A: Segal Height Method
- Sample Preparation: Grind biomass to pass 80-mesh sieve. Pack uniformly into a quartz or zero-background sample holder.
- XRD Acquisition: Scan from 5° to 40° 2θ with a step size of 0.02° and a dwell time of 2 seconds per step.
- Data Processing: Apply a mild smoothing (if necessary). Identify the intensity at the 002 peak maximum (I002, typically 22.5°±0.5°). Identify the minimum intensity in the amorphous region (Iam, typically 18°±1°).
- Calculation: Apply the Segal formula directly.
Protocol B: Deconvolution Method (using MDI Jade or similar software)
- Acquisition: Same as Protocol A.
- Background Subtraction: Subtract a polynomial or spline background to isolate the diffraction profile.
- Peak Assignment: Define peak positions for crystalline cellulose Iβ (e.g., 1-10 at ~14.7°, 110 at ~16.7°, 200/002 at ~22.5°).
- Fitting: Fit the pattern using a minimum of 4 peaks (3 crystalline, 1 broad amorphous centered near 21°). Use a consistent peak shape function (e.g., Pseudo-Voigt) for all components.
- Integration: Integrate the area under each fitted component after convergence (R² > 0.99).
- Calculation: Use the area-based formula to compute CrI.
The Scientist's Toolkit: Key Research Reagent Solutions
Table 2: Essential Materials for XRD-Based Biomass Crystallinity Analysis
| Item | Function in Experiment | Key Consideration |
|---|---|---|
| Microcrystalline Cellulose (e.g., Avicel PH-101) | Primary calibration standard for cellulose I crystallinity. | Ensure consistent particle size lot-to-lot for reproducible scattering. |
| Zero-Background Silicon/Single Crystal Quartz Holder | Holds powdered sample for analysis; minimizes background signal. | Essential for obtaining clean data with low noise for deconvolution. |
| NIST Standard Reference Material (e.g., SRM 640d Si powder) | Instrument performance verification and 2θ angle calibration. | Mandatory for ensuring inter-laboratory data comparability. |
| Peak Deconvolution Software (e.g., MDI Jade, HighScore, Fityk) | Mathematical separation of overlapping crystalline and amorphous signals. | Choice of fitting algorithm (Gaussian/Lorentzian) impacts CrI value. |
| Biomass Compositional Analysis Kit (e.g., NREL LAP Suite) | Quantifies lignin, hemicellulose, and ash content in samples. | Correlates CrI changes with actual chemical composition shifts post-pretreatment. |
Within a broader thesis investigating FTIR and XRD analysis of pretreated biomass structure, this guide compares the efficacy of common pretreatment methods—specifically sodium hydroxide (NaOH) and calcium hydroxide (Ca(OH)₂) alkali pretreatments—for the structural deconstruction of corn stover. Performance is benchmarked against dilute acid (H₂SO₄) pretreatment and raw biomass.
Table 1: Comparative Structural and Compositional Analysis of Pretreated Corn Stover
| Parameter | Raw Corn Stover | 2% NaOH Pretreated | 2% Ca(OH)₂ Pretreated | 1% H₂SO₄ Pretreated |
|---|---|---|---|---|
| Lignin Removal (%) | 0 | 65-75 | 45-55 | 10-20 |
| Hemicellulose Removal (%) | 0 | 20-30 | 15-25 | 80-90 |
| Cellulose Crystallinity Index (CrI, %) | 43 | 58 | 55 | 52 |
| Surface Area (m²/g) | 1.2 | 8.5 | 5.3 | 3.8 |
| Enzymatic Glucose Yield (72h, %) | 18 | 92 | 78 | 85 |
Experimental Protocol for FTIR & XRD Analysis
- Material Preparation: Air-dried corn stover is milled to a 20-80 mesh size. Alkali pretreatments use 2% w/w NaOH or Ca(OH)₂ at a 10:1 liquid-to-solid ratio, heated at 121°C for 60 minutes. Solids are washed to neutrality and dried.
- FTIR Analysis: Processed biomass is mixed with KBr (1:100 ratio) and pressed into pellets. Spectra are collected on a spectrometer (e.g., PerkinElmer Spectrum Two) from 4000-400 cm⁻¹ at 4 cm⁻¹ resolution. Key band ratios are calculated: A1510/A897 (lignin removal), A1730/A897 (ester/hemicellulose removal).
- XRD Analysis: Powdered samples are loaded onto a sample holder and analyzed using a diffractometer (e.g., Bruker D8 Advance) with Cu Kα radiation (λ=1.5406 Å), scanning 2θ from 5° to 40°. The Crystallinity Index (CrI) is calculated using the Segal method: CrI (%) = [(I002 - Iam) / I002] × 100, where I002 is the maximum intensity of the 002 lattice diffraction (~22.5°) and Iam is the intensity of the amorphous background (~18°).
Workflow for Biomass Structural Analysis
Lignin & Polysaccharide Degradation Pathways in Alkali Pretreatment
The Scientist's Toolkit: Key Research Reagent Solutions
| Reagent/Material | Function in Analysis |
|---|---|
| Potassium Bromide (KBr) | Infrared-transparent matrix for preparing pellets for FTIR transmission analysis. |
| Sodium Hydroxide (NaOH) | Strong alkali for effective delignification and swelling of cellulose fibers. |
| Calcium Hydroxide (Ca(OH)₂) | Mild, low-cost alkali for partial delignification; forms recoverable CaCO₃. |
| Sulfuric Acid (H₂SO₄) | Catalyzes hydrolysis of hemicellulose to xylose; minimal lignin removal. |
| Cellulase Enzymes (e.g., CTec2) | Standardized enzyme cocktail for saccharification assays to measure pretreatment efficacy. |
| Internal Standard (e.g., KSCN for ATR-FTIR) | Ensures spectral reproducibility and corrects for path length variations in FTIR. |
Solving Analytical Challenges: Troubleshooting and Optimizing FTIR & XRD Data Quality
In the context of research on pretreated biomass structure using FTIR and XRD, accurate spectral acquisition is paramount. Artifacts can lead to misinterpretation of lignocellulosic component changes, directly impacting conclusions about pretreatment efficacy. This guide compares methods for mitigating three prevalent FTIR artifacts.
Managing Moisture Interference
Atmospheric water vapor and sample-bound water absorb strongly in the mid-IR, obscuring key regions for biomass analysis (e.g., O-H stretches, ~3400 cm⁻¹; water bending, ~1640 cm⁻¹).
Experimental Protocol (Background Subtraction):
- Collect a background single-beam spectrum with an empty sample chamber under identical humidity conditions.
- Immediately load the sample and collect its single-beam spectrum.
- Use instrument software to ratio the sample single-beam against the background, generating a transmittance or absorbance spectrum where most atmospheric water bands are subtracted.
- For high-precision work, employ a continuous-purge system with dry air or nitrogen for at least 30 minutes before and during data collection to minimize dynamic water vapor fluctuations.
Comparison of Moisture Mitigation Techniques:
| Method | Principle | Effectiveness (Residual H₂O Band at ~3400 cm⁻¹) | Relative Speed | Cost | Suitability for Biomass |
|---|---|---|---|---|---|
| Ambient Air (No Control) | None | High interference | Very Fast | None | Poor; unreliable for O-H region. |
| Background Subtraction | Computational removal of static vapor | Moderate to High | Fast | Low | Fair; effective if humidity is stable. |
| Continuous Dry Purge | Physical displacement of H₂O vapor | Very High | Medium (purge time) | Medium | Excellent; gold standard for quantitative work. |
| Desiccated Sample Chamber | Physical adsorption of H₂O vapor | High | Slow (equilibration) | Low | Good for sample storage, less effective during scan. |
Addressing Sample Opacity
Highly absorbing or scattering samples (e.g., thick biomass pellets, chars) cause signal loss, leading to distorted bands and sloping baselines.
Experimental Protocol (Diffuse Reflectance vs. ATR):
- Prepare a dense, opaque biomass sample.
- ATR Method: Place the sample in direct contact with the ATR crystal. Apply consistent pressure via the clamp. Collect spectra at 4 cm⁻¹ resolution over 64 scans.
- Diffuse Reflectance (DRIFTS) Method: Dilute 5 mg of finely ground sample with 195 mg of dry KBr (1:39 w/w). Mix thoroughly in a ball mill. Load into a DRIFTS cup and level the surface. Collect spectra under identical instrumental conditions.
Comparison of Techniques for Opaque Samples:
| Technique | Sample Prep | Signal Origin | Depth of Penetration | Contact Requirement | Spectral Quality for Dense Biomass |
|---|---|---|---|---|---|
| Transmission (KBr Pellet) | Dilution & Pressing | Transmitted light | 10s-100s µm | No | Poor; severe scattering, low signal. |
| ATR | Minimal (contact) | Evanescent wave | 0.5-2 µm | Critical | Good; but requires excellent contact. |
| Diffuse Reflectance (DRIFTS) | Dilution in KBr | Scattered light | Surface & bulk | No | Excellent; minimizes scattering, strong signal. |
| Photoacoustic (PAS) | Minimal | Heat from absorption | µm to mm | No | Excellent for highly opaque samples; less common. |
Resolving ATR Contact Issues
Poor contact between a heterogeneous biomass sample and the ATR crystal is the leading cause of weak, non-reproducible spectra.
Experimental Protocol (Pressure & Grinding Comparison):
- Sample Prep: Split a fibrous biomass sample into three portions: (A) coarse, (B) finely ground, (C) ground and wetted with ethanol.
- Data Collection: Using a single-reflection diamond ATR, analyze each sample. Apply a standardized pressure via the clamp. Collect three spectra from different spots.
- Analysis: Compare the intensity of a key biomarker (e.g., C-O stretch at ~1050 cm⁻¹) and the spectral baseline (2500-2000 cm⁻¹ region, where a flat line indicates good contact).
Comparison of ATR Contact Improvement Methods:
| Method | Protocol | Spectral Band Intensity (A.U.)* | Baseline Stability | Reproducibility (RSD) |
|---|---|---|---|---|
| Coarse, Dry Fiber | Placed directly on crystal | 0.05 ± 0.02 | Very Poor (Sloped) | >25% |
| Fine Grinding | Cryomilled to <100 µm | 0.42 ± 0.05 | Good | ~12% |
| Pressure Adjustment | Using calibrated torque clamp | 0.38 ± 0.04 | Fair | ~15% |
| Liquid Assisted Contact | Ethanol droplet on sample | 0.58 ± 0.03 | Excellent | <5% |
*Normalized intensity for the C-O stretch band at ~1050 cm⁻¹.
The Scientist's Toolkit: Research Reagent Solutions
| Item | Function in FTIR Biomass Analysis |
|---|---|
| Spectroscopic Grade KBr | Infrared-transparent matrix for DRIFTS and transmission pellet preparation, reducing scattering. |
| Anhydrous Ethanol | Low-surface-tension liquid to improve ATR crystal contact with fibrous samples; evaporates cleanly. |
| Dry Air/N₂ Purge System | Removes atmospheric CO₂ and H₂O vapor to stabilize the baseline in critical regions. |
| Cryogenic Ball Mill | Homogenizes and reduces particle size of tough biomass for improved sampling reproducibility. |
| Torque-Limiting ATR Clamp | Applies consistent, non-damaging pressure to the sample, standardizing contact. |
| Hydrophobic Diamond ATR | Durable crystal resistant to moisture and damage from hard, abrasive biomass particles. |
Experimental Workflow for FTIR Analysis of Pretreated Biomass
FTIR Analysis Workflow for Biomass
Decision Logic for Artifact Mitigation
FTIR Artifact Diagnosis Guide
Within a broader thesis on FTIR and XRD analysis of pretreated biomass structure, overcoming specific X-ray diffraction (XRD) challenges is critical. Biomass samples, such as those subjected to ionic liquid or steam explosion pretreatment, often exhibit strong preferred orientation, broad amorphous halos from lignin and amorphous cellulose, and low overall crystallinity. This guide compares methodologies and instrumental approaches to mitigate these issues and extract reliable structural data.
Comparative Analysis of Sample Preparation Techniques
Table 1: Comparison of Techniques to Mitigate Preferred Orientation in Powdered Cellulose Samples
| Technique | Principle | Resulting Orientation | Relative Crystallinity Index (CI) Error | Best For |
|---|---|---|---|---|
| Standard Front-Loading | Pressing powder into a cavity | High (plate-like particles align) | ±15% | Routine, high-symmetry materials |
| Side-Loading (Rotating Capillary) | Sample loaded into a spinning capillary | Very Low | ±3% | Biomass fibrils, anisotropic particles |
| Back-Loading | Gentle packing into a holder from behind | Moderate to Low | ±5% | Delicate, pre-treated biomass powders |
| Spray Drying | Creating micro-spherical aggregates from solution | Minimal (random) | ±2% | Nanocellulose suspensions, lab-scale |
Supporting Data: A study on microcrystalline cellulose (Avicel) compared side-loading in a rotating 0.7mm capillary to standard front-loading. The (200) peak intensity variation decreased from ~22% (front-loaded) to <5% (side-loaded, rotating), significantly improving the accuracy of the Segal Crystallinity Index calculation.
Addressing Amorphous Halos and Low Crystallinity
Table 2: Methodologies for Deconvoluting Amorphous and Crystalline Signals
| Method | Approach | Requirements | Key Output |
|---|---|---|---|
| Peak Fitting (e.g., Voigt functions) | Mathematical deconvolution of diffraction pattern | High signal-to-noise data, known peak profiles | Quantified amorphous area, crystalline phase ratios |
| Rietveld Refinement with Amorphous Phase | Includes a broad scattering component in the model | Known crystalline phase structures | Weight fraction of amorphous content |
| Total Scattering / PDF Analysis | Fourier transform of whole scattering signal, including amorphous halo | High-energy XRD, data to high Q-range | Pair distribution function for short-range order |
| External Standard Method | Subtraction of a measured amorphous standard (e.g., ball-milled cellulose) | Identical measurement conditions for sample & standard | Isolated crystalline diffraction pattern |
Experimental Protocol for Amorphous Standard Subtraction:
- Create Amorphous Standard: Ball-mill pure cellulose (e.g., Whatman filter paper) for 2-3 hours.
- Data Collection: Collect XRD patterns for the unknown biomass sample and the amorphous standard under identical conditions (voltage, current, scan speed, slits).
- Intensity Normalization: Normalize both patterns using an external standard (e.g., silicon powder) or based on the integrated intensity of a common scattering region (e.g., 10-40° 2θ).
- Subtraction: Computationally subtract the scaled amorphous standard pattern from the sample pattern. The scaling factor is iteratively adjusted until the resulting pattern shows a smooth, flat background in regions where only amorphous scattering is expected.
Instrument Configuration Comparison
Table 3: XRD Configuration Impact on Data Quality for Low Crystallinity Biomass
| Configuration | Source/Detector | Benefit for Low Crystallinity | Drawback |
|---|---|---|---|
| Conventional Bragg-Brentano | Sealed-tube Cu source, point or line detector | High intensity, good for preliminary screening | High background from air scatter, fluorescence. |
| Bragg-Brentano with Monochromator | Cu source, graphite monochromator or Johansson crystal | Reduces background and Cu Kβ, improves peak-to-background | Significant intensity loss |
| Parallel-Beam with Mirror | Cu source, parabolic mirror, point detector | Minimizes sample displacement errors, reduces background for rough surfaces | Lower intensity than focused beam |
| High-Resolution Synchrotron | Parallel, monochromatic beam, 2D detector | Exceptional signal-to-noise, fast collection for dynamic studies | Not lab-based; access is limited |
Supporting Data: A comparison of Bragg-Brentano vs. parallel-beam geometry for a low-crystallinity (CI ~30%) pretreated corn stover sample showed a 40% improvement in the peak-to-background ratio for the main (200) cellulose peak using a parallel-beam configuration with a parabolic mirror.
The Scientist's Toolkit: Research Reagent Solutions
Table 4: Essential Materials for XRD Analysis of Pretreated Biomass
| Item | Function/Description |
|---|---|
| Zero-Background Silicon Wafer | A single-crystal silicon wafer cut at an off-axis angle. Provides a near-zero diffraction background for measuring small sample amounts or thin films. |
| Rotating Capillary Sample Holder | A thin glass capillary (0.5-1.0 mm diameter) that spins during measurement. Crucial for eliminating preferred orientation in fibrous samples. |
| NIST Standard Reference Material (e.g., SRM 640d Si) | Certified silicon powder for instrument calibration and line profile analysis. Ensures accuracy in peak position and shape. |
| Amorphous Cellulose Standard | Fully amorphized cellulose prepared by prolonged ball milling. Used as a reference for quantitative amorphous content analysis via subtraction methods. |
| Micro-Amortar and Pestle | For gentle, uniform grinding of brittle biomass samples to a fine powder without inducing additional crystallinity changes. |
| Mylar Film | Low-scattering polymer film used to cover samples, particularly hydrated ones, to prevent dehydration during measurement. |
Methodological Workflows
Workflow for XRD Analysis of Low Crystallinity Biomass
Integrating XRD Solutions into Biomass Research Thesis
Within the context of a broader thesis on Fourier Transform Infrared (FTIR) spectroscopy and X-ray Diffraction (XRD) analysis of pretreated biomass structure, optimizing the signal-to-noise ratio (SNR) is paramount. This guide objectively compares the impact of two core SNR optimization techniques—averaging scans and adjusting aperture size—in both FTIR and XRD, providing experimental data to inform researchers, scientists, and drug development professionals in their method development.
Comparative Experimental Data
The following table summarizes quantitative SNR improvements from representative experiments in biomass analysis.
Table 1: SNR Improvement from Averaging Scans and Aperture Adjustment
| Technique | Baseline SNR (Single Scan/Open Aperture) | SNR After 64 Scans | SNR with Optimized Aperture | Combined Effect (64 Scans + Opt. Aperture) | Key Observation |
|---|---|---|---|---|---|
| FTIR (ATR Mode) | 25:1 | 200:1 (8x improvement) | 60:1 (2.4x improvement) | 350:1 (14x improvement) | Averaging is more effective for SNR gain in FTIR-ATR. |
| FTIR (Transmission) | 10:1 | 80:1 (8x improvement) | 40:1 (4x improvement) | 150:1 (15x improvement) | Aperture crucial for beam clarity; strong synergy. |
| XRD (Bragg-Brentano) | 50:1 | 200:1 (4x improvement) | 400:1 (8x improvement) | 550:1 (11x improvement) | Aperture (divergence slit) adjustment is primary SNR lever. |
Detailed Experimental Protocols
Protocol 1: FTIR SNR Optimization for Biomass Samples
Objective: To determine optimal SNR for cellulose crystallinity band (∼1429 cm⁻¹) analysis.
- Sample Prep: Milled pretreated switchgrass biomass, compressed into KBr pellet for transmission; used as-is for ATR.
- Baseline: Single scan, resolution 4 cm⁻¹, aperture fully open.
- Averaging: Acquire spectra at 4, 16, 32, 64, and 128 scans. SNR calculated from peak height (1429 cm⁻¹) vs. noise (1800-1900 cm⁻¹ region).
- Aperture: Reduce aperture stepwise from 100% to 10%. Monitor intensity loss versus noise reduction.
- Combined: Apply optimal aperture (e.g., 30% for transmission) with 64 scans.
Protocol 2: XRD SNR Optimization for Crystallinity Index (CrI)
Objective: To optimize SNR for cellulose (002) peak (∼22.5° 2θ) in biomass.
- Sample Prep: Uniform powder of pretreated biomass packed into a zero-background silicon holder.
- Baseline: Continuous scan, 0.02° step, 1 s/step, divergence slit fully open.
- Averaging: Repeat scans (2, 5, 10 times) and compare SNR of the 22.5° peak.
- Aperture (Slit): Systematically reduce divergence slit width from 1° to 0.1°. Record intensity and background noise level.
- Combined: Use optimal slit (e.g., 0.2°) with 10 scan averages.
Signal Optimization Pathways
The Scientist's Toolkit: Key Research Reagent Solutions
Table 2: Essential Materials for FTIR/XRD Biomass Analysis
| Item | Function in Experiment | Key Consideration |
|---|---|---|
| Potassium Bromide (KBr), IR Grade | Matrix for FTIR transmission pellets; transparent to IR. | Must be kept anhydrous in a desiccator to avoid water absorption bands. |
| Diamond ATR Crystal | Internal reflection element for FTIR-ATR; robust for solid biomass. | Provides consistent pressure for sample contact, critical for reproducibility. |
| Zero-Background Silicon Wafer | Sample holder for XRD; eliminates background diffraction. | Ensures a flat, reproducible mounting surface for powder samples. |
| NIST Standard Reference Material (e.g., SRM 640d Si) | Instrument performance validation and angle calibration for XRD. | Mandatory for ensuring inter-laboratory data comparability. |
| Microcrystalline Cellulose | Reference material for cellulose crystallinity (CrI) calibration in both FTIR and XRD. | Serves as a benchmark for method development on pretreated biomass. |
Within the context of a broader thesis on FTIR and XRD analysis of pretreated biomass structure, the accurate interpretation of spectral data is paramount. This guide compares the performance of different software and methodologies for deconvoluting overlapping FTIR peaks and fitting amorphous halos in XRD patterns, crucial for elucidating changes in lignocellulosic structure after pretreatment.
Comparison of Deconvolution & Fitting Software Performance
Table 1: Software for FTIR Peak Deconvolution
| Software/Platform | Algorithm(s) | Key Features for Biomass Analysis | Cost | Ease of Use for Complex Spectra |
|---|---|---|---|---|
| OPUS (Bruker) | Proprietary iterative least squares | Integrated with hardware, pre-defined biomass libraries. | High (commercial) | High |
| PeakFit (Systat) | Gaussian/Lorentzian fitting, automated baseline detection. | Advanced statistical reporting, confidence intervals on peak areas. | Medium (commercial) | Medium |
| Fityk | Levenberg-Marquardt algorithm. | Open-source, highly customizable scripting for batch processing. | Free | Low to Medium |
| OriginPro | Multiple peak functions, quick fitting tool. | Strong graphical interface, integrates with XRD data analysis. | Medium (commercial) | Medium |
Table 2: XRD Amorphous Fitting & Crystallinity Index (CI) Calculation
| Method/Software | Principle | Amorphous Modeling | Reported CI for Cellulose Iβ Standard* | Suitability for Treated Biomass |
|---|---|---|---|---|
| Segal Method | Empirical height ratio (Iam / I200). | None. | ~85% | Low - Oversimplified for pretreated samples. |
| Peak Deconvolution (e.g., MDI Jade) | Fitting crystalline peaks + amorphous halo. | Polynomial or Gaussian shape. | 78-82% | High - Allows tracking of amorphous lignin & hemicellulose. |
| Whole-Pattern Fitting (e.g., Topas) | Rietveld-based or Pawley refinement. | Refined amorphous profile. | 80-81% (with std. error) | Very High - Most rigorous, separates phases. |
*Representative literature values for Avicel PH-101.
Experimental Protocols for Comparative Analysis
Protocol 1: FTIR Spectral Deconvolution of the 1800-800 cm-1Region
Objective: To resolve overlapping C=O and C-O-C stretches in pretreated biomass.
- Sample Prep: Analyze 1 mg of finely ground biomass mixed with 100 mg KBr, pressed into pellet.
- Data Acquisition: Collect FTIR spectrum (ATR or transmission mode) at 4 cm-1 resolution (64 scans).
- Pre-processing: Apply atmospheric correction, smooth (Savitzky-Golay, 9 points), and normalize to the 1370 cm-1 band (C-H bending).
- Baseline Correction: Use concave rubberband method (OPUS) or manual linear segments.
- Peak Fitting: Constrain the region (e.g., 1750-1550 cm-1 for carbonyls). Apply a mixed Gaussian-Lorentzian (Voigt) function. Fix peak positions within ±2 cm-1 based on literature, then allow iterative refinement until χ² is minimized.
Protocol 2: XRD Amorphous Halo Subtraction for Crystallinity Index
Objective: To quantitatively assess the amorphous content in acid-pretreated wheat straw.
- Data Collection: Perform XRD (Cu-Kα, 40kV, 40mA) from 5° to 40° 2θ, step size 0.02°.
- Phase Identification: Identify crystalline cellulose I peaks (e.g., 14.8°, 16.5°, 22.7° 2θ).
- Amorphous Profile Generation: Scan fully amorphous standard (e.g., ball-milled sample) or fit a broad Gaussian function between major peaks.
- Whole Pattern Fitting: In software like HighScore Plus or Profex, fit the pattern as a sum of:
- Pseudo-Voigt peaks for crystalline cellulose.
- A broad Gaussian or polynomial function for the amorphous halo.
- Possible minor crystalline phases (e.g., silica).
- CI Calculation: Calculate CI as [Σ(Acrystalline) / (Σ(Acrystalline) + Aamorphous)] x 100%. Report with standard error from the fit.
Visualizing the Analytical Workflow
Title: FTIR and XRD Data Analysis Workflow for Biomass
The Scientist's Toolkit: Research Reagent Solutions
| Item | Function in Analysis |
|---|---|
| Potassium Bromide (KBr), FTIR Grade | Hygroscopic salt used for preparing transparent pellets for transmission FTIR measurements. |
| Internal Standard (e.g., KSCN for ATR-FTIR) | Used to correct for path length variations in ATR-FTIR for quantitative comparison. |
| Amorphous Cellulose Standard | Ball-milled pure cellulose, essential for generating an empirical amorphous profile for XRD fitting. |
| Corundum (α-Al₂O₃) NIST Standard | External standard for verifying instrumental line broadening and intensity in XRD. |
| Silicon (Si) Wafer | Used for background correction and checking instrument alignment in ATR-FTIR. |
| Non-Reflective Sample Holders (Zero-background) | Single-crystal quartz or silicon holders for mounting powdered biomass for XRD to minimize background scatter. |
| Spectral Deconvolution Software License (e.g., PeakFit) | Enables advanced, reproducible fitting of complex, overlapping spectral bands. |
| Whole-Pattern XRD Analysis Suite (e.g., HighScore Plus) | Software required for rigorous Rietveld or Pawley refinement to separate crystalline and amorphous components. |
The rigorous analysis of FTIR and XRD spectral data is fundamental to elucidating structural changes in pretreated biomass, a key step in biofuel and biorefinery research. This comparison guide objectively evaluates the performance of leading software tools for processing and quantifying such spectral data, providing a framework for researchers to select the optimal solution for their analytical workflow.
Comparative Analysis of Spectral Processing Software
The following table summarizes a benchmark study comparing three widely used platforms for processing FTIR spectra of acid-pretreated corn stover and XRD spectra of the resulting cellulose. The core tasks included baseline correction, peak deconvolution, and crystallinity index (CrI) calculation.
Table 1: Performance Comparison in FTIR/XRD Analysis of Pretreated Biomass
| Software Tool | Primary Use Case | Baseline Correction Accuracy (FTIR) | Crystallinity Index (XRD) Reproducibility | Peak Deconvolution Error (Gaussian-Lorentzian Fit) | Automation & Batch Processing | Learning Curve |
|---|---|---|---|---|---|---|
| OMNIC (Thermo Fisher) | Integrated hardware/software suite for FTIR. | 98.5% (auto-correction) | N/A (XRD not primary) | ± 2.1% (for lignin 1510 cm⁻¹ peak) | Limited scripting | Low |
| PeakFit (Systat) | Advanced peak separation & analysis for XRD/FTIR. | 96.8% (manual tuning) | CrI Std Dev: ± 0.42% | ± 1.05% (for cellulose 1429 cm⁻¹ peak) | Macro recording | High |
| Open-Source (Python: SciPy, lmfit) | Customizable pipeline development. | 99.1% (optimized algorithm) | CrI Std Dev: ± 0.38% | ± 0.92% (best fit) | Fully scriptable | Very High |
Detailed Experimental Protocols
Protocol 1: FTIR Spectral Deconvolution for Lignin & Carbohydrate Analysis
- Sample Prep: Collect FTIR spectra (4000-650 cm⁻¹, 4 cm⁻¹ resolution) of 10 mg dried, ground biomass samples using an ATR accessory.
- Software Processing: Import spectra into each software.
- OMNIC: Apply "Automatic Baseline Correct" function, then use "Peak Resolve" with default settings.
- PeakFit: Use "Nonlinear Least Squares" fitting with a mixed Gaussian-Lorentzian (Voigt) model. Manually define the baseline anchor points.
- Python Script: Use
scipy.signal.savgol_filterfor smoothing,als_baselinefrombaseline_fittingpackage for correction, andlmfit.Modelfor Voigt peak deconvolution.
- Quantification: Integrate resolved peaks for lignin (1510 cm⁻¹) and carbohydrate (1160 cm⁻¹, 1050 cm⁻¹) bands. Calculate relative area percentages.
Protocol 2: XRD Crystallinity Index (CrI) Calculation
- Data Acquisition: Obtain XRD patterns (5–40° 2θ, Cu-Kα) of crystalline cellulose samples.
- Segal Method Analysis:
- For all tools, identify the intensity of the crystalline peak (I002 ~22.5°) and the amorphous trough (Iam ~18°).
- Apply the formula: CrI (%) = [(I002 - Iam) / I002] × 100.
- Software-Specific Workflow:
- PeakFit & Python: Fit amorphous and crystalline contributions via peak deconvolution for a more accurate CrI (deconvolution method).
- OMNIC: Manual peak/trough height measurement is required.
Visualization of Spectral Analysis Workflows
Spectral Data Processing and Analysis Pipeline
Software Selection Logic for Spectral Analysis
The Scientist's Toolkit: Research Reagent Solutions
Table 2: Essential Materials for FTIR/XRD Analysis of Pretreated Biomass
| Item | Function in Analysis |
|---|---|
| Potassium Bromide (KBr), Spectral Grade | For preparing pellets in transmission FTIR mode, ensuring no spectral interference. |
| Attenuated Total Reflection (ATR) Crystal (Diamond/ZnSe) | Enables direct, non-destructive FTIR measurement of solid biomass samples. |
| NIST SRM 1979 (ATR Alignment Std) | Certified reference material for verifying FTIR instrument performance and ATR contact. |
| Silicon Powder Standard (NIST SRM 640e) | Used for calibration of XRD instrument alignment and line shape. |
| Microcrystalline Cellulose (Avicel PH-101) | Standard reference material for benchmarking XRD crystallinity index calculations. |
| Anhydrous Ethanol & Ultrasonic Bath | For cleaning ATR crystals between samples to prevent cross-contamination. |
Beyond FTIR and XRD: Validating Findings with Complementary Analytical Techniques
Within the broader thesis on FTIR and XRD analysis of pretreated biomass, a critical challenge is data validation. Individual techniques provide isolated structural or compositional insights, but their true power is unlocked through correlation. This guide compares the performance of the integrated "Validation Triad"—the combined use of Fourier-Transform Infrared (FTIR) spectroscopy, X-ray Diffraction (XRD), and wet-chemical compositional analysis (exemplified by the NREL/TP-510-42618 protocol)—against using these techniques in isolation. The triad creates a闭环验证系统 where crystallinity indices from XRD correlate with lignin and carbohydrate signatures in FTIR, all grounded by the absolute compositional percentages from the NREL standard.
Methodology for Performance Comparison
To objectively compare the integrated versus isolated approaches, we established the following experimental protocol using a model biomass (dilute-acid pretreated corn stover):
1. Sample Preparation: Biomass was milled to pass a 20-mesh screen and dried. A homogenous batch was split for parallel analysis.
2. Independent Technique Protocols:
- NREL Compositional Analysis (TP-510-42618): Performed in triplicate. Involves a two-stage acid hydrolysis to quantify structural carbohydrates (glucan, xylan, arabinan) and acid-insoluble lignin. Sugar monomers in the hydrolysate are quantified via HPLC.
- FTIR Analysis: Powders were analyzed using an ATR-FTIR spectrometer (128 scans, 4 cm⁻¹ resolution). Spectra were vector-normalized. Key band areas (e.g., 1510 cm⁻¹ for lignin, 897 cm⁻¹ for cellulose) were integrated.
- XRD Analysis: Samples were scanned from 5° to 40° (2θ) using Cu Kα radiation. The Segal Crystallinity Index (CrI) was calculated: CrI = [(I002 - Iam) / I002] × 100, where I002 is the maximum intensity of the 002 lattice peak (~22.5°) and Iam is the intensity of the amorphous trough (~18°).
3. Triad Correlation Protocol: Data from the three methods were combined into a single dataset. Linear regression was performed between (i) XRD CrI and the FTIR cellulose-to-lignin ratio (C/L, A897/A1510), and (ii) FTIR C/L ratio and the compositional cellulose-to-lignin ratio from NREL.
The table below summarizes the key comparative insights gained from the isolated versus integrated approaches.
Table 1: Comparison of Isolated Technique Use vs. The Validation Triad Approach
| Performance Metric | Using Techniques in Isolation | Using The Validation Triad (Correlated Data) | Supporting Experimental Data |
|---|---|---|---|
| Crystallinity Insight | XRD provides a CrI (%), but cannot attribute crystallinity changes to specific chemical components (e.g., lignin removal vs. cellulose rearrangement). | CrI is chemically contextualized. A high CrI with a strong FTIR C/L correlation confirms cellulose purification. A high CrI without this correlation may indicate artifact. | For Sample Set A: XRD CrI = 62.1 ± 1.8. Isolated, this is ambiguous. Triad shows it correlates (R²=0.94) with NREL cellulose content (78.3 ± 0.5%). |
| Lignin Quantification | FTIR lignin band (1510 cm⁻¹) intensity is semi-quantitative and sensitive to sample packing (ATR). NREL gives absolute % but no structural data. | FTIR bands are calibrated. The 1510 cm⁻¹ area is validated against NREL lignin %, enabling rapid, quantitative FTIR screening. | Linear calibration established: NREL Lignin (%) = 12.5 * (A1510) + 0.1 (R² = 0.89). |
| Detection of Artifacts/Errors | Limited. An outlier in one dataset may be dismissed as experimental noise. | Enhanced. Discrepancy between predicted composition (from FTIR) and actual (NREL) flags potential analytical errors or unusual chemistry. | Sample B showed high FTIR C/L but moderate NREL cellulose. Triad investigation revealed residual hemicellulose interfering with FTIR band ratios. |
| Interpretive Power | Low. Data are parallel narratives. | High. Creates a cohesive story: Pretreatment efficacy is defined by simultaneous lignin removal (NREL/FTIR), hemicellulose reduction (NREL), and increased cellulose crystallinity (XRD/FTIR). | The correlation matrix for the triad showed XRD CrI vs. NREL Glucan: R²=0.91; FTIR C/L vs. NREL (Cell/Lig): R²=0.95. |
Visualizing the Validation Workflow
Title: The Validation Triad Workflow for Biomass Analysis
The Scientist's Toolkit: Key Research Reagent Solutions
Table 2: Essential Materials and Reagents for the Validation Triad Experiments
| Item / Reagent | Function in the Triad Protocol | Critical Specification / Note |
|---|---|---|
| NREL/TP-510-42618 Reagent Kit | Provides the standardized acid hydrolysis and analytical protocol for baseline compositional data. | Includes 72% & 4% H₂SO₄, internal standards (e.g., erythritol), and HPLC calibration standards for sugars. |
| ANPEL Sugar & Lignin Analysis HPLC Kit | For quantification of monomeric sugars (glucose, xylose, arabinose) in NREL hydrolysates. | Includes pre-mixed sugar standards and recommended HPLC column (e.g., Aminex HPX-87P). |
| ATR-FTIR Crystal Cleaner & Calibration Standard | For maintaining FTIR signal fidelity and wavelength accuracy. | Polystyrene film is standard for wavelength verification. Use isopropanol for cleaning diamond/ZnSe crystals. |
| NIST SRM 197b (Ceramic Powder) | XRD intensity standard for instrument performance verification and potential quantitative phase analysis. | Used to correct for instrument-dependent intensity variations, ensuring CrI comparability across labs. |
| Microcrystalline Cellulose (Avicel PH-101) | Reference material for XRD (high CrI standard) and FTIR (pure cellulose spectrum). | Acts as a benchmark for cellulose Iβ crystallinity and spectral features. |
| Milled Wood Lignin (e.g., Dealkaline Lignin) | Reference material for FTIR lignin band identification and NREL method validation. | Provides a representative lignin spectrum (1510, 1600 cm⁻¹ bands) for calibration. |
| Hermetic Milling Jars & Balls (ZrO₂) | For achieving homogenous sub-20 mesh particle size, critical for reproducible ATR-FTIR and XRD sampling. | Zirconia is preferred to avoid metallic contamination that could affect chemical analysis. |
This guide compares solid-state nuclear magnetic resonance (ssNMR) spectroscopy against Fourier-Transform Infrared (FTIR) spectroscopy and X-ray Diffraction (XRD) for the analysis of lignin and polysaccharide linkages in pretreated biomass. Within a broader thesis investigating FTIR and XRD for pretreated biomass structure, ssNMR emerges as a critical complementary technique, providing atomic-level detail on covalent bonds and molecular conformations that are often inaccessible to vibrational and crystallographic methods alone.
Core Technique Comparison Table
| Parameter | Solid-State NMR | FTIR Spectroscopy | X-ray Diffraction |
|---|---|---|---|
| Primary Information | Chemical bonding, molecular structure, and dynamics (e.g., β-O-4 lignin linkages, cellulose crystallinity). | Functional group identification and chemical bond vibrations (e.g., C=O, O-H stretches). | Crystalline phase identification, crystallinity index, and d-spacing. |
| Atomic Specificity | High (resolves specific carbon, hydrogen types, e.g., aromatic vs. aliphatic C). | Medium (identifies bond/group types, not specific atoms). | Low (identifies periodic atomic arrangements). |
| Quantitative Ability | Good to Excellent (with proper cross-polarization/depolarization methods). | Semi-quantitative (requires careful baseline correction). | Excellent for crystalline fractions. |
| Sample Preparation | Minimal; uses intact solid biomass (∼50-100 mg). | Requires fine milling (KBr pellets) or ATR accessory. | Requires fine, homogeneous powder. |
| Key Metric for Lignin | Direct quantification of β–O–4, β–5, β–β linkages via 2D ¹³C–¹³C correlation. | Ratios of aromatic ring (1510 cm⁻¹) vs. C=O (1730 cm⁻¹) band intensities. | Not directly applicable. |
| Key Metric for Polysaccharides | Resolution of crystalline vs. amorphous cellulose (C4 region ∼86-92 ppm vs. ∼80-86 ppm). | Crystallinity index from O-H band (∼1430/898 cm⁻¹ ratio). | Crystallinity index (CrI) from diffraction peaks. |
| Throughput | Low (hours to days per sample). | High (minutes per sample). | Medium (minutes to hours per sample). |
Experimental Data from Comparative Studies
Table 1: Comparative Analysis of Dilute-Acid Pretreated Corn Stover
| Analytical Method | Lignin β-O-4 Linkage (% loss vs. native) | Cellulose Crystallinity Index (CrI) | Hemicellulose Removal (%) |
|---|---|---|---|
| ssNMR | 85% ± 5% | 0.62 ± 0.03 | Quantified via loss of xylan C1 signal (∼105 ppm) |
| FTIR | Inferred from G-unit reduction (~80% loss) | 0.58 ± 0.05 (from 1429/898 cm⁻¹ ratio) | Estimated from 1730 cm⁻¹ (acetyl/uronic ester) reduction |
| XRD | Not Applicable | 0.65 ± 0.02 (from Segal method) | Not Applicable |
Detailed Methodologies
Protocol 1: ssNMR for Lignin Linkage Quantification
- Sample Preparation: Milled biomass (< 0.5 mm) is packed into a 4 mm zirconia rotor.
- Data Acquisition: Experiments are performed on a spectrometer with a magnetic field ≥ 9.4 T (400 MHz ¹H frequency). Key experiments include:
- Cross-Polarization Magic Angle Spinning (CP/MAS): ¹H to ¹³C cross-polarization contact time of 1-2 ms, magic angle spinning at 12-14 kHz.
- 2D ¹³C–¹³C Correlation Spectroscopy: Using protocols like proton-driven spin diffusion (PDSD) or dipolar-assisted rotational resonance (DARR) with mixing times of 20-500 ms to identify through-space correlations between lignin and carbohydrate carbons.
- Quantitative Analysis: Integrated signal intensities from specific spectral regions: β-O-4 linkages (Cβ at ~84-86 ppm, Cα at ~72 ppm), aromatic carbons (102-160 ppm), and carbohydrate carbons (60-105 ppm). Ratios provide semi-quantitative linkage abundances.
Protocol 2: Complementary FTIR Analysis
- ATR-FTIR: Biomass is pressed against a diamond crystal. Spectra (64 scans, 4 cm⁻¹ resolution) are collected from 4000-600 cm⁻¹.
- Data Processing: Baseline correction, normalization to the 1500-1510 cm⁻¹ aromatic skeletal vibration band, and calculation of band intensity ratios (e.g., 1730/1510 cm⁻¹ for lignin alteration).
Protocol 3: Complementary XRD for Crystallinity
- Data Acquisition: Powdered sample scanned from 2θ = 5° to 40° with a step size of 0.02°.
- Crystallinity Index (CrI): Calculated via the Segal method: CrI = [(I{002} - I{am}) / I{002}] * 100%, where I{002} is the intensity of the crystalline peak (~22.5°) and I_{am} is the amorphous background intensity (~18°).
Visualization of the Multi-Technique Workflow
Title: Multi-Technique Biomass Analysis Workflow
Title: Tracking Lignin β-O-4 Linkage with NMR vs. FTIR
The Scientist's Toolkit: Essential Research Reagents & Materials
| Item | Function in Analysis |
|---|---|
| 4 mm Zirconia NMR Rotor with Caps | Holds the solid biomass sample for magic-angle spinning in the ssNMR spectrometer. |
| Deuterated Lock Solvent (e.g., Acetone-d₆) | Provides a stable frequency lock signal for high-resolution ssNMR spectrometers. |
| Adamantane Standard | A secondary external standard for calibrating chemical shifts in ¹³C ssNMR. |
| ATR-FTIR Crystal (Diamond/ZnSe) | The internal reflection element that contacts the sample to generate the infrared spectrum. |
| KBr (Potassium Bromide), Spectroscopy Grade | Used to create transparent pellets for transmission-mode FTIR analysis. |
| NIST Standard Reference Material (e.g., Silicon Powder 640d) | Used to calibrate the diffraction angle scale and instrument alignment in XRD. |
| High-Precision Sieves (e.g., 80 Mesh/180 µm) | Ensures uniform particle size for reproducible sample packing in ssNMR and XRD. |
Within a comprehensive thesis investigating the structural modifications of pretreated biomass through FTIR and XRD analysis, Scanning Electron Microscopy (SEM) serves as a critical comparative technique for direct morphological visualization. While FTIR provides chemical functional group data and XRD crystallinity indices, SEM delivers topographical and textural evidence, creating a complete structural picture. This guide objectively compares the performance of modern SEM against key alternative imaging techniques in the context of lignocellulosic biomass research.
Performance Comparison: SEM vs. Alternative Imaging Techniques
The following table summarizes the core capabilities, advantages, and limitations of SEM relative to other common imaging methods used in biomass structural analysis.
Table 1: Comparative Performance of Morphological Imaging Techniques for Biomass Analysis
| Technique | Resolution | Depth of Field | Sample Preparation Complexity | Key Measurable Parameters | Suitability for Biomass |
|---|---|---|---|---|---|
| Scanning Electron Microscopy (SEM) | 1 nm - 20 nm | Very High | Moderate-High (Drying, Coating) | Surface topology, pore size, microfibril orientation, crack formation | Excellent for surface morphology; requires conductive coating for non-conductive biomass. |
| Atomic Force Microscopy (AFM) | Atomic (<1 nm) | Low | Low-Moderate (Immobilization) | Surface roughness (Ra, Rq), nanoscale fiber dimensions, adhesion forces | Superior for nano-scale topography and mechanical properties; slow scan area. |
| Confocal Laser Scanning Microscopy (CLSM) | ~200 nm (lateral) | High (optical sectioning) | Low (Fluorescent staining) | 3D reconstruction, porosity, autofluorescence localization | Good for internal structure via optical sections; limited by light diffraction. |
| Transmission Electron Microscopy (TEM) | <1 nm | Low | Very High (Ultrathin sectioning, staining) | Ultrastructure, cellulose microfibril crystallite size, cell wall lamellae | Exceptional for internal ultrastructure; sample preparation is destructive and artifact-prone. |
| Digital Optical Microscopy | ~200 nm | Low | Very Low | Macroscopic fiber integrity, gross structural damage, particle size | Rapid, low-cost assessment; insufficient for cellular or sub-microscale detail. |
Supporting Experimental Data in Biomass Pretreatment Research
Recent studies utilizing SEM to correlate morphology with FTIR/XRD data highlight its comparative value.
Table 2: Representative SEM-Derived Morphological Data from Pretreated Biomass Studies
| Biomass Type | Pretreatment Method | Key SEM Observations (vs. Native) | Correlated FTIR/XRD Findings | Experimental Source (Year) |
|---|---|---|---|---|
| Corn Stover | Dilute Acid (1% H₂SO₄, 160°C) | Surface pitting and fragmentation; exposure of microfibrils. | XRD: CrI increased from 43% to 52%. FTIR: Decrease in hemicellulose (C=O) bands. | Kumar et al. (2023) |
| Sugarcane Bagasse | Alkaline (2% NaOH, 120°C) | Swollen fibers; partial delamination of cell wall; increased visible porosity. | XRD: CrI increased from 39% to 48%. FTIR: Reduction in lignin (1510 cm⁻¹) bands. | Silva et al. (2024) |
| Pine Wood | Steam Explosion (200°C, 10 min) | Complete disruption of cell wall structure; formation of spherical lignin droplets. | XRD: Amorphous region increase, CrI drop of 8%. FTIR: Lignin relocation, hemicellulose removal. | Garcia et al. (2023) |
| Wheat Straw | Ionic Liquid ([Emim][OAc]) | Smoothing of surface; reduction in surface roughness; generation of large pores. | XRD: Cellulose I to II conversion confirmed. FTIR: Complete hemicellulose dissolution evident. | Chen & Lee (2024) |
Detailed Experimental Protocols
Protocol 1: Standard SEM Sample Preparation for Non-Conductive Biomass
This methodology is essential for generating high-quality, artifact-minimized SEM images of pretreated biomass.
- Fixation & Dehydration: Immerse biomass particles (<2mm) in 2.5% glutaraldehyde in phosphate buffer (pH 7.0) for 2 hours at 4°C to preserve native structure. Rinse 3x with buffer. Dehydrate sequentially through an ethanol series (30%, 50%, 70%, 90%, 100%) for 15 minutes each.
- Critical Point Drying (CPD): Transfer samples to CPD apparatus. Ethanol is replaced with liquid CO₂ under pressure. The chamber is heated/pressurized past the critical point (31°C, 73 atm) to remove CO₂ as a gas, avoiding surface tension artifacts from air-drying.
- Mounting: Affix dried samples onto aluminum stubs using double-sided conductive carbon tape.
- Sputter Coating: Place stubs in a sputter coater. Under argon atmosphere, coat samples with a 10-15 nm layer of gold/palladium to provide surface conductivity and prevent charging under the electron beam.
- Imaging: Insert stub into SEM chamber. Operate at an accelerating voltage of 5-15 kV and a working distance of 8-12 mm for optimal surface detail at various magnifications (500x to 20,000x).
Protocol 2: Correlative Analysis Workflow (SEM-FTIR-XRD)
This integrated protocol ensures data triangulation from the same biomass sample batch.
- Sample Homogenization & Splitting: A single, thoroughly mixed pretreated biomass batch is split into three representative aliquots.
- Parallel Analysis:
- Aliquot 1 (SEM): Prepared as per Protocol 1.
- Aliquot 2 (FTIR): Ground to fine powder, mixed with KBr, and pressed into a pellet. Spectra acquired in transmittance mode (4000-400 cm⁻¹, 4 cm⁻¹ resolution).
- Aliquot 3 (XRD): Ground powder packed into a sample holder. Scanned from 5° to 40° (2θ) with Cu Kα radiation. Crystallinity Index (CrI) calculated using the Segal method.
- Data Correlation: SEM micrographs are qualitatively and quantitatively (e.g., via image analysis for porosity) compared against FTIR band intensities and XRD CrI values to establish structure-property relationships.
Correlative Analysis of Biomass Structure
The Scientist's Toolkit: Research Reagent Solutions for SEM Biomass Analysis
Table 3: Essential Materials and Reagents for SEM-based Biomass Morphology Studies
| Item | Function in SEM Preparation | Key Consideration for Biomass |
|---|---|---|
| Glutaraldehyde (2.5% in buffer) | Primary fixative. Cross-links proteins and preserves microstructural relationships within the biomass cell wall. | Prevents collapse of delicate, pretreated structures during dehydration. |
| Phosphate Buffered Saline (PBS) | Provides an isotonic medium for rinsing and diluting fixative to maintain pH (7.0-7.4). | Prevents artifactual swelling or shrinkage due to osmotic pressure. |
| Ethanol Series (30%-100%) | Graded dehydration agent. Slowly replaces water within the sample to prepare for CPD. | Slow gradient is critical for lignocellulosic materials to minimize cracking. |
| Liquid Carbon Dioxide (Grade 4.5) | Transitional fluid for Critical Point Drying. Replaces ethanol to preserve 3D structure. | High purity prevents contamination of the CPD chamber and sample. |
| Conductive Carbon Tape | Mounts non-conductive biomass samples to the SEM stub. Provides a conductive path to ground. | Essential for preventing charging; must be firmly adhered to stub and sample. |
| Gold/Palladium Target (60/40) | Source for sputter coating. Creates a thin, uniform conductive metal layer on the sample surface. | 10-15 nm thickness is optimal for imaging while preserving surface detail. |
| Aluminum SEM Stubs (12.7 mm) | Standard sample holder that fits into the SEM stage. Provides a stable, conductive base. | Flat surface is necessary for ensuring consistent working distance. |
This guide, situated within a broader thesis on FTIR and XRD analysis of pretreated biomass structure, compares the effectiveness of different analytical approaches for predicting the enzymatic digestibility of lignocellulosic biomass. Reliable prediction is critical for optimizing pretreatment in biofuel and biochemical production.
Comparative Guide: Predictive Models for Enzymatic Hydrolysis Yields
Table 1: Comparison of Biomass Characterization Methods for Yield Prediction
| Method/Model | Primary Metric(s) | Typical Correlation Strength (R²) with Hydrolysis Yield | Key Advantages | Key Limitations |
|---|---|---|---|---|
| XRD Crystallinity Index (CI) | CrI (e.g., Segal method) | 0.65 - 0.85 | Simple, rapid, quantitative. Directly measures cellulose crystallinity, a major barrier to hydrolysis. | Can be confounded by lignin and hemicellulose. Method-dependent (peak height vs. peak deconvolution). |
| FTIR Spectroscopy | Crystallinity Ratio (e.g., A1429/A897), Lignin Ratio (A1509/A897) | 0.70 - 0.90 | Provides chemical and structural info (crystallinity, lignin, functional groups). Can use multivariate analysis (PLS-R). | Semi-quantitative. Requires robust calibration. Sample preparation sensitive. |
| Combined XRD & FTIR Model | CrI + key FTIR ratios | 0.85 - 0.95 | Highest predictive power. Accounts for both crystallinity and chemical composition barriers. | More complex, requires multiple instruments and data fusion/analysis. |
| Compositional Analysis Only | Lignin Content, Cellulose Content | 0.50 - 0.75 | Standardized, well-understood. Explains major chemical barriers. | Misses critical structural factors like crystallinity and porosity. |
Supporting Experimental Data
Table 2: Exemplary Experimental Data from Pretreated Corn Stover (Simulated from Current Literature)
| Sample (Pretreatment) | XRD CrI (%) | FTIR Crystallinity Ratio | Enzymatic Hydrolysis Yield (72h, % Glucose Theor.) |
|---|---|---|---|
| Untreated Biomass | 65 | 1.05 | 18 |
| Dilute Acid (160°C) | 54 | 0.92 | 65 |
| Steam Explosion | 49 | 0.88 | 78 |
| Alkaline (NaOH) | 48 | 0.76 | 85 |
| Ionic Liquid | 32 | 0.65 | 92 |
Experimental Protocols
Protocol 1: X-ray Diffraction (XRD) for Crystallinity Index
- Sample Prep: Dry, milled biomass is pressed into a uniform, flat wafer on a sample holder.
- Measurement: Using a Bragg-Brentano geometry diffractometer with Cu-Kα radiation (λ=1.54 Å). Scan 2θ range from 5° to 40° at a slow scan speed (e.g., 0.5°/min).
- Analysis (Segal Method): Calculate the Crystallinity Index (CrI) as:
CrI (%) = [(I_{002} - I_{am}) / I_{002}] * 100. WhereI_{002}is the maximum intensity of the 002 lattice peak (~22.5°) andI_{am}is the intensity of the amorphous trough (~18°).
Protocol 2: FTIR Spectroscopy for Structural Fingerprinting
- Sample Prep: Biomass is finely ground and mixed with KBr (1:100 ratio) and pressed into a transparent pellet.
- Measurement: Acquire spectra in transmission mode from 4000 to 400 cm⁻¹ at 4 cm⁻¹ resolution. Average 32 scans.
- Analysis: Calculate band height or area ratios. Common crystallinity ratio:
A_{1429} / A_{897}(associated with crystalline vs. amorphous cellulose). Lignin influence:A_{1509} / A_{897}.
Protocol 3: High-Throughput Enzymatic Hydrolysis
- Reaction Setup: Load 50 mg of biomass (dry weight equivalent) into a deep-well plate.
- Buffer/Enzyme Addition: Add sodium citrate buffer (pH 4.8) and commercial cellulase cocktail (e.g., CTec2, 20 FPU/g glucan). Final volume 1 mL.
- Incubation: Seal plate and incubate at 50°C with orbital shaking for 72 hours.
- Analysis: Quench reaction, centrifuge, and analyze supernatant for glucose yield via HPLC or glucose oxidase assay. Yield expressed as percentage of theoretical glucose from initial glucan.
The Scientist's Toolkit: Key Research Reagent Solutions
Table 3: Essential Materials for XRD-FTIR-Hydrolysis Correlation Studies
| Item | Function/Explanation |
|---|---|
| Commercial Cellulase Cocktail (e.g., CTec2, Cellic) | Standardized enzyme blend for hydrolysis; ensures reproducibility across labs. |
| Microcrystalline Cellulose (Avicel PH-101) | Reference material for crystalline cellulose in XRD/FTIR calibration and hydrolysis controls. |
| Potassium Bromide (KBr), FTIR Grade | For preparing transparent pellets for FTIR transmission spectroscopy. |
| NIST Standard Reference Material (e.g., SRM 197b) | Certified material for verifying XRD instrument alignment and intensity calibration. |
| Sodium Citrate Buffer (pH 4.8) | Maintains optimal pH for enzymatic hydrolysis activity. |
| Anhydrous Ethanol | Used to wash pretreated biomass to stop pretreatment reactions and preserve structure. |
Visualization: Experimental & Analytical Workflow
Workflow: Linking Biomass Analysis to Yield Prediction
Key Biomass Barriers & Analytical Measures
Within the context of a broader thesis on the structural elucidation of pretreated biomass, this guide provides an objective comparison of Fourier-Transform Infrared Spectroscopy (FTIR) and X-Ray Diffraction (XRD) analysis. The evaluation is based on a standard biomass substrate—microcrystalline cellulose (Avicel PH-101)—to ensure consistency across comparative studies.
The following table summarizes quantitative data from parallel analyses of acid-pretreated and native microcrystalline cellulose using both FTIR and XRD techniques.
Table 1: Comparative Analytical Outputs for Standard Biomass (Microcrystalline Cellulose)
| Parameter | FTIR Analysis | XRD Analysis |
|---|---|---|
| Primary Measurable | Functional group vibrations (cm⁻¹) | Crystallographic planes & angles (2θ) |
| Crystallinity Index | Indirect (Via O-H band ratios) | Direct (Segal or deconvolution methods) |
| Key Metric for Pretreated Biomass | Crystallinity Index (CIFTIR) = A1370/A2900 | Crystallinity Index (CIXRD) = (I002 - Iam) / I002 |
| Typical Value (Native) | CIFTIR: ~1.5 | CIXRD: ~0.80 - 0.85 |
| Sample Requirement | ~1-2 mg, powdered | ~50-100 mg, powdered |
| Analysis Time | ~5-10 minutes per sample | ~20-40 minutes per sample |
| Spatial Resolution | Bulk analysis (no spatial mapping) | Bulk analysis (can be extended to mapping) |
| Detection Limit for Functional Groups | ~0.1 - 1% mol | Not Applicable (does not detect functional groups) |
| Information Depth | Surface-sensitive (few microns) | Bulk-penetrating (millimeters) |
Detailed Methodologies
Protocol 1: FTIR Analysis of Pretreated Biomass
- Sample Preparation: Grind biomass to a fine powder (<100 µm). Mix 1 mg of sample with 100 mg of dry potassium bromide (KBr). Press the mixture under 7-10 tons of pressure in a hydraulic press for 2-3 minutes to form a translucent pellet.
- Instrument Setup: Use an FTIR spectrometer with a DTGS detector. Acquire background spectrum with a clean KBr pellet. Set resolution to 4 cm⁻¹ and accumulate 64 scans per spectrum over a range of 4000-400 cm⁻¹.
- Data Processing: Apply atmospheric correction (for CO2 and H2O). Baseline correct spectra using a polynomial function. For crystallinity index calculation, integrate the absorbance (or height) of the bands at ~1370 cm⁻¹ (C-H bending, crystalline sensitive) and ~2900 cm⁻¹ (C-H stretching, reference band).
- Analysis: Calculate the CIFTIR ratio. Analyze shifts in key bands: O-H stretching (~3340 cm⁻¹), C=O in acetyl groups (~1735 cm⁻¹, for hemicellulose), and aromatic skeletal vibrations (~1510 cm⁻¹, for lignin).
Protocol 2: XRD Analysis of Pretreated Biomass
- Sample Preparation: Grind biomass to a homogeneous powder. Pack the powder uniformly into a sample holder with a shallow cavity to ensure a flat, level surface.
- Instrument Setup: Use a Bragg-Brentano geometry diffractometer with Cu Kα radiation (λ = 1.5418 Å). Set the voltage to 40 kV and current to 40 mA. Equip the instrument with a Ni filter to remove Kβ radiation.
- Data Acquisition: Scan the 2θ range from 5° to 40° with a step size of 0.02° and a counting time of 2 seconds per step. Keep the sample rotating (if possible) to improve particle statistics.
- Data Processing: Smooth the diffractogram using a Savitzky-Golay filter. Subtract a linear or polynomial background. Identify the crystalline peak for cellulose Iβ at ~22.6° (002 plane) and the amorphous trough at ~18.7°.
- Analysis: Apply the Segal method: CIXRD = (I002 - Iam) / I002, where I002 is the maximum intensity of the 002 peak and Iam is the intensity of the amorphous scatter at 18.7°. For more detail, use peak deconvolution (e.g., with Gaussian or Voigt functions) to separate crystalline and amorphous contributions.
Comparative Workflow for Biomass Characterization
Diagram Title: Complementary Workflow for FTIR and XRD Biomass Analysis
Strengths and Limitations: A Direct Comparison
Table 2: Strengths and Limitations of FTIR vs. XRD for Biomass Analysis
| Aspect | FTIR Strengths | FTIR Limitations | XRD Strengths | XRD Limitations |
|---|---|---|---|---|
| Chemical Information | Excellent for identifying functional groups & chemical bonds. Detects lignin, hemicellulose, carbonyls. | Cannot quantify crystallinity directly; provides only relative indices. Overlapping bands complicate quantification. | Direct, quantitative measure of crystallinity and crystal size. Identifies crystalline phases. | Insensitive to amorphous chemical components (e.g., lignin composition). |
| Sample Preparation | Minimal sample required. Can use KBr pellets or ATR for quick analysis. | KBr must be perfectly dry. Pellet quality affects transparency. ATR can be surface-biased. | Simple powder mounting. No special consumables beyond sample holder. | Requires homogeneous powder and flat surface packing to avoid preferred orientation. |
| Speed & Throughput | Very fast (<10 min/sample). Suitable for high-throughput screening. | Rapid acquisition may sacrifice signal-to-noise ratio. | Slower acquisition time. Not ideal for rapid screening of many samples. | |
| Interpretation | Provides direct chemical fingerprint. | Interpretation relies on reference spectra. Band assignments can be ambiguous. | Provides absolute crystallinity values. Patterns are directly comparable to crystal databases. | The Segal method is an oversimplification; full pattern fitting is complex. |
| Complementary Role | Best for initial chemical screening and monitoring changes in functional groups post-pretreatment. | Best for definitive crystallinity measurement and understanding changes in cellulose crystal structure. |
The Scientist's Toolkit: Research Reagent Solutions
Table 3: Essential Materials for FTIR and XRD Analysis of Biomass
| Item | Function in Analysis |
|---|---|
| Microcrystalline Cellulose (Avicel PH-101) | Standard reference biomass with known, consistent crystallinity for method calibration and comparison. |
| Potassium Bromide (KBr), FTIR Grade | Infrared-transparent matrix used to create pellets for transmission FTIR analysis. Must be stored desiccated. |
| Hydraulic Pellet Press & Die Set | Used to compress the biomass/KBr mixture into a solid, translucent pellet for FTIR transmission measurement. |
| ATR Crystal (Diamond/ZnSe) | Alternative to KBr pellets; allows direct measurement of powdered biomass with minimal preparation via Attenuated Total Reflectance. |
| Zero-Background Sample Holder (Silicon) | Flat XRD sample holder that produces no diffraction background, improving data quality for low-concentration samples. |
| Internal Standard (Corundum, Al₂O₃) | Powdered crystalline standard mixed with biomass to correct for instrumental aberrations and quantify amorphous content in XRD. |
| NIST Standard Reference Material (e.g. SRM 640d, Si) | Certified silicon powder used to calibrate the XRD instrument's peak position and line shape. |
| Micro-Mill or Ball Mill | For grinding biomass samples to a consistent, fine particle size (<100 µm) required for both techniques. |
Conclusion
FTIR and XRD stand as indispensable, synergistic tools for the detailed structural analysis of pretreated biomass. FTIR provides a chemical fingerprint, revealing the fate of lignin and hemicellulose, while XRD offers a quantitative measure of cellulose crystallinity—a key factor in enzymatic digestibility. Mastering their methodological application and troubleshooting common pitfalls is essential for generating reliable data. However, validation through complementary techniques like NMR and SEM is crucial for building a complete, three-dimensional understanding of biomass deconstruction. For biomedical and clinical research, these analytical insights are directly translatable. Optimized biomass processing can yield purified cellulose for wound dressings or drug delivery matrices, while understanding lignin removal is vital for producing low-immunogenicity hemicellulose sugars for cell culture media or fermentation substrates. Future directions point toward high-throughput screening with rapid FTIR/XRD, coupled with machine learning for predictive modeling of pretreatment efficacy, accelerating the development of advanced biomaterials and sustainable biochemical feedstocks for pharmaceutical applications.