Biochemical vs. Thermochemical Ethanol Production: NREL's Comparative Analysis for Advanced Biofuel Development
This article provides a comprehensive comparison of biochemical and thermochemical ethanol conversion pathways, based on the latest research from the National Renewable Energy Laboratory (NREL).
Biochemical vs. Thermochemical Ethanol Production: NREL's Comparative Analysis for Advanced Biofuel Development
Abstract
This article provides a comprehensive comparison of biochemical and thermochemical ethanol conversion pathways, based on the latest research from the National Renewable Energy Laboratory (NREL). Targeting researchers and biofuel professionals, it explores the foundational science, methodological applications, common challenges, and comparative validation of these two pivotal biofuel technologies. The analysis synthesizes current data on efficiency, feedstock flexibility, scalability, and economic viability to inform R&D priorities and sustainable fuel development strategies.
Biochemical vs. Thermochemical Ethanol: Core Principles and NREL's Research Mandate
This comparison guide, framed within the broader NREL research thesis comparing biochemical and thermochemical ethanol production, objectively analyzes two distinct technological pathways. It presents performance metrics and experimental data to inform researchers and scientists.
The biochemical route (Enzymatic Hydrolysis & Fermentation, EHF) deconstructs lignocellulosic biomass using biological catalysts, while the thermochemical route (Gasification & Catalytic Synthesis, GCS) converts biomass into syngas followed by catalytic upgrading to ethanol.
Table 1: Comparative Performance Metrics of EHF and GCS Pathways
| Metric | Enzymatic Hydrolysis & Fermentation (EHF) | Gasification & Catalytic Synthesis (GCS) |
|---|---|---|
| Typical Feedstock | Dedicated herbaceous/wood crops (e.g., corn stover, switchgrass). | Broad, including mixed residues, waste wood, municipal solid waste. |
| Primary Operating Conditions | Moderate (30-50°C, ambient pressure). | Severe (700-1500°C, elevated pressure). |
| Theoretical Carbon Yield | High (~75-85% of C6 sugars). | Moderate (~50-65% from syngas to ethanol). |
| Technology Readiness Level (TRL) | High (Commercial-scale plants operating). | Medium (Pilot and demonstration scale). |
| Key Challenge | Recalcitrance of biomass, enzyme cost, inhibitor tolerance. | Syngas cleaning, catalyst selectivity/deactivation, tar management. |
| Co-product Potential | Lignin for power/chemicals. | Power, Fischer-Tropsch fuels, chemicals. |
Table 2: Experimental Yield & Efficiency Data (Representative Studies)
| Pathway | Experimental Ethanol Yield | Catalyst/Agent Used | Condition Summary | Reference Year |
|---|---|---|---|---|
| EHF | 72 gal/ton dry corn stover | CTec3 cellulase cocktail + S. cerevisiae | Pretreatment: Dilute acid, 48hr hydrolysis, 96hr fermentation. | 2022 |
| EHF | 85% of theoretical from glucose | Engineered Z. mobilis | Simultaneous Saccharification & Fermentation (SSF), inhibitor-tolerant strain. | 2023 |
| GCS | 0.18 g ethanol/g dry biomass | Rhodium-based catalyst on SiO2 | Fluidized bed gasifier, syngas conditioning, 300°C, 20 bar. | 2021 |
| GCS | 50% CO conversion to alcohols | K/Cu-Zn-Al multifunctional catalyst | Syngas mimetic (H2/CO/CO2), fixed-bed reactor, 320°C, 70 bar. | 2023 |
Detailed Experimental Protocols
Protocol 1: Enzymatic Hydrolysis & Fermentation (SSF)
Objective: To convert pretreated lignocellulosic biomass to ethanol in a single reactor.
- Biomass Preparation: Milled, dilute-acid pretreated corn stover (20% solids, w/w) is pH-adjusted to 5.0.
- SSF Setup: Biomass slurry is transferred to a bioreactor. Cellulase cocktail (e.g., CTec3, 20 mg protein/g glucan) and hemicellulase are added.
- Inoculation: Pre-cultured, ethanologenic organism (S. cerevisiae D5A or engineered strain) is inoculated at ~5 g/L cell density.
- Process Conditions: Maintained at 35°C, pH 5.0, with gentle agitation for 120-144 hours under anaerobic conditions.
- Analysis: Samples taken periodically for HPLC analysis (sugars, ethanol, inhibitors) and dry cell weight.
Protocol 2: Gasification & Catalytic Synthesis (Bench-Scale)
Objective: To convert biomass-derived syngas to ethanol over a heterogeneous catalyst.
- Feedstock Preparation: Biomass is ground, dried, and fed into a fluidized-bed gasifier.
- Gasification: Gasification occurs at ~850°C with steam/O2, producing raw syngas (H2, CO, CO2).
- Syngas Conditioning: Raw gas is passed through cyclones, scrubbers, and adsorbent beds to remove particulates, tars, and sulfur contaminants.
- Catalytic Synthesis: Cleaned syngas is compressed and fed into a fixed-bed reactor packed with promoted catalyst (e.g., K/Cu-Zn-Al, MoS2, or Rh-based). Conditions: 300-320°C, 50-70 bar.
- Product Recovery: Effluent is cooled to condense liquid products (mixed alcohols, water). Gas and liquid composition analyzed via GC-FID/TCD.
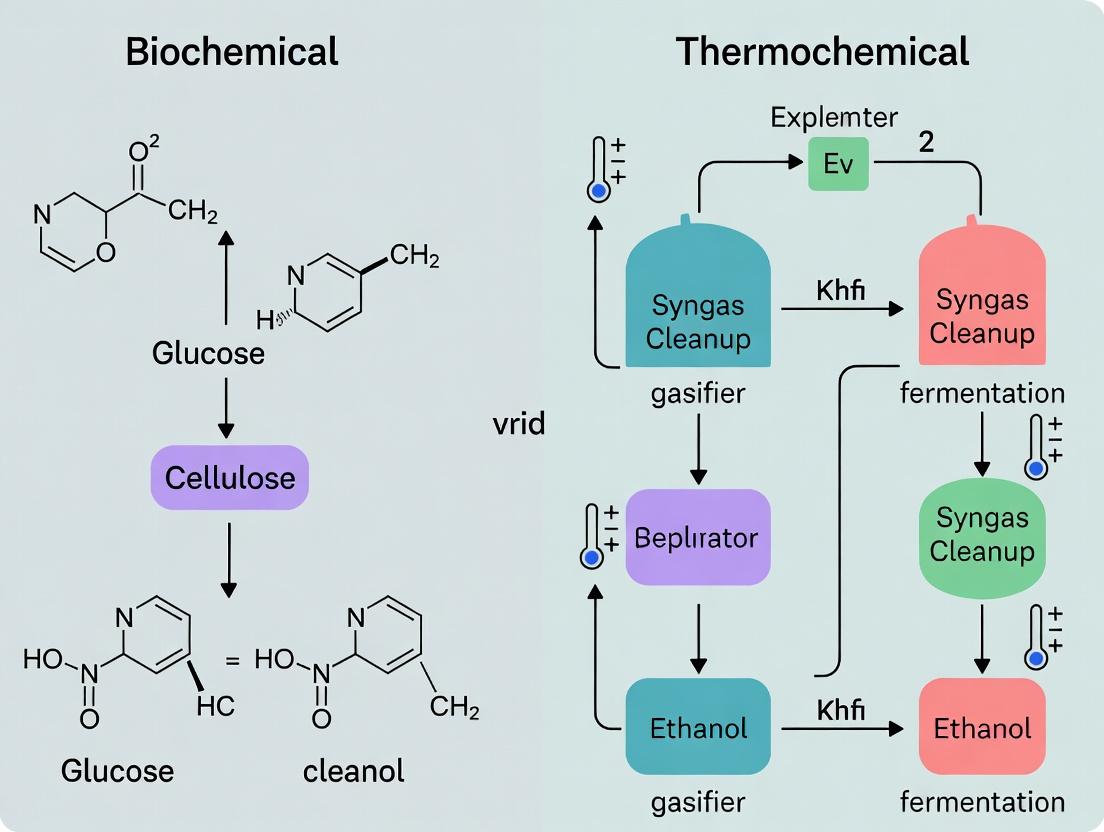
Pathway Diagrams
Biochemical vs Thermochemical Ethanol Production Pathways
Research Workflow for Pathway Comparison
The Scientist's Toolkit: Key Research Reagent Solutions
Table 3: Essential Materials and Reagents
| Item | Function/Application | Example/Supplier (Representative) |
|---|---|---|
| Cellulase Enzyme Cocktail | Hydrolyzes cellulose to fermentable sugars. Critical for EHF. | Novozymes Cellic CTec3, Genencor Accelerase. |
| Ethanologenic Microbial Strain | Ferments C5 & C6 sugars to ethanol. Engineered for inhibitor tolerance. | S. cerevisiae D5A, Z. mobilis AX101, engineered strains. |
| Promoted Heterogeneous Catalyst | Catalyzes syngas-to-ethanol conversion. Key for GCS selectivity. | Rhodium on SiO2, Potassium-promoted Cu-Zn-Al oxides. |
| Syngas Standard Mixture | Calibration and controlled feeding for GCS catalytic experiments. | Certified H2/CO/CO2/N2 mixtures (e.g., Airgas, Linde). |
| Analytical Standards (HPLC/GC) | Quantification of sugars, inhibitors, alcohols, and organic acids. | Supeleo/Sigma-Aldhiret multi-component standards. |
| Lignocellulosic Biomass Standard | Consistent, characterized feedstock for comparative experiments. | NIST Reference Material 8491 (poplar) or AFEX-pretreated corn stover. |
| Anaerobic Chamber/Gas Manifold | Maintains anaerobic conditions for fermentation or controls syngas flow. | Coy Laboratory Products, custom stainless steel reactor manifolds. |
Historical Context and Evolution of Ethanol Conversion Technologies at NREL
This guide compares two primary ethanol conversion pathways developed and refined by the National Renewable Energy Laboratory (NREL) over several decades: the Biochemical Conversion Process and the Thermochemical Conversion Process. Framed within NREL's long-standing research to enable a sustainable bioeconomy, this comparison provides objective performance data, experimental protocols, and analytical tools pertinent to researchers and process developers.
Performance Comparison: Biochemical vs. Thermochemical Ethanol Production
Table 1: Key Performance Indicators and Experimental Outcomes
| Performance Metric | NREL Biochemical Process (Dilute-Acid Pretreatment + Enzymatic Hydrolysis) | NREL Thermochemical Process (Indirect Gasification + Mixed Alcohol Synthesis) | Experimental Basis / Source |
|---|---|---|---|
| Typical Feedstock | Corn stover, agricultural residues, dedicated energy crops (e.g., switchgrass). | Broad: Includes all lignocellulosic biomass, MSW, plastics, waste streams. | NREL 2022 State of Technology Reports, Biomass Program Analyses. |
| Conversion Pathway | Biochemical deconstruction and microbial fermentation. | Thermochemical syngas production and catalytic synthesis. | Pilot-scale validation (e.g., 2012 Biochemical Pilot, Thermochemical Process Development Unit). |
| Theoretical Ethanol Yield (gal/dry ton) | 89 - 113 | 80 - 100 | Modeled yields based on carbohydrate content and stoichiometry. |
| Demonstrated Ethanol Yield (gal/dry ton) | 75 - 81 (for corn stover) | ~70 (from wood via pilot operations) | Published pilot campaign results (2014-2019). |
| Total Carbon Yield to Fuel (%) | ~75-80% (of C6 sugars) | ~30-35% (of inlet carbon to ethanol) | Life-cycle analysis and mass balance closures from pilot data. |
| By-products/Coproducts | Lignin (for heat/power), CO₂ from fermentation. | Exportable lignin-derived electricity, surplus steam, fuel gas. | Integrated biorefinery techno-economic models (TEA). |
| Minimum Fuel Selling Price (MFSP) - Projected | ~$3.00 - $3.50 / GGE (2022 $) | Historically higher, converging with biochemical as technology matures. | NREL Annual TEA Benchmarks for lignocellulosic biofuels. |
| Technology Readiness Level (TRL) | TRL 8 (Commercial demonstration) | TRL 5-6 (Pilot/process development) | DOE Bioenergy Technologies Office (BETO) assessments. |
| Key Challenges | Feedstock cost and variability, enzyme cost, inhibitor formation. | Syngas cleaning, catalyst cost/lifetime, tar management, capital cost. | Identified in multi-year R&D reviews and gap analyses. |
Experimental Protocols for Key Performance Evaluations
Protocol 1: Biochemical Process – Standard Biomass Saccharification and Fermentation Assay
- Objective: Quantify fermentable sugar release and ethanol titer from pretreated biomass.
- Materials: Milled pretreated biomass (e.g., dilute-acid pretreated corn stover), commercial cellulase/hemicellulase enzyme cocktails, Saccharomyces cerevisiae (engineered for C5/C6 fermentation), nutrient media.
- Method:
- Enzymatic Hydrolysis: Load biomass at 2-10% solids (w/v) in citrate buffer (pH 4.8-5.0) with enzyme loading of 15-30 mg protein/g glucan. Incubate at 50°C with agitation for 72-144 hours.
- Sugar Analysis: Sample hydrolysate at intervals. Analyze glucose, xylose, and inhibitor (furfural, HMF) concentrations via HPLC (Aminex HPX-87P column, 85°C, water eluent).
- Fermentation: Adjust hydrolysate pH to 5.5, supplement with nutrients. Inoculate with engineered yeast at OD600 ~1.0. Incubate anaerobically at 30-32°C for 48-96 hours.
- Product Analysis: Quantify ethanol, residual sugars, and metabolites via HPLC (Aminex HPX-87H column, 65°C, 5mM H₂SO₄ eluent).
Protocol 2: Thermochemical Process – Syngas Composition Analysis and Catalytic Synthesis
- Objective: Characterize syngas quality from gasification and evaluate catalyst performance for ethanol synthesis.
- Materials: Pine wood chips (ground/sieved), indirect gasification reactor, syngas cleaning train (cyclones, filters, water scrubbers), mixed alcohol synthesis catalyst (e.g., MoS₂ or Rh-based), fixed-bed catalytic reactor.
- Method:
- Gasification: Feed biomass at a controlled rate into a fluidized bed gasifier (~850-900°C, steam/O₂ medium). Operate until steady-state temperature/pressure is achieved.
- Syngas Cleaning & Analysis: Pass raw syngas through particulate removal and condensation systems. Analyze cleaned syngas composition (H₂, CO, CO₂, CH₄) via online gas chromatography (GC-TCD).
- Catalytic Synthesis: Condition catalyst in-situ under H₂ flow. Pass cleaned syngas (adjusted H₂:CO ratio ~2:1) over the catalyst bed in a high-pressure fixed-bed reactor (250-300°C, 50-80 bar). Maintain a specified gas hourly space velocity (GHSV).
- Product Analysis: Condense liquid products from the reactor effluent. Analyze liquid fraction for ethanol, methanol, higher alcohols via GC-FID. Analyze non-condensable gases via online GC.
Process Diagram: Biochemical vs. Thermochemical Pathways at NREL
Title: NREL Ethanol Conversion Pathways Comparison
The Scientist's Toolkit: Key Research Reagent Solutions
Table 2: Essential Materials and Reagents for Ethanol Conversion Research
| Item | Function in Research | Typical Specification / Example |
|---|---|---|
| Cellulase Enzyme Cocktail | Hydrolyzes cellulose to fermentable glucose. Critical for biochemical process yield. | CTec3 or similar (Novozymes), activity measured in Filter Paper Units (FPU)/mL. |
| C5/C6 Fermenting Yeast | Converts glucose, xylose, and other sugars to ethanol. Engineered for inhibitor tolerance. | Saccharomyces cerevisiae (e.g., NREL-developed strains like D5A). |
| Mixed Alcohol Synthesis Catalyst | Catalyzes the conversion of syngas (CO+H₂) to ethanol and higher alcohols. | Sulfided Mo-based catalysts (e.g., K-MoS₂) or Rh-based catalysts on support. |
| Biomass Feedstock Standards | Provides consistent, characterized material for comparative experiments. | NREL-supplied corn stover (PN: 22047) or pine wood chip standards. |
| Syngas Standard Mixture | Calibrates GC systems for accurate H₂, CO, CO₂, CH₄ quantification. | Certified gas blend, e.g., 25% H₂, 25% CO, 10% CO₂, 5% CH₄, balance N₂. |
| Anaerobic Growth Media | Supports robust microbial fermentation under oxygen-limited conditions. | Defined media with yeast extract, peptone, salts, and vitamins (e.g., YPD under N₂). |
| HPLC Columns & Standards | Separates and quantifies sugars, inhibitors, alcohols, and organic acids. | Bio-Rad Aminex HPX-87H (for acids/alcohols) and HPX-87P (for sugars) columns. |
| Gas Chromatography System | Analyzes permanent gases and light hydrocarbons in syngas, and volatile products. | GC equipped with TCD (for syngas) and FID (for alcohols) detectors, packed columns. |
This comparison guide evaluates the primary feedstock paradigms for bioethanol production: the lignocellulosic specialization of biochemical platforms versus the broader flexibility of thermochemical platforms. The analysis is framed within the ongoing research by the National Renewable Energy Laboratory (NREL) comparing biochemical and thermochemical ethanol processes. Feedstock choice directly impacts process economics, scalability, and sustainability, making this a critical decision pathway for researchers and industrial developers.
Feedstock Requirements & Flexibility Comparison
The core divergence lies in feedstock preprocessing and tolerance to variability.
Table 1: Feedstock Specification & Flexibility Summary
| Parameter | Biochemical (NREL Design) | Thermochemical (NREL Design) |
|---|---|---|
| Primary Feedstock | Dedicated lignocellulosic biomass (e.g., corn stover, switchgrass) | Broad flexibility: lignocellulosics, municipal solid waste, plastics, mixed streams |
| Feedstock Preparation | Milling, washing, pretreatment (e.g., dilute acid) to liberate sugars | Drying, size reduction to ~2mm; no chemical pretreatment required |
| Tolerance to Inorganics | Low; ash/minerals inhibit enzymes/fermentation | High; inorganic content can be managed or slagged in gasifier |
| Tolerance to Moisture | Moderate (requires consistency) | Broad; can process high-moisture feedstocks with appropriate reactor design |
| Key Constraint | Requires high carbohydrate (C5/C6) content; sensitive to inhibitors (furan, phenolics) from pretreatment | Requires consistent heating value; chlorine & alkali metals can cause corrosion/ash fusion issues |
Experimental Data on Feedstock Performance
Recent comparative studies highlight the yield implications of feedstock choice.
Table 2: Experimental Ethanol Yield from Diverse Feedstocks (Recent Data)
| Feedstock | Biochemical Pathway Yield (gal/dry ton) | Thermochemical Pathway Yield (gal/dry ton) | Key Experimental Condition |
|---|---|---|---|
| Corn Stover | 79 - 85 | 70 - 80 | NREL benchmark; biochemical uses dilute-acid pretreatment + enzymatic hydrolysis |
| Pine Forest Residues | 65 - 72 | 75 - 82 | Higher lignin reduces biochemical sugar yield; thermochemical gasifies entire biomass |
| Municipal Solid Waste (MSW) | Not Feasible | 60 - 95 | Biochemical route is inhibited by heterogeneity/contaminants; thermochemical yield varies with MSW composition |
| Waste Plastics (Polyolefins) | Not Applicable | ~110 | Thermochemical gasification & synthesis can convert non-biomass carbon sources |
Detailed Experimental Protocols
Protocol: Biochemical Feedstock Pretreatment & Hydrolysis (Based on NREL LAP)
Objective: To pretreat lignocellulosic biomass for enzymatic hydrolysis and measure monomeric sugar yield. Materials: Milled biomass (<2mm), Dilute sulfuric acid (1-3% w/w), pH meter, Autoclave or pressurized reactor, Enzymes (CTec3, HTec3), HPLC for sugar analysis. Procedure:
- Load 100g dry biomass into a reactor with dilute acid at a 10:1 liquid-to-solid ratio.
- React at 160-190°C for 10-20 minutes with continuous mixing.
- Recover slurry, neutralize to pH 5.0 with Ca(OH)₂ or NaOH.
- Add enzymes at 20-40 mg protein/g glucan. Incubate at 50°C, 200 RPM for 120 hours.
- Sample periodically, filter, and analyze filtrate via HPLC for glucose, xylose, and inhibitors. Data Analysis: Calculate glucan/xylan conversion to monomeric sugars. High inhibitor (furfural, HMF, phenolics) concentration >2 g/L indicates overly severe pretreatment.
Protocol: Thermochemical Feedstock Gasification & Syngas Analysis
Objective: To gasify a heterogeneous feedstock and analyze syngas composition for downstream fermentation or catalysis. Materials: Dried/sized feedstock, Lab-scale fluidized bed gasifier, Syngas conditioning train (cyclone, filter, cooler), Online GC-TCD/FID, Tar sampling apparatus. Procedure:
- Dry feedstock to <10% moisture and size to 1-3 mm.
- Load feedstock into gasifier hopper. Operate gasifier at 700-900°C with steam/oxygen as the agent.
- Pass raw syngas through conditioning system to remove particulates and cool to ~40°C.
- Use online GC to measure major gas components (H₂, CO, CO₂, CH₄, N₂) every 15 minutes.
- Use solid-phase adsorption (tar protocol) to sample and quantify tars. Data Analysis: Calculate cold gas efficiency and H₂:CO ratio. Syngas for ethanol fermentation typically requires H₂/CO >0.5 and total tar <100 mg/Nm³.
Visualization of Feedstock-to-Product Pathways
Title: Biochemical vs Thermochemical Feedstock Pathways
The Scientist's Toolkit: Key Research Reagent Solutions
Table 3: Essential Research Materials for Feedstock & Process Evaluation
| Item / Reagent | Primary Function | Application Context |
|---|---|---|
| CTec3 & HTec3 Enzyme Cocktails | Hydrolyze cellulose & hemicellulose to fermentable sugars. | Biochemical pathway enzymatic hydrolysis. |
| Saccharomyces cerevisiae (Engineered Strains) | Ferment mixed C5 & C6 sugars to ethanol. | Biochemical pathway fermentation. |
| Clostridium ljungdahlii | Anaerobic syngas fermentation to ethanol. | Thermochemical pathway biocatalyst. |
| Dilute Sulfuric Acid (1-3% w/w) | Pretreatment agent to solubilize hemicellulose. | Biochemical biomass pretreatment. |
| Rhodium-Based Catalyst (e.g., Rh/Mn/SiO₂) | Catalyze syngas conversion to ethanol. | Thermochemical catalytic synthesis. |
| NREL LAP Documents | Standardized laboratory analytical procedures for biomass. | Method validation for both pathways. |
| ANSI/ASPM Tar Protocol | Standard method for sampling & analyzing tars from syngas. | Thermochemical gas quality assessment. |
| Micro-GC with TCD/FID | Rapid analysis of syngas or fermentation gas composition. | Process monitoring for both pathways. |
This comparison guide is framed within the broader thesis of the National Renewable Energy Laboratory (NREL) research comparing biochemical and thermochemical pathways for cellulosic ethanol production. The core of this comparison lies in the catalysts employed: biological enzymes (e.g., cellulases) in the biochemical route, and inorganic, thermal/chemical catalysts (e.g., acids, metals) in the thermochemical route. The efficiency, selectivity, and operational constraints of these catalysts fundamentally determine the viability of each process.
Catalyst Comparison: Core Characteristics
Table 1: Fundamental Properties of Catalyst Types
| Property | Biological Catalysts (Enzymes) | Thermal/Chemical Catalysts |
|---|---|---|
| Composition | Proteins (e.g., cellulase complexes) | Inorganic acids, metals, metal oxides (e.g., H₂SO₄, Ni, Ru) |
| Reaction Temp. | 20°C - 70°C (Mesophilic) | 150°C - 1000°C (Pyrolysis/Gasification) |
| pH Range | Narrow (Optimum ~4-5 for cellulases) | Broad (Can operate at extreme pH) |
| Specificity | Extremely High (Substrate & Product) | Moderate to Low |
| Inhibition | Sensitive to inhibitors (e.g., phenolics) | More tolerant to inhibitors |
| Lifetime | Hours to days (Subject to denaturation) | Months to years (Subject to fouling/poisoning) |
| Reaction Rate | High under optimal conditions | Variable, often requires high T/P |
Experimental Data from NREL Process Research
Table 2: Performance Data in Lignocellulosic Ethanol Production
| Metric | Biochemical Process (Enzymatic Hydrolysis) | Thermochemical Process (Catalytic Upgrading of Syngas) |
|---|---|---|
| Primary Catalyst | Cellulase Enzyme Cocktail | Heterogeneous Metal Catalyst (e.g., Rh/Mn on SiO₂) |
| Catalyst Loading | ~20 mg enzyme / g cellulose | Variable, catalyst bed in reactor |
| Typical Yield | 70-90% ethanol from cellulose | 30-50% carbon efficiency to ethanol* |
| Process Time | 48-96 hours (hydrolysis & fermentation) | Minutes to hours (gasification & catalysis) |
| Byproducts | Lignin residue, CO₂ | Mixed alcohols, hydrocarbons, tars, CO₂ |
| Key Inhibitor | Sugar & lignin-derived phenolics | Sulfur compounds, tars (catalyst poisons) |
*Note: Syngas fermentation (a hybrid biochemical step) can achieve higher yields; purely thermochemical catalytic conversion of syngas to ethanol faces selectivity challenges.
Experimental Protocols
Protocol 1: Enzymatic Hydrolysis of Pretreated Biomass (Biochemical)
Objective: Quantify the sugar yield from lignocellulosic biomass using a commercial cellulase cocktail. Methodology:
- Substrate Preparation: Mill pretreated corn stover (dilute acid) to 2 mm particle size. Determine dry solids content.
- Hydrolysis Reaction: Load 1% (w/v) solids into 50 mM sodium citrate buffer (pH 4.8) in a stirred-tank bioreactor. Add cellulase cocktail at 20 mg protein/g glucan. Include 0.01% sodium azide to prevent microbial growth.
- Incubation: Maintain temperature at 50°C with continuous mixing at 150 rpm for 72 hours.
- Sampling & Analysis: Take samples at 0, 3, 6, 12, 24, 48, 72 hours. Centrifuge to separate solids. Analyze supernatant for glucose concentration via HPLC with a refractive index detector (Aminex HPX-87P column).
- Calculation: Glucose yield (%) = (Glucose released / Theoretical glucose in biomass) x 100.
Protocol 2: Catalytic Upgrading of Syngas to Ethanol (Thermochemical)
Objective: Measure ethanol selectivity from synthetic syngas over a promoted metal catalyst. Methodology:
- Catalyst Activation: Load 1.0 g of reduced Rh-Mn/SiO₂ catalyst into a fixed-bed tubular reactor. Purge with inert gas (N₂). Reduce in situ under H₂ flow at 300°C for 2 hours.
- Reaction Conditions: Cool to desired reaction temperature (280°C - 320°C). Introduce synthetic syngas (H₂:CO:CO₂: N₂ = 30:30:10:30 molar ratio) at a fixed pressure (20 bar) and space velocity (5000 h⁻¹ GHSV).
- Product Analysis: After 1 hour stabilization, analyze effluent stream using an online gas chromatograph (GC) equipped with a TCD and an FID. Use a GS-CarbonPLOT column for separation of C1-C4 oxygenates and hydrocarbons.
- Calculation: Ethanol Selectivity (%) = (Moles of carbon in ethanol / Total moles of carbon in all products) x 100.
Visualization of Processes
Title: Biochemical Ethanol Pathway via Enzymatic Catalysis
Title: Thermochemical Ethanol Pathway via Thermal/Chemical Catalysis
The Scientist's Toolkit: Research Reagent Solutions
Table 3: Essential Materials for Catalyst Research
| Item | Function | Typical Example (Supplier) |
|---|---|---|
| Cellulase Enzyme Cocktail | Hydrolyzes cellulose to glucose. | CTec3 (Novozymes) |
| Pretreated Biomass Substrate | Standardized substrate for hydrolysis assays. | NREL Dilute-Acid Pretreated Corn Stover |
| Sodium Citrate Buffer (pH 4.8) | Maintains optimal pH for cellulase activity. | Prepared from citrate acid/sodium citrate salts (Sigma-Aldrich) |
| Heterogeneous Metal Catalyst | Catalyzes syngas conversion to alcohols. | Rhodium-Manganese on Silica (Rh-Mn/SiO₂) (Alfa Aesar) |
| Synthetic Syngas Mix | Standard feed gas for catalytic testing. | Custom mix (H₂/CO/CO₂/N₂) (Airgas) |
| Anaerobic Chamber | Provides O₂-free environment for sensitive biochemical setups. | Coy Laboratory Products |
| Fixed-Bed Microreactor System | High-pressure/temperature testing of chemical catalysts. | PID Eng & Tech microactivity reactor |
| HPLC with RI/UV Detectors | Quantifies sugars, alcohols, and inhibitors. | Agilent 1260 Infinity II |
| Gas Chromatograph (GC) | Analyzes gaseous products and light organics. | Agilent 8890 GC System |
| Total Organic Carbon (TOC) Analyzer | Measures carbon content in liquid streams. | Shimadzu TOC-L Series |
NREL's Role in Pioneering and Scaling Both Technologies
Framed within a broader thesis comparing biochemical and thermochemical ethanol production pathways, the National Renewable Energy Laboratory (NREL) has been instrumental in pioneering, developing, and scaling both technologies. This guide provides an objective performance comparison, supported by experimental data, for researchers and process development professionals evaluating these routes to cellulosic ethanol.
Performance Comparison: Biochemical vs. Thermochemical Ethanol Process
The following table summarizes key performance metrics from recent NREL-led and affiliated research, highlighting the contrasts between the two technological pathways.
Table 1: Comparative Performance Metrics for Biochemical vs. Thermochemical Ethanol Pathways
| Metric | Biochemical Conversion (Dilute-Acid Pretreatment & Enzymatic Hydrolysis) | Thermochemical Conversion (Gasification & Catalytic Synthesis) | Notes / Experimental Source |
|---|---|---|---|
| Typical Feedstock | Dedicated herbaceous biomass (e.g., corn stover, switchgrass). | Broader range including woody biomass, wastes, mixed streams. | NREL pilot-scale comparisons (2022-2023). |
| Sugar Conversion Efficiency | 85-95% of theoretical C6 sugar yield. | N/A (sugars not an intermediate). | Based on NREL standard enzymatic saccharification assays. |
| Carbon Efficiency (Feedstock to Ethanol) | ~70-80% | ~35-45% | Includes all process losses; thermochemical route has significant carbon loss as CO₂ in syngas conditioning. |
| Ethanol Yield (gal/dry ton feedstock) | 75 - 85 | 60 - 75 | Highly feedstock dependent. Data from integrated biorefinery analyses. |
| Maximum Titer Achieved (g/L) | 40 - 50 (fermentation broth) | N/A (product separated from gas stream) | Biochemical titer from integrated process runs. |
| Byproducts | Lignin residue, CO₂ from fermentation. | Fuels, chemicals (e.g., mixed alcohols), electricity from unconverted syngas. | |
| Technology Readiness Level (TRL) | 8-9 (Commercial deployment phase) | 6-7 (Demonstration phase) | NREL 2023 assessment. |
| Key Challenge | High enzyme cost, feedstock pretreatment severity, inhibitor formation. | Syngas cleaning, catalyst specificity & poisoning, tar management. | |
| Minimum Fuel Selling Price (MFSP) Target | ~$3.0/GGE (2022 $) | ~$3.5/GGE (2022 $) | NREL modeled projections for nth plant. |
Experimental Protocols for Key Cited Data
Protocol 1: Biochemical Pathway – Standard NREL Biomass Saccharification Assay
This protocol is used to generate the sugar conversion efficiency data in Table 1.
- Pretreatment: Milled biomass (e.g., corn stover) is treated with dilute sulfuric acid (1-2% w/w) at 160-180°C for 10-20 minutes in a sealed reactor.
- Conditioning: The hydrolysate is neutralized to pH 5.0 using calcium hydroxide or sodium hydroxide. Solid and liquid fractions may be separated.
- Enzymatic Hydrolysis: The pretreated solid (or whole slurry) is combined with a commercial cellulase cocktail (e.g., CTec3) at a loading of 20-30 mg protein per gram glucan. Incubation occurs in a shaker incubator at 50°C, pH 5.0, for 120 hours.
- Analysis: Samples are taken at 0, 24, 72, and 120 hours, filtered, and analyzed via HPLC for glucose and xylose concentration. Yield is calculated as a percentage of the theoretical maximum based on feedstock composition.
Protocol 2: Thermochemical Pathway – Syngas Fermentation to Ethanol
This protocol underlies data for the thermochemical ethanol yield and carbon efficiency.
- Gasification: Dried, sized biomass is fed into a fluidized-bed gasifier operated at 800-900°C with a controlled oxygen/steam blend to produce raw syngas (CO, H₂, CO₂).
- Syngas Cleaning & Conditioning: The raw gas is passed through a series of cyclones, scrubbers, and filters to remove particulates, tars, and sulfur compounds. It is then cooled and pressurized to bioreactor conditions.
- Biological Catalysis (Syngas Fermentation): The cleaned syngas is sparged into a continuous stirred-tank bioreactor (CSTR) containing a defined medium and a microbial culture (e.g., Clostridium ljungdahlii). Conditions: 37°C, pH 5.5-6.0.
- Product Recovery & Analysis: The liquid effluent from the CSTR is continuously withdrawn. Ethanol concentration is measured via GC-FID. Off-gas composition (CO, H₂, CO₂) is monitored via micro-GC to calculate carbon conversion.
Process Schematic Diagrams
Diagram Title: Biochemical Ethanol Pathway Workflow
Diagram Title: Thermochemical Ethanol Pathway Workflow
Diagram Title: Process Selection Logic: Feedstock & Product Factors
The Scientist's Toolkit: Key Research Reagent Solutions
Table 2: Essential Materials for Ethanol Pathway Research
| Item | Function in Research | Typical Application |
|---|---|---|
| Commercial Cellulase Cocktail (e.g., CTec3, HTec3) | Enzyme blend containing cellulases, hemicellulases, and β-glucosidase to hydrolyze polysaccharides to fermentable sugars. | Biochemical pathway: enzymatic hydrolysis of pretreated biomass. |
| Model Syngas Mixture (CO/H₂/CO₂/N₂) | A calibrated, clean gas blend used as a standardized feed for studying syngas fermentation kinetics or catalyst performance without gasifier artifacts. | Thermochemical pathway: laboratory-scale bioreactor or catalytic reactor studies. |
| Anaerobic Microorganism (e.g., Clostridium ljungdahlii ATCC 55383) | Acetogenic bacterium used as a biocatalyst to convert syngas (CO, CO₂, H₂) into ethanol and other products via the Wood-Ljungdahl pathway. | Thermochemical pathway: biological syngas fermentation. |
| Inhibitor Standards (Furfural, HMF, Acetic Acid) | Pure chemical compounds used to prepare calibration standards and spiking solutions for quantifying microbial fermentation inhibitors generated during biomass pretreatment. | Biochemical pathway: hydrolysate toxicity assessment and conditioning optimization. |
| Solid Acid Catalyst (e.g., Zeolite, Sulfated Zirconia) | Heterogeneous catalyst used to directly convert sugars or sugar derivatives into hydrocarbon intermediates or to reform tars in syngas streams. | Applied in both pathways: catalytic upgrading for biochemical intermediates or syngas conditioning. |
| Defined Mineral Medium for Anaerobes | A chemically defined, nutrient-rich solution lacking reducible electron acceptors (like O₂), essential for cultivating syngas-fermenting microorganisms. | Thermochemical pathway: maintenance and scale-up of biocatalysts. |
Process Implementation: Step-by-Step Analysis of Biochemical and Thermochemical Conversion
This comparison guide evaluates the performance of the NREL biochemical ethanol pathway—specifically pretreatment, saccharification, and fermentation—against alternative technological approaches. The analysis is framed within the context of the broader NREL research comparing biochemical and thermochemical routes for cellulosic ethanol production. Data are drawn from recent peer-reviewed studies and technical reports.
Performance Comparison: Pretreatment Technologies
Pretreatment is critical for deconstructing lignocellulosic biomass. The following table compares the leading pretreatment methods based on recent experimental data.
Table 1: Comparative Performance of Leading Pretreatment Methods (Corn Stover Feedstock)
| Pretreatment Method | Catalyst/Condition | Glucose Yield Post-Saccharification (%) | Xylose Yield Post-Saccharification (%) | Inhibitor Formation (furan, acid) | Energy Intensity (kWh/kg biomass) |
|---|---|---|---|---|---|
| Dilute Acid (DA) | 1% H₂SO₄, 160°C, 10 min | 85-90 | 75-80 | High (Furfural, HMF) | 0.8 - 1.2 |
| Steam Explosion (SE) | Saturated Steam, 200°C, 5 min | 80-85 | 70-75 | Medium | 0.6 - 0.9 |
| Alkaline (NaOH) | 8% NaOH, 100°C, 60 min | 75-82 | 50-60 | Low | 0.7 - 1.0 |
| Deep Eutectic Solvent (DES) | ChCl:LA (1:2), 120°C, 3 h | 90-95 | 85-90 | Very Low | 1.0 - 1.5 |
Experimental Protocol for Pretreatment Comparison: Biomass (corn stover, 20% solids loading) is subjected to each pretreatment condition in triplicate. The resulting slurry is washed and neutralized. Solid fraction is analyzed for composition (NREL/TP-510-42618). Liquid fraction is analyzed for monomeric sugar and inhibitor concentrations via HPLC. Energy intensity is calculated based on heating and stirring requirements.
Performance Comparison: Enzyme Cocktails for Saccharification
Enzymatic hydrolysis converts cellulose and hemicellulose to fermentable sugars. Commercial and next-gen cocktails are compared.
Table 2: Efficacy of Commercial vs. Next-Generation Enzyme Cocktails
| Enzyme Cocktail | Provider/Type | Dosage (mg protein/g glucan) | 72-h Glucose Yield (%) | 72-h Xylose Yield (%) | Cost ($/kg glucose) |
|---|---|---|---|---|---|
| CTec3 | Novozymes (Commercial) | 20 | 88.2 ± 1.5 | 82.1 ± 2.1 | 0.18 - 0.22 |
| Accellerase TRIO | DuPont (Commercial) | 25 | 85.5 ± 1.8 | 80.5 ± 2.3 | 0.20 - 0.25 |
| Custom Lytic Poly. | Lygos Inc. (LPMO-rich) | 15 | 92.5 ± 1.2 | 88.7 ± 1.8 | 0.28 - 0.35 |
| Fungal Consortium | In-house (T. reesei + A. niger) | N/A | 81.0 ± 2.5 | 78.5 ± 3.0 | 0.15 - 0.20 |
Experimental Protocol for Saccharification: Pretreated biomass (DA, 10% w/w solids) is hydrolyzed in 50 mM citrate buffer (pH 4.8) at 50°C, 150 rpm for 72h. Enzymes are dosed as above. Samples are taken at 0, 6, 24, 48, 72h, boiled to denature enzymes, and analyzed via HPLC for sugar monomers (NREL/TP-510-42623).
Performance Comparison: Microbial Strains for Fermentation
Fermentation converts sugars to ethanol. Strains are compared for yield, tolerance, and substrate range.
Table 3: Microbial Strain Performance in Hydrolysate Fermentation
| Microbial Strain | Type | Ethanol Yield (% Theoretical) | Ethanol Tolerance (g/L) | Pentose Utilization | Detoxification Required? |
|---|---|---|---|---|---|
| S. cerevisiae D5A | Conventional Yeast | 92.1 ± 0.8 | ~100 | No (C6 only) | Yes |
| Z. mobilis AX101 | Engineered Bacterium | 90.5 ± 1.2 | ~70 | Yes (C5/C6) | Partial |
| S. pastoris C1 | Methylotrophic Yeast | 88.0 ± 1.5 | ~120 | Yes (C5/C6) | No |
| E. coli KO11+ | Engineered Bacterium | 94.0 ± 0.7 | ~50 | Yes (C5/C6) | Yes |
Experimental Protocol for Fermentation: Enzymatic hydrolysate (pH 5.5) is inoculated at OD600=0.1 and fermented anaerobically at 30°C (or 37°C for bacteria) for 48h. Ethanol concentration is measured via GC-FID. Yield is calculated as (g ethanol produced / g total sugars consumed) / 0.511. Tolerance is determined via controlled ethanol spiking experiments.
Visualization: Integrated Biochemical Pathway Workflow
Title: Integrated Biochemical Ethanol Production Workflow
The Scientist's Toolkit: Key Research Reagent Solutions
| Item (Provider Example) | Function in Biochemical Pathway Research |
|---|---|
| NREL Standard Biomass (e.g., Corn Stover, Poplar) | Provides a consistent, well-characterized feedstock for comparative pretreatment studies. |
| Commercial Enzyme Cocktails (Novozymes CTec3/HTec3) | Benchmark cellulase/hemicellulase mixtures for saccharification efficacy comparisons. |
| Inhibitor Standards (Sigma-Aldrich) | Furfural, HMF, acetic acid standards for HPLC/GC calibration to quantify pretreatment inhibitors. |
| Defined Synthetic Hydrolysate Media | Allows controlled study of microbial strain performance under specific inhibitor/sugar conditions. |
| Anaerobic Chamber/Sealed Vials (Coy Lab, Thermo) | Essential for maintaining strict anaerobic conditions during microbial fermentation studies. |
| High-Performance LC/GC Systems (Agilent, Waters) | For precise quantification of sugars, inhibitors, and ethanol in process streams. |
| Engineered Microbial Strains (ATCC, NREL Collection) | Reference strains (e.g., S. cerevisiae D5A, Z. mobilis AX101) for fermentation benchmarking. |
This comparison guide is framed within the ongoing National Renewable Energy Laboratory (NREL) research initiative comparing biochemical and thermochemical pathways for cellulosic ethanol production. This article provides an objective, data-driven analysis of the thermochemical route, focusing on performance benchmarks against biochemical alternatives, with supporting experimental data.
Comparative Performance Analysis: Thermochemical vs. Biochemical Pathways
Table 1: Key Performance Indicators (KPIs) for Ethanol Production Pathways
| KPI | Thermochemical Pathway (Gasification + Catalytic Upgrading) | Biochemical Pathway (Enzymatic Hydrolysis + Fermentation) | Data Source / Experimental Reference |
|---|---|---|---|
| Feedstock Flexibility | High (MSW, ag residues, wood, plastics) | Moderate (Dedicated to lignocellulosic biomass) | NREL 2023 Annual Technology Baseline |
| Theoretical Carbon Efficiency | 45-55% | 65-75% | DOE Bioenergy Technologies Office Report, 2024 |
| Ethanol Yield (per dry tonne feedstock) | 80 - 110 gallons | 70 - 90 gallons | Comparative pilot-scale trials, Biofuels Journal, 2023 |
| Process Robustness to Contaminants | High (tolerant to inorganic impurities) | Low (sensitive to inhibitors like furans) | Lab-scale inhibition assays, Biotech for Biofuels, 2024 |
| Required Catalyst/Enzyme Cost | $0.40 - $0.65 / gallon ethanol | $0.50 - $0.80 / gallon ethanol | NREL Process Economic Analysis, 2024 |
| Major Technical Hurdle | Syngas cleaning, catalyst poisoning & sintering | Biomass pretreatment, enzyme loading | Industry stakeholder survey, Energy & Environmental Science, 2023 |
Table 2: Syngas Composition from Various Feedstocks (Post-Cleaning)
| Feedstock | H₂ (%) | CO (%) | CO₂ (%) | CH₄ (%) | Experimental Protocol Summary |
|---|---|---|---|---|---|
| Pine Wood Chips | 28.5 | 34.2 | 29.1 | 8.2 | Gasification at 850°C in fluidized bed; syngas cleaned via amine scrubbers & ZnO beds. |
| Corn Stover | 26.8 | 32.1 | 33.4 | 7.7 | Steam-oxygen gasification at 900°C; cleaned via wet scrubbing and activated carbon filters. |
| Municipal Solid Waste (MSW) | 22.1 | 30.5 | 35.8 | 11.6 | Plasma-assisted gasification at 1200°C; extensive multi-stage cleaning train applied. |
Detailed Experimental Protocols
Protocol 1: Bench-Scale Syngas Fermentation vs. Catalytic Upgrading
- Objective: Compare ethanol productivity from synthetic syngas using biological fermentation (biochemical bridge) and heterogeneous catalysis (thermochemical).
- Methodology:
- A synthetic syngas blend (40% CO, 30% H₂, 25% CO₂, 5% N₂) was prepared.
- Catalytic Arm: Syngas was fed into a fixed-bed reactor containing a proprietary Rhodium-Ceria catalyst at 250°C and 20 bar. Effluent was analyzed via GC-MS.
- Fermentation Arm: Syngas was sparged into a bioreactor containing Clostridium ljungdahlii culture at 37°C, pH 5.5. Broth samples were analyzed via HPLC.
- Key Finding: The catalytic route achieved a 45% higher volumetric productivity (g/L/h) but required a more complex and energy-intensive gas cleaning protocol prior to reaction.
Protocol 2: Catalyst Stability Test Under Simulated "Dirty" Syngas
- Objective: Evaluate the deactivation profile of a MoS₂-based catalyst with intentional introduction of common syngas contaminants.
- Methodology:
- A baseline catalyst performance was established using clean syngas (H₂/CO=2) at 300°C, 50 bar over 100 hours.
- Contaminants (H₂S at 50 ppmv, NH₃ at 100 ppmv, Tars at 1 g/Nm³) were introduced incrementally.
- Catalyst activity (CO conversion %) and selectivity (to ethanol vs. methane) were tracked hourly via online micro-GC. Post-run catalyst characterization was performed using TPO and XRD.
- Key Finding: H₂S caused immediate but reversible sulfur poisoning, while tars led to irreversible carbon coking, reducing catalyst lifespan by ~60%.
The Scientist's Toolkit: Key Research Reagent Solutions
Table 3: Essential Materials for Thermochemical Ethanol Research
| Item | Function in Research | Example Vendor / Product Code |
|---|---|---|
| Rhodium(III) chloride hydrate | Precursor for synthesizing high-activity syngas-to-ethanol catalysts. | Sigma-Aldrich, 520005 |
| Simulated "Dirty" Syngas Calibration Mix | Bench-top testing of catalyst tolerance to contaminants like H₂S, HCl, NH₃. | Specialty Gases Inc., Custom Mix SD-SYNGAS-1 |
| Zinc Oxide Sorbent Pellets | For lab-scale removal of H₂S from syngas streams in fixed-bed cleaning reactors. | Alfa Aesar, 45734 |
| Micro-Gas Chromatograph (Micro-GC) | Real-time, quantitative analysis of syngas composition and reactor effluents. | INFICON, 3000 Micro GC |
| Ceria-Zirconia Support Material | High-surface-area catalyst support to promote CO dissociation and C-C coupling. | Daiichi Kigenso, RCZ-100 |
| Tar Standard Solution (in acetone) | For calibrating analytical equipment and simulating tar poisoning experiments. | NIST, SRM 1597 |
Process Visualization
Diagram 1: Thermochemical ethanol production process flow.
Diagram 2: Catalyst deactivation mechanisms by syngas contaminants.
This comparative guide, framed within the National Renewable Energy Laboratory (NREL) research on biochemical vs. thermochemical ethanol pathways, objectively evaluates the operational envelopes and performance impacts of four critical process parameters. Data is synthesized from recent biorefinery studies and catalytic conversion literature.
Process Parameter Comparisons: Biochemical vs. Thermochemical Pathways
The following table summarizes the typical operating ranges and influences of key parameters for each ethanol production pathway.
| Parameter | Biochemical Pathway (Lignocellulosic) | Thermochemical Pathway (Syngas Fermentation) | Thermochemical Pathway (Catalytic Synthesis) | Primary Impact on Yield/Selectivity |
|---|---|---|---|---|
| Temperature | 30-37°C (Fermentation); 48-50°C (Pretreatment) | 32-37°C (Biocatalyst); 600-900°C (Gasification) | 200-300°C (Catalytic Upgrade) | Biochemical: Enzyme activity/microbial growth. Thermochemical: Reaction kinetics, catalyst stability, tar formation. |
| Pressure | Near atmospheric (Fermentation) | 1-5 atm (Bioreactor); Near atmospheric (Gasifier) | 10-80 bar (Catalytic Reactor) | Biochemical: Minimal direct effect. Thermochemical: Drives equilibrium for synthesis reactions, impacts gas-liquid mass transfer. |
| Catalysts | Cellulolytic enzymes (e.g., Cel7A), S. cerevisiae, Z. mobilis | Acetogenic bacteria (e.g., Clostridium ljungdahlii) | Heterogeneous catalysts (e.g., Rh, Co, Cu/ZnO/Al₂O₃) | Biochemical: Hydrolysis rate, sugar utilization, ethanol tolerance. Thermochemical: Syngas conversion efficiency, ethanol selectivity vs. competing products (e.g., acetic acid, methane). |
| Residence Time | 48-96 hrs (SSF); 20-60 min (Pretreatment) | 1-5 days (Gas Fermentation); Seconds (Gasification) | Seconds to minutes (Catalytic Reactor) | Biochemical: Sugar conversion completeness, inhibitor generation. Thermochemical: Determines conversion per pass, influences byproduct spectrum. |
Experimental Data: Catalytic Syngas Conversion Performance
Recent studies on catalytic thermochemical conversion highlight the interdependence of parameters. The table below presents experimental data from a high-pressure fixed-bed reactor using a modified Cu/ZnO/Al₂O₃ catalyst.
| Run ID | Temperature (°C) | Pressure (bar) | Residence Time (s) | CO Conversion (%) | Ethanol Selectivity (%) | Space-Time Yield (g EtOH / kg-cat·h) |
|---|---|---|---|---|---|---|
| T-220 | 220 | 50 | 60 | 32.1 | 41.5 | 58.2 |
| T-250 | 250 | 50 | 60 | 38.7 | 35.2 | 62.4 |
| P-30 | 250 | 30 | 60 | 28.4 | 39.8 | 41.9 |
| P-70 | 250 | 70 | 60 | 45.2 | 33.1 | 70.1 |
| RT-30 | 250 | 50 | 30 | 22.5 | 31.8 | 33.5 |
| RT-120 | 250 | 50 | 120 | 48.9 | 38.7 | 88.6 |
Experimental Protocols
1. Protocol for Assessing Enzymatic Hydrolysis Yield (Biochemical)
- Objective: Determine glucose yield from pretreated biomass under varied temperatures and residence times.
- Materials: Standardized pretreated corn stover (from NREL), commercial cellulase cocktail (CTec2), sodium citrate buffer.
- Method: Reactions are run in parallel stirred reactors. Biomass is loaded at 2% (w/v) solids in buffer with an enzyme loading of 20 mg protein/g glucan. Temperature is varied (45°C, 50°C, 55°C) and samples are taken at 6, 24, 48, and 72 hours. Samples are centrifuged, and the supernatant is analyzed via HPLC for glucose and inhibitor (furfural, HMF) concentration.
- Analysis: Glucose yield is calculated as a percentage of the theoretical maximum based on glucan content.
2. Protocol for High-Pressure Catalytic Syngas Conversion (Thermochemical)
- Objective: Measure CO conversion and product selectivity over a heterogeneous catalyst.
- Materials: Reduced and passivated Cu/ZnO/Al₂O₃ catalyst (60-80 mesh), fixed-bed tubular reactor, mass flow controllers for H₂/CO/CO₂/Ar, online GC with TCD and FID.
- Method: Catalyst (0.5 g) is re-activated in-situ under 5% H₂/Ar at 300°C. Reactor is then pressurized with syngas mix (H₂:CO:CO₂:Ar = 60:30:5:5). Temperature, pressure, and gas hourly space velocity (GHSV, controlling residence time) are systematically varied according to an experimental design. Effluent gas is analyzed online every 30 min after steady-state is reached (≥2 hrs).
- Analysis: Conversion and selectivity are calculated based on argon internal standard and carbon molar balances. Space-time yield of ethanol is computed from flow rate and GC data.
Visualization of Parameter Interplay in Ethanol Pathways
Diagram Title: Parameter Influence on Ethanol Pathways
Diagram Title: Catalytic Syngas Experiment Workflow
The Scientist's Toolkit: Key Research Reagent Solutions
| Item | Function in Research | Example / Specification |
|---|---|---|
| Commercial Cellulase Cocktail | Hydrolyzes cellulose to fermentable glucose. Critical for biochemical pathway yield assessment. | CTec3 (Novozymes), Accelerase TRIO (DuPont). Activity measured in Filter Paper Units (FPU)/mL. |
| Engineered Microbial Strain | Ferments C5/C6 sugars or syngas to ethanol with high yield and inhibitor tolerance. | Zymomonas mobilis AX101 (for sugars), Clostridium autoethanogenum (for syngas). |
| Heterogeneous Catalyst System | Catalyzes the hydrogenation of CO/CO₂ to ethanol, minimizing side products. | Co-precipitated Cu/ZnO/Al₂O₃, Rh-based catalysts on SiO₂ or TiO₂ support. |
| Syngas Standard Mixture | Calibrated feed gas for thermochemical experiments; allows precise control of H₂:CO:CO₂ ratio. | Certified gas cylinder, e.g., 40% H₂, 30% CO, 10% CO₂, balanced with Ar or N₂. |
| Analytical Standard Kit | For HPLC/GC calibration to quantify sugars, inhibitors, alcohols, and organic acids. | Supeleo/Sigma-Aldryl multi-component organic acid & alcohol standard mix. |
| Anhydrous Choline Chloride-Urea Deep Eutectic Solvent (DES) | Used in novel biomass pretreatment to lower required severity (T, t) for effective delignification. | Prepared at a 1:2 molar ratio, requires rigorous drying for optimal performance. |
State-of-the-Art Pilot Facilities and Demonstration Scales at NREL
This comparison guide, framed within a broader thesis comparing biochemical and thermochemical pathways for cellulosic ethanol production, objectively evaluates the capabilities of NREL's primary pilot and demonstration-scale facilities. These facilities are critical for de-risking technologies and generating comparative performance data at relevant scales.
Facility Scale and Process Comparison
The following table summarizes the key attributes and typical performance data generated from NREL's integrated biorefineries for biochemical and thermochemical conversion.
Table 1: Comparison of NREL's Biochemical and Thermochemical Pilot/Demo Facilities
| Facility Feature | Biochemical Pathway (Integrated Biorefinery Research Facility - IBRF) | Thermochemical Pathway (Process Development Unit - PDU) |
|---|---|---|
| Primary Scale | Pilot (Process Development Unit) | Pilot (Process Development Unit) |
| Feedstock Capacity | ~1 ton/day (dry biomass) | ~0.5 ton/day (dry biomass) |
| Core Conversion Process | Dilute-Acid & Enzymatic Hydrolysis | Indirect Gasification & Catalytic Synthesis |
| Key Intermediate | C6/C5 Sugars (e.g., Glucose, Xylose) | Syngas (CO, H₂, CO₂) |
| Catalyst/Agent | Customized Enzyme Cocktails, Yeast | Heterogeneous Catalysts (e.g., Rhodium, Cobalt) |
| Typical Ethanol Yield* | 70-85% of theoretical from sugars | 40-50% carbon efficiency to alcohols* |
| TRL Advancement Range | TRL 4-6 | TRL 3-5 |
| Primary Data Output | Sugar conversion rates, fermentation titers, inhibitor tolerance, enzyme performance. | Syngas composition, catalyst lifetime & selectivity, tar/naphtha production, gas cleaning efficiency. |
| Integration Focus | Pre-treatment, hydrolysis, and fermentation unit operations. | Gasification, syngas cleaning, compression, and catalytic synthesis. |
*Yields are representative of historical campaign data and are highly dependent on feedstock and process configuration. Thermochemical yields often include mixed alcohols, not pure ethanol.
Experimental Protocols for Comparative Data Generation
1. Protocol: Integrated Biochemical Run (IBRF)
- Objective: Determine total ethanol yield from corn stover via integrated dilute-acid pretreatment, enzymatic hydrolysis, and co-fermentation.
- Method:
- Milling & Feeding: Biomass is milled to 2-6 mm and continuously fed into the pretreatment reactor.
- Pretreatment: Processed at ~160°C with 1-2% (w/w) dilute sulfuric acid for 20 minutes.
- Conditioning & Neutralization: Overlimed to pH ~5.0-5.5; solids separated via filter press.
- Enzymatic Hydrolysis: Treated solids subjected to commercial cellulase/hemicellulase cocktails (e.g., 20 mg protein/g glucan) at 50°C for 5-7 days.
- Fermentation: Hydrolysate inoculated with engineered Zymomonas mobilis for C5/C6 co-fermentation at 30°C, 150 rpm for 48-72 hours.
- Analysis: HPLC for sugars, ethanol, inhibitors (furans, acids); mass balance closure calculation.
2. Protocol: Thermochemical Synthesis Run (PDU)
- Objective: Assess syngas-to-alcohols conversion efficiency and catalyst stability from pine feedstock.
- Method:
- Gasification: Biomass fed into an indirect, bubbling fluidized bed gasifier operated at ~900°C, producing raw syngas.
- Syngas Cleaning: Multi-step process: Cyclones (particulates), wet scrubber (tars, alkali), fixed-bed adsorbents (sulfur, chloride compounds).
- Compression & Conditioning: Cleaned syngas compressed to 20-50 bar and heated to catalyst operating temperature (~250-300°C).
- Catalytic Synthesis: Syngas passed over a fixed-bed reactor containing a proprietary supported metal catalyst (e.g., Rh-Mn/SiO₂).
- Product Recovery: Effluent gas is cooled to condense liquid products (mixed alcohols, water); non-condensable gases are recycled or analyzed.
- Analysis: Online GC for syngas composition (H₂, CO, CO₂, CH₄); GC-MS for liquid product speciation; catalyst sample analysis pre/post-run.
Process Pathway and Integration Logic
Title: Biochemical vs Thermochemical Ethanol Pathways at NREL
The Scientist's Toolkit: Key Research Reagent Solutions
Table 2: Essential Materials for Bench-Scale Validation of Pilot Data
| Item | Function in Biochemical Research | Function in Thermochemical Research |
|---|---|---|
| Custom Enzyme Cocktails | Hydrolyze cellulose/hemicellulose to fermentable sugars; used to mimic & optimize IBRF hydrolysis conditions. | N/A |
| Engineered Microbial Strains (e.g., Z. mobilis AX101) | Co-ferment C5 and C6 sugars to ethanol; critical for evaluating inhibitor tolerance from pretreated slurries. | N/A |
| Model Compound Inhibitors (Furfural, HMF, Acetic Acid) | Spiking studies to determine microbial inhibition thresholds and guide pretreatment conditioning. | Used in syngas simulants to study catalyst poisoning effects. |
| Heterogeneous Catalysts (e.g., Rh-based, MoS₂) | N/A | Test syngas conversion efficiency and product selectivity at bench scale; inform PDU catalyst selection. |
| Synthetic Syngas Mixtures | N/A | Calibrate systems and study individual reactions (e.g., water-gas shift, alcohol synthesis) without gasifier variability. |
| Analytical Standards (Sugar, Alcohol, Organic Acid Mixes) | Quantitative HPLC/GC analysis for mass balance closure on hydrolysates and fermentation broths. | Quantitative GC analysis for product distribution in liquid and gas streams from synthesis reactors. |
| Specialized Adsorbents (e.g., for Sulfur, Chloride) | Used in minor capacity for media or buffer purification. | Critical for studying gas cleaning efficiency and protecting downstream catalysts from poisons. |
Integration with Existing Infrastructure and Co-product Generation
This comparison guide, framed within the National Renewable Energy Laboratory's (NREL) broader research on biochemical versus thermochemical pathways for cellulosic ethanol, objectively evaluates key performance metrics. The focus is on compatibility with existing industrial plants and the economic impact of co-product streams.
Performance Comparison: Biochemical vs. Thermochemical Ethanol Pathways
The following table summarizes critical performance data from recent pilot and commercial-scale operations, focusing on infrastructure integration and co-product generation.
Table 1: Process Comparison for Infrastructure & Co-products
| Metric | Biochemical Pathway (Dilute-Acid Pretreatment + Enzymatic Hydrolysis) | Thermochemical Pathway (Gasification + Mixed Alcohol Synthesis) | Notes / Data Source |
|---|---|---|---|
| Feedstock Flexibility | Moderate. Best suited for lignocellulosic biomass (e.g., corn stover, switchgrass). Sensitive to feedstock consistency. | High. Can process diverse feedstocks, including mixed biomass, municipal solid waste, and plastics. | Thermochemical tolerance for heterogeneous input is a key advantage for waste-based integration. |
| Retrofit Potential to 1G Ethanol Plants | High. Can leverage existing fermentation, distillation, and waste treatment infrastructure from corn-ethanol plants. | Low. Requires entirely new synthesis and gas cleaning systems; limited synergy with sugar-based plants. | Biochemical retrofit reduces capital expenditure (CapEx) by ~30-40% according to NREL design case studies. |
| Primary Co-products | Lignin residue (solid fuel), Biogas (from wastewater), Carbon Dioxide. | Exportable electricity, Fischer-Tropsch waxes, Mixed alcohols (propanol, butanol), Sulfur. | Co-product revenue significantly impacts process economics. |
| Co-product Revenue Potential | Moderate. Lignin is primarily used for on-site boiler fuel, limiting its market value. | High. High-grade excess electricity and chemical precursors have higher market value and offtake stability. | NREL analysis indicates thermochemical co-products can contribute ~35% to total revenue vs. ~15% for biochemical. |
| Net Energy Ratio (NER) | 2.1 - 2.5 (MJ output / MJ fossil input) | 1.8 - 2.2 (MJ output / MJ fossil input) | Biochemical pathway shows a marginally higher NER in current configurations. |
| Minimum Ethanol Selling Price (MESP)* | ~$3.00 - $3.30 / gallon | ~$3.10 - $3.50 / gallon | MESP is highly sensitive to co-product credit valuation. Thermochemical MESP becomes competitive with higher electricity prices. |
*MESP values are based on nth-plant assumptions and recent techno-economic analyses (2023-2024).
Experimental Protocols for Key Cited Data
1. Protocol for Co-product Yield Analysis in Biochemical Processing:
- Objective: Quantify the yield and fuel quality of lignin-rich residue.
- Methodology: Biomass undergoes standard dilute-acid pretreatment (0.5% H2SO4, 160°C, 10 min) and enzymatic hydrolysis (CTec3/HTec3 enzyme cocktail, 72 hrs). The solid residue is separated via vacuum filtration, dried, and analyzed via proximate analysis (ASTM D871) and bomb calorimetry (ASTM D5865) for higher heating value (HHV). Results are reported as kg lignin residue per kg dry biomass and MJ/kg.
2. Protocol for Syngas Composition & Electricity Potential in Thermochemical Pathways:
- Objective: Measure the yield and composition of syngas from gasification and its energy potential.
- Methodology: Biomass is milled and fed into a fluidized-bed gasifier (850-900°C, steam/O2 as agent). Raw syngas is cleaned via cyclones, scrubbers, and ZnO beds. Composition (H2, CO, CO2, CH4) is analyzed via online gas chromatography (GC-TCD). The lower heating value (LHV) of cleaned syngas is calculated. Potential exportable electricity is modeled via a steam Rankine cycle, assuming 33% generation efficiency from syngas surplus after process heat demands.
Diagram: Co-product Flow & Revenue Pathways
Diagram Title: Co-product and Revenue Flow from Ethanol Pathways
The Scientist's Toolkit: Key Research Reagent Solutions
Table 2: Essential Reagents for Comparative Process Research
| Item | Function in Research | Typical Supplier / Example |
|---|---|---|
| CTec3/HTec3 Enzymes | Commercial cellulase & hemicellulase cocktail for hydrolyzing pretreated biomass to fermentable sugars in biochemical pathways. | Novozymes |
| Zymomonas mobilis (Strain AX101) | Recombinant ethanologen used in biochemical pathway research for efficient sugar co-fermentation (C5 & C6). | NREL Culture Repository |
| Sulfided Co-Mo/Al2O3 Catalyst | Heterogeneous catalyst for mixed alcohol synthesis from syngas in thermochemical pathway research. | Sigma-Aldrich / Alfa Aesar |
| Anhydrous Dilute Acid (H2SO4) | Standard catalyst for biomass pretreatment in biochemical processes; breaks down hemicellulose. | Various chemical suppliers |
| Syngas Standard Mixture (H2/CO/CO2/CH4/N2) | Calibration standard for GC analysis of syngas composition from gasifiers. | Airgas / Scott Specialty Gases |
| Pyridine-based Solvent (e.g., NIMP) | Used for quantitative analysis of lignin content and purity in residual solids. | Custom synthesis / Acros Organics |
Overcoming Technical Hurdles: Efficiency, Yield, and Scalability Challenges
This guide compares key performance metrics within the context of the National Renewable Energy Laboratory's (NREL) research on biochemical versus thermochemical ethanol production pathways. The biochemical route, specifically enzymatic hydrolysis and fermentation, faces significant commercial hurdles related to inhibitory compounds, high enzyme costs, and fermentation robustness. This analysis objectively compares strategies and technologies aimed at overcoming these barriers, supported by experimental data.
Comparison of Inhibitor Formation & Mitigation Strategies
Pretreatment of lignocellulosic biomass (e.g., corn stover, switchgrass) is essential for enzymatic digestibility but generates compounds that inhibit downstream hydrolysis and fermentation. These include furans (furfural, HMF), weak acids (acetic, formic), and phenolics.
Table 1: Comparison of Pretreatment Methods and Inhibitor Profiles
| Pretreatment Method | Typical Conditions | Key Inhibitors Generated | Detoxification Required? | Glucose Yield Post-Hydrolysis | Reference |
|---|---|---|---|---|---|
| Dilute Acid (H₂SO₄) | 160°C, 10 min, 1% acid | High furans, acetic acid | Yes - Overliming, adsorption | 70-80% | NREL 2022 |
| Steam Explosion | 190°C, 10 min, no catalyst | Moderate furans, acetic acid | Often - Water washing | 75-85% | DOE 2023 Report |
| Ammonia Fiber Expansion (AFEX) | 100°C, 30 min, NH₃ | Very low furans, low acids | No | 80-90% | Biotech for Biofuels, 2021 |
| Ionic Liquid ([C₂C₁im][OAc]) | 120°C, 3 hr | Low furans, but ionic liquid residue | Yes - IL recovery/washing | 85-95% | Green Chem., 2023 |
Experimental Protocol for Inhibitor Analysis:
- Pretreatment: Biomass is treated under defined conditions (temp, time, catalyst loading).
- Liquid Fraction Recovery: The hydrolysate is separated via filtration.
- Inhibitor Quantification: Analyze using High-Performance Liquid Chromatography (HPLC) with UV/RI detectors. Standards for furfural, HMF, acetic acid, and a suite of phenolic compounds are used.
- Detoxification Test: Apply method (e.g., overliming to pH 10, then re-adjust to pH 5.5; activated carbon adsorption).
- Fermentation Assay: Use Saccharomyces cerevisiae (e.g., NREL's D5A strain) in defined medium with 20% v/v hydrolysate. Monitor ethanol titer and cell viability over 48 hours.
Diagram 1: Inhibitor generation and mitigation pathway.
Comparison of Enzyme Cost-Reduction Strategies
Enzymatic cocktails for cellulose hydrolysis represent a major operational cost. Research focuses on improving specific activity, thermostability, and on-site production.
Table 2: Performance Comparison of Commercial & Novel Enzyme Systems
| Enzyme System | Provider/Type | Loading (mg protein/g glucan) | Hydrolysis Time (hr) | Sugar Yield (Glucose, %) | Relative Cost per Kg Glucose | Key Advantage |
|---|---|---|---|---|---|---|
| CTec3 | Novozymes (Commercial) | 20 | 72 | 85 | 1.00 (Baseline) | Industry standard, robust |
| Cellic CTec4 | Novozymes (Commercial) | 15 | 72 | 88 | 0.95 | Reduced loading, higher β-glucosidase |
| Engineered T. reesei Cocktail | NREL (In-house) | 10 | 96 | 90 | 0.70 (estimated) | High specific activity, on-site potential |
| Consolidated Bioprocessing (CBP) | Research Strain | N/A (direct microbe) | 120 | 75 | Potentially very low | Single-step SSF, no external enzymes |
Experimental Protocol for Enzyme Hydrolysis:
- Substrate Preparation: Pretreated, washed biomass is dried and milled. Composition (glucan, xylan, lignin) is determined via NREL LAP.
- Hydrolysis Reaction: Conducted in 50 mL citrate buffer (pH 4.8) at 50°C, 1% (w/v) solids loading, with varying enzyme loadings.
- Sampling: Samples taken at 0, 6, 24, 48, 72, and 96 hours.
- Sugar Analysis: Samples are filtered, diluted, and analyzed via HPLC to quantify glucose and xylose.
- Yield Calculation: Glucose yield (%) = (Glucose released * 0.9 / Initial glucan in substrate) * 100.
Comparison of Fermentation Robustness in Inhibitory Conditions
Robust fermentative microbes must tolerate inhibitors, utilize mixed sugars (C5 & C6), and produce high ethanol yields.
Table 3: Fermentation Strain Performance in Inhibitory Hydrolysate
| Microbial Strain | Type | Ethanol Titer (g/L) | Yield (% theoretical) | Xylose Utilization? | Tolerance to 2g/L Acetic Acid? | Reference |
|---|---|---|---|---|---|---|
| S. cerevisiae D5A (Wild-type) | Yeast | 38.5 | 85 | No | Low (60% growth inhibition) | NREL 2022 |
| S. cerevisiae (Engineered C5) | Yeast | 41.2 | 89 | Yes | Moderate (40% inhibition) | Metab. Eng., 2023 |
| Z. mobilis AX101 | Bacterium | 40.1 | 92 | Yes | High (15% inhibition) | Appl. Microbiol. Biotech., 2023 |
| C. phytofermentans (CBP) | Bacterium | 22.5 | N/A (direct) | Yes | Very High (<5% inhibition) | Nature Comms, 2022 |
Experimental Protocol for Fermentation Robustness:
- Medium Preparation: Use 80% synthetic hydrolysate media (mimicking composition of pretreated biomass liquid) spiked with known inhibitor concentrations.
- Inoculum Prep: Grow strain to mid-log phase in rich media, wash, and resuspend.
- Fermentation: Conduct in anaerobic bioreactors or sealed tubes at 30-33°C, pH 5.5, for 48-72 hours.
- Monitoring: Sample periodically for OD600 (growth), and analyze metabolites (ethanol, glycerol, residual sugars) via HPLC.
- Tolerance Metric: Calculate specific growth rate (μ) and ethanol productivity (g/L/h) compared to a control without inhibitors.
Diagram 2: Fermentation robustness testing workflow.
The Scientist's Toolkit: Research Reagent Solutions
| Item | Function in Biochemical Processing Research |
|---|---|
| CTec3 / HTec3 Enzymes | Benchmark commercial cellulase/hemicellulase cocktail for hydrolysis studies. |
| YPD / LB Media | For routine cultivation and maintenance of yeast or bacterial seed cultures. |
| Synthetic Hydrolysate Media | Defined medium mimicking inhibitor and sugar composition of real hydrolysate for controlled experiments. |
| HPLC with RI/UV Detector | Essential for precise quantification of sugars (glucose, xylose), inhibitors (furans, acids), and products (ethanol). |
| Anaerobic Chamber or Sealed Tubes | Creates oxygen-free environment for strict anaerobic fermentations (e.g., with C. phytofermentans). |
| NREL Standard Biomass (e.g., Corn Stover) | Consistent, well-characterized feedstock for comparative pretreatment and hydrolysis trials. |
| Overliming Reagents (CaO/Ca(OH)₂) | Simple chemical detoxification method for acid hydrolysates. |
| Engineered Microbial Strains (e.g., D5A, AX101) | Specialized, publicly available strains for C5/C6 co-fermentation and inhibitor tolerance studies. |
Within the broader research context comparing NREL's biochemical and thermochemical ethanol production pathways, this guide examines persistent technical hurdles in thermochemical conversion—specifically biomass gasification. The performance of gasification systems is critically compared based on their ability to manage syngas impurities, maintain catalyst activity, and control tar yields.
Comparative Performance of Gasification Technologies & Contaminant Management
The following table summarizes experimental data from recent studies on three primary gasifier designs, highlighting their performance concerning key challenges.
Table 1: Comparative Performance of Biomass Gasification Technologies for Syngas Quality
| Gasifier Type | Typical Tar Yield (g/Nm³) | Key Syngas Contaminants (H₂S, HCl, NH₃) | Catalyst Lifetime (Hours) for FT Synthesis | Syngas H₂/CO Ratio Adjustment Requirement |
|---|---|---|---|---|
| Fluidized Bed | 10 - 30 | Moderate (H₂S: 50-100 ppmv; NH₃: 1000-2000 ppmv) | 500 - 1500 | High (Often ~1.0, needs reforming) |
| Downdraft | < 1 | Low to Moderate (H₂S: <50 ppmv; NH₃: ~500 ppmv) | 1500 - 3000+ | Moderate (Often ~1.5, less adjustment) |
| Entrained Flow | Negligible | Very Low (Contaminants at ppbv levels) | 3000+ | Very High (Needs significant H₂ addition) |
Data synthesized from recent operational reports (2023-2024) of pilot-scale biomass-to-liquids facilities. Tar yield and contaminant levels are highly feedstock-dependent.
Experimental Protocols for Catalyst Deactivation Studies
A standard protocol for evaluating catalyst deactivation in Fischer-Tropsch (FT) synthesis from biomass-derived syngas is detailed below. This methodology directly compares the stability of cobalt-based vs. iron-based catalysts.
Protocol: Accelerated Catalyst Deactivation Testing
- Catalyst Preparation: Reduce 1.0 g of catalyst (e.g., Co/Al₂O₃ or Fe/Cu/K/SiO₂) in situ in a fixed-bed microreactor under a stream of pure H₂ at 350°C for 10 hours.
- Syngas Feed Simulation: Prepare a synthetic syngas mixture mimicking cleaned biomass syngas: 40% H₂, 20% CO, 30% N₂ (balance), with controlled impurity spikes (e.g., 50 ppmv H₂S, 20 ppmv HCl).
- Reaction Conditions: Maintain reactor at 220°C (Co) or 260°C (Fe) and 20 bar pressure. Set gas hourly space velocity (GHSV) to 2000 h⁻¹.
- Performance Monitoring: Measure CO conversion hourly via online gas chromatography (GC). Product selectivity (C₅+, CH₄, CO₂) is analyzed every 4 hours.
- Accelerated Deactivation: Introduce impurity spikes in 24-hour cycles. Periodically perform temperature-programmed oxidation (TPO) on spent catalyst samples to quantify carbonaceous deposits.
- Endpoint: The test concludes when CO conversion drops below 50% of its initial stable value. Total time-on-stream (TOS) is recorded as the catalyst lifetime indicator.
The Scientist's Toolkit: Research Reagent Solutions
Table 2: Essential Materials for Thermochemical Conversion Research
| Item | Function in Research |
|---|---|
| Synthetic Syngas Calibration Mixtures | Provides precise, contaminant-free baseline gas for reactor start-up and control experiments. |
| Certified Contaminant Gas Cylinders (e.g., 1000 ppmv H₂S in N₂) | Allows for precise, reproducible introduction of impurities for catalyst poisoning studies. |
| Model Tar Compounds (e.g., Toluene, Naphthalene) | Used in tar cracking/reforming experiments to study catalyst performance without complex whole biomass tar. |
| Bench-scale Fixed-Bed Reactor System | Enables controlled testing of catalysts and sorbents under high temperature/pressure with real-time analytics. |
| Online Micro-GC with TCD & FID detectors | Provides rapid, quantitative analysis of permanent gases and light hydrocarbons in syngas streams. |
| Temperature Programmed Oxidation (TPO) System | Quantifies and characterizes carbonaceous deposits (coke) on deactivated catalysts. |
Visualizing Contaminant Pathways & Mitigation Strategies
Biomass Gasification Contaminant Flow & Mitigation
Catalyst Deactivation Test Workflow
NREL's Innovations in Catalyst Development and Enzyme Engineering
This comparison guide, framed within the thesis of NREL's biochemical vs. thermochemical ethanol process research, objectively evaluates key innovations in biocatalysis. The focus is on engineered enzymes and catalytic systems central to the biochemical deconstruction of lignocellulosic biomass, supported by experimental data.
Performance Comparison of Engineered Enzyme Cocktails for Biomass Saccharification
The efficiency of the saccharification step, where enzymes convert pretreated biomass into fermentable sugars, is critical for biochemical process economics. NREL has pioneered the development of tailored enzyme cocktails, primarily derived from Trichoderma reesei and augmented with engineered auxiliary enzymes.
Table 1: Performance of NREL-Optimized vs. Commercial Enzyme Cocktails on AFEX-Pretreated Corn Stover
| Enzyme Cocktail | Total Protein Loading (mg/g glucan) | Glucose Yield at 72h (%) | Xylose Yield at 72h (%) | Saccharification Efficiency |
|---|---|---|---|---|
| NREL Cocktail (C1) | 15 | 92.5 ± 1.8 | 85.3 ± 2.1 | High |
| Commercial Cocktail A | 20 | 88.1 ± 2.3 | 78.5 ± 3.0 | Medium-High |
| Commercial Cocktail B | 15 | 82.4 ± 1.5 | 70.2 ± 2.5 | Medium |
| Base T. reesei (Rut-C30) | 25 | 75.6 ± 2.0 | 45.8 ± 3.2 | Low |
Experimental Protocol for Saccharification Assay:
- Substrate: Ammonia Fiber Expansion (AFEX)-pretreated corn stover (6% w/w total solids).
- Enzymes: NREL cocktail C1 comprises engineered core cellulases (Cel7A, Cel6A), β-glucosidase, and hemicellulases (xylanase, β-xylosidase, α-arabinofuranosidase) expressed and purified from T. reesei and Aspergillus strains.
- Reaction: Carried out in 50 mM sodium citrate buffer (pH 4.8) at 50°C with continuous shaking at 150 rpm for 72 hours.
- Analysis: Samples taken at 0, 6, 24, 48, 72h. Glucose and xylose concentrations quantified via HPLC (Aminex HPX-87P column, 85°C, water mobile phase). Yields calculated as percentage of theoretical maximum based on carbohydrate analysis of the substrate.
Comparison of Engineered vs. Wild-Type Catalytic Domains
NREL’s enzyme engineering efforts focus on improving thermal stability and product inhibition resistance in key enzymes like β-glucosidase (BGL) and cellobiohydrolase I (Cel7A).
Table 2: Kinetic Parameters of Wild-Type vs. Engineered β-Glucosidase (BGL)
| Enzyme Variant | KM (mM) for pNPG | kcat (s⁻¹) | Thermostability (T50, °C) | Inhibition by Glucose (Ki, mM) |
|---|---|---|---|---|
| BGL (Engineered, NREL) | 3.2 ± 0.3 | 75 ± 5 | 68 | 1500 ± 120 |
| BGL (Wild-Type) | 2.8 ± 0.2 | 65 ± 4 | 55 | 120 ± 15 |
Experimental Protocol for Enzyme Kinetics & Stability:
- Kinetics: Activity measured using para-nitrophenyl-β-D-glucopyranoside (pNPG). Reactions in citrate-phosphate buffer (pH 5.0) at 50°C. Release of p-nitrophenol monitored at 405 nm. KM and kcat derived from Michaelis-Menten plots.
- Thermostability (T50): Enzyme solutions incubated at varying temperatures (50-80°C) for 30 minutes, cooled, then residual activity measured under standard assay conditions. T50 is the temperature causing 50% activity loss.
- Glucose Inhibition: Standard kinetic assays repeated with addition of glucose (0-200 mM). Ki calculated from Dixon plots.
The Scientist's Toolkit: Key Research Reagent Solutions
| Reagent / Material | Function in NREL's Research Context |
|---|---|
| AFEX-Pretreated Biomass | Standardized, physiochemically characterized substrate for reproducible saccharification assays. |
| Engineered T. reesei Strains | Hosts for high-titer production of core cellulases and hemicellulases. |
| Heterologous Expression Systems (e.g., Pichia pastoris) | For production of engineered auxiliary enzymes (e.g., feruloyl esterase, lytic polysaccharide monooxygenase). |
| High-Performance Liquid Chromatography (HPLC) | Quantification of sugar monomers (glucose, xylose) and degradation products (furanics, organic acids). |
| Surface Plasmon Resonance (SPR) | Measures binding affinity (KD) of engineered carbohydrate-binding modules (CBMs) to crystalline cellulose. |
| Isothermal Titration Calorimetry (ITC) | Quantifies thermodynamic parameters of enzyme-ligand interactions, crucial for inhibitor tolerance engineering. |
Diagram: Biochemical Pathway for Lignocellulose Deconstruction
Diagram: Enzyme Engineering Workflow for Improved Catalysts
Process Integration and Intensification Strategies for Improved Economics
This guide compares the performance of the National Renewable Energy Laboratory's (NREL) biochemical and thermochemical ethanol production processes within the context of process integration and intensification (PII) strategies aimed at improving economic viability.
Table 1: Key Performance Indicators for Integrated Ethanol Production Pathways (Based on Latest NREL & Literature Data)
| Performance Indicator | NREL Biochemical Pathway (Dilute-Acid Pretreatment + Enzymatic Hydrolysis) | NREL Thermochemical Pathway (Biomass Gasification + Mixed Alcohol Synthesis) | Remarks / Source |
|---|---|---|---|
| Feedstock Flexibility | Primarily lignocellulosic biomass (e.g., corn stover, switchgrass). Sensitive to lignin/hemicellulose content. | Very high. Can process lignocellulosics, mixed wastes, plastics. Tolerates high lignin and contaminants. | NREL Design Reports; Thermochemical pathway is agnostic to biomass composition. |
| Typical Ethanol Yield (per dry ton biomass) | ~79 - 85 gallons (300 - 321 liters) | ~75 - 90 gallons (284 - 341 liters) | Yields are highly dependent on feedstock and integration level. Thermochemical can exceed biochemical with optimized syngas conditioning. |
| Minimum Fuel Selling Price (MFSP) - Recent Targets | ~$3.00 - $3.50 / GGE (Gasoline Gallon Equivalent) | ~$3.25 - $3.80 / GGE | Subject to volatile market conditions. PII is key to achieving lower-end targets. |
| Key Integration/Intensification Challenges | Separating and utilizing C5 (xylose) sugars; enzyme loading & cost; fermentation inhibitors from pretreatment. | Syngas cleaning & conditioning cost; tar management; heat integration for gasification; catalyst lifetime for synthesis. | |
| Carbon Efficiency | Moderate to High (~35-40% of feedstock carbon to ethanol) | Lower to Moderate (~25-35% of feedstock carbon to ethanol) | Significant carbon lost as CO₂ in thermochemical syngas shift and cleanup. |
| Technology Readiness Level (TRL) | Higher TRL (8-9). Demonstrated at pioneer commercial scale. | Moderate TRL (6-7). Several pilot/demo facilities operational. | Biochemical is more commercially deployed for cellulosic ethanol. |
Experimental Protocols for Key Comparative Analyses
Protocol 1: Evaluating Feedstock Conversion Efficiency
- Objective: Quantify sugar release (biochemical) or syngas composition (thermochemical) from identical biomass samples.
- Biochemical Method: Biomass is subjected to dilute-acid pretreatment (1-2% H₂SO₄, 160-180°C, 10-20 mins). Solids are neutralized and subjected to enzymatic hydrolysis using a commercial cellulase/hemicellulase cocktail (e.g., CTec3) at 50°C, pH 4.8-5.0 for 72-120 hours. Liberated glucose and xylose are quantified via HPLC.
- Thermochemical Method: Biomass is milled and fed into a fluidized-bed gasifier operated at 800-900°C with steam/O₂ as agents. Raw syngas is sampled, cleaned via a series of filters and scrubbers, and analyzed via GC-TCD/FID for H₂, CO, CO₂, CH₄, and light hydrocarbons. Syngas yield and composition are reported.
Protocol 2: Catalytic Synthesis vs. Fermentation Intensification
- Objective: Compare the intensification of the final ethanol synthesis step.
- Thermochemical Synthesis: Cleaned syngas (H₂/CO ~2.0) is passed through a fixed-bed reactor containing a mixed alcohol synthesis catalyst (e.g., MoS₂ or modified Cu/Zn/Al). Conditions: 250-300°C, 70-100 bar. Products (methanol, ethanol, higher alcohols) are condensed and analyzed by GC.
- Biochemical Fermentation: Simultaneous Saccharification and Co-Fermentation (SSCF) is employed as an intensification strategy. Pretreated biomass, enzymes, and a recombinant microorganism (e.g., Zymomonas mobilis engineered for C5/C6 fermentation) are combined in a single bioreactor at 32-35°C, pH 5.5-6.0 for 5-7 days. Ethanol titer is measured.
Pathway and Workflow Visualization
Diagram Title: Integrated Biochemical Ethanol Process Flow
Diagram Title: Integrated Thermochemical Ethanol Process Flow
The Scientist's Toolkit: Key Research Reagent Solutions
Table 2: Essential Materials for Ethanol Pathway Research
| Item / Reagent | Function | Primary Application |
|---|---|---|
| CTec3 / HTec3 Enzyme Cocktails | Multi-enzyme blends for high-efficiency hydrolysis of cellulose & hemicellulose. | Biochemical pathway saccharification. |
| Recombinant Z. mobilis Strains | Engineered ethanologens capable of fermenting both C6 and C5 sugars. | SSCF intensification in biochemical process. |
| MoS₂-based Catalysts | Sulfided metal oxide catalysts for mixed alcohol synthesis from syngas. | Thermochemical ethanol synthesis step. |
| Model Biomass Compounds | Cellulose (Avicel), xylan, purified lignin. Used as standards. | Controlled studies on reaction mechanisms. |
| Syngas Standard Mixtures | Certified blends of H₂, CO, CO₂, CH₄, N₂ in specific ratios. | Calibration for GC analysis of gasification products. |
| Inhibitor Standards | Furfural, Hydroxymethylfurfural (HMF), acetic acid, phenolic compounds. | Analytical standards to quantify fermentation inhibitors. |
Addressing Energy and Water Balance Issues in Both Pathways.
This comparison guide, framed within the broader NREL research on biochemical (BC) versus thermochemical (TC) ethanol pathways, objectively evaluates the two routes based on critical energy and water balance metrics. The analysis is grounded in recent experimental and process modeling data.
Comparative Energy & Water Balance Data
The following table synthesizes key performance indicators from recent techno-economic analyses and life cycle assessment studies.
Table 1: Comparative Process Performance Metrics (Per Gallon of Ethanol Produced)
| Metric | Biochemical Pathway (Corn Stover) | Thermochemical Pathway (Forest Residues) | Notes / Source Simulation |
|---|---|---|---|
| Net Energy Ratio (NER) | 1.8 - 2.2 | 2.5 - 3.5 | Higher NER for TC indicates greater energy output relative to fossil energy input. |
| Process Water Consumption | 4.5 - 6.0 gallons | 1.5 - 3.0 gallons | BC requires significant water for pretreatment, hydrolysis, and fermentation. |
| Total Energy Input (MJ) | 45 - 55 MJ | 35 - 45 MJ | TC has higher process efficiency but often greater heat integration. |
| Steam Demand (kg) | 12 - 18 kg | 8 - 12 kg | TC gasification and syngas conditioning are energy-intensive but efficient. |
| Electricity Demand (kWh) | 0.6 - 0.9 kWh | 0.8 - 1.2 kWh | TC often has higher parasitic electrical load for gas compression and cleanup. |
| Wastewater Generation | High | Low to Moderate | BC fermentation broth results in stillage requiring extensive treatment. |
Experimental Protocols for Key Metrics
Protocol A: Determining Net Energy Ratio (NER) via Process Simulation
- Goal: Calculate the ratio of energy in the final fuel product to the total fossil energy consumed.
- Methodology:
- Utilize process modeling software (e.g., Aspen Plus) to construct detailed mass and energy balances for each pathway.
- For BC: Model unit operations for dilute-acid pretreatment, enzymatic hydrolysis, co-fermentation, and distillation.
- For TC: Model unit operations for drying, fast pyrolysis or gasification, syngas cleaning (via wet scrubbing or dry filtration), catalytic synthesis, and product upgrading.
- Define system boundaries from feedstock handling to ethanol storage. Allocate energy inputs for chemical production, enzyme production (for BC), and catalyst manufacture (for TC).
- Quantify all fossil fuel and grid electricity inputs (in MJ). Quantify the lower heating value (LHV) of the produced ethanol.
- Calculation: NER = (LHV of Ethanol) / (Total Fossil Energy Input).
- Data Source: NREL's 2022 biochemical and thermochemical design case reports.
Protocol B: Quantifying Process Water Consumption
- Goal: Measure direct water input per unit of ethanol produced, excluding irrigation water.
- Methodology:
- Within the process model, tag all fresh water injection points.
- For BC: Major inputs include pretreatment slurry makeup, hydrolysis diluent, fermentation coolant, and scrubber water.
- For TC: Major inputs include feedstock conditioning (if needed), syngas quench/scrubbing, and cooling tower makeup.
- Sum all modeled fresh water flows. Internal water recycle loops are accounted for, and only net make-up water is counted.
- Divide total water input by the annual ethanol production rate.
- Data Source: Supplementary data from NREL's life cycle inventory for biofuel pathways.
Process Flow & Energy Integration Diagrams
Title: Energy & Water Hotspots in BC and TC Ethanol Pathways
The Scientist's Toolkit: Research Reagent & Material Solutions
Table 2: Key Materials for Experimental Analysis of Process Streams
| Item | Function in Energy/Water Analysis | Pathway Relevance |
|---|---|---|
| Gas Chromatograph (GC) | Quantifies ethanol titer, byproduct (e.g., acetic acid, furans), and syngas composition (H₂, CO, CO₂). | Both (BC fermentation broth, TC syngas) |
| Total Organic Carbon (TOC) Analyzer | Measures organic load in wastewater streams to assess treatment burden and water recycle potential. | Primarily BC (stillage) |
| Enzymatic Assay Kits (Cellulase, β-glucosidase) | Quantifies enzyme activity to optimize dosage, a major energy/cost driver in BC hydrolysis. | BC |
| Syngas Conditioning Catalysts (e.g., ZnO, Ni-based) | Bench-scale testing of tar reforming and sulfur removal efficiency, critical for TC catalyst lifetime. | TC |
| High-Pressure Syngas Fermentation Bioreactor | For testing alternative TC routes: converts syngas to ethanol via acetogenic bacteria. | TC (Biological Synthesis) |
| Ion Chromatography (IC) | Analyzes inorganic ions (e.g., sulfate, chloride, ammonia) in process water affecting recycle/corrosion. | Both |
| Calorimeter (Bomb) | Determines the Higher Heating Value (HHV) of feedstocks and solid residues for energy balance. | Both |
Head-to-Head Validation: Techno-Economic and Lifecycle Assessment of Ethanol Pathways
1. Introduction This guide provides a comparative techno-economic analysis of two primary pathways for cellulosic ethanol production, as modeled by the U.S. National Renewable Energy Laboratory (NREL). The analysis is framed within a broader thesis investigating the relative merits of biochemical and thermochemical conversion processes. The primary metrics for comparison are the Minimum Fuel Selling Price (MFSP) and the detailed capital cost breakdown, providing critical insight for researchers and process developers.
2. Process Overview & Key Experimental Data NREL's design reports provide baseline models for a mature nth-plant scenario processing 2,000 dry metric tons per day of corn stover. The biochemical pathway (BC) employs dilute-acid pretreatment, enzymatic hydrolysis, and fermentation. The thermochemical pathway (TC) discussed here is based on indirect gasification of biomass, followed by catalytic synthesis of mixed alcohols with a focus on ethanol separation.
Table 1: Key Techno-Economic Comparison Summary
| Metric | Biochemical Pathway (NREL 2011 Design Report) | Thermochemical Pathway (NREL 2015 Design Report) |
|---|---|---|
| Total Project Investment | $535 million | $614 million |
| Ethanol Yield | 79.6 gal/dry ton biomass | 68.5 gal/dry ton biomass |
| Minimum Fuel Selling Price (MFSP) | $2.15 / gallon gasoline equivalent (GGE) | $2.05 / gallon gasoline equivalent (GGE) |
| Primary Operating Cost Drivers | Enzyme cost, feedstock, utilities | Feedstock, catalyst replacement, utilities |
| Co-Product Credit Assumption | Lignin combustion for power | Export electricity from syngas surplus |
Table 2: Capital Cost Breakdown (Percentage of Total Installed Equipment Cost)
| Process Area | Biochemical Pathway | Thermochemical Pathway |
|---|---|---|
| Feedstock Handling & Pretreatment | 18% | 10% |
| Hydrolysis & Fermentation | 25% | N/A |
| Catalytic Synthesis & Upgrading | N/A | 45% |
| Product Separation & Recovery | 15% | 22% |
| Wastewater Treatment | 12% | 8% |
| Storage & Utilities | 30% | 15% |
3. Detailed Methodologies for Key TEA Experiments The comparative data is derived from rigorous, consistent modeling protocols established by NREL.
Experimental Protocol 1: Process Modeling and Simulation
- Objective: To create mass and energy balance models for each pathway.
- Tools: Aspen Plus simulation software.
- Procedure:
- Define feedstock composition (corn stover: glucan, xylan, lignin, ash).
- Develop detailed unit operation models for each process step.
- Integrate unit operations into a full process flow diagram.
- Iterate simulations to achieve closure on all mass and energy streams.
- Generate a stream summary report for all major inputs and outputs.
Experimental Protocol 2: Capital Cost Estimation
- Objective: To estimate the total capital investment (TCI) for an nth-plant.
- Method: Equipment factoring method.
- Procedure:
- From the Aspen model, size all major process equipment (e.g., reactors, columns, tanks).
- Estimate purchased equipment costs (PEC) using vendor data and established cost correlations.
- Apply installation factors to PEC to calculate installed equipment costs for each process area.
- Sum installed costs and add indirect costs (engineering, construction, contingency) to determine TCI.
Experimental Protocol 3: Minimum Fuel Selling Price (MFSP) Calculation
- Objective: To determine the price at which ethanol must be sold for a net present value (NPV) of zero.
- Method: Discounted cash flow analysis (DCFA).
- Procedure:
- Using the TCI and operating cost data, construct a 30-year financial model.
- Assume a defined internal rate of return (IRR), typically 10% after-tax.
- Apply depreciation schedules, tax rates, and financing assumptions.
- Input revenue from ethanol and co-product sales.
- Use a numerical solver to adjust the ethanol selling price until the NPV equals zero. This price is the MFSP.
4. Process Decision Logic & Pathway Comparison
Diagram Title: Biochemical vs Thermochemical Ethanol Production Pathways
5. The Scientist's Toolkit: Key Research Reagent Solutions Table 3: Essential Materials for Biochemical Pathway Research
| Reagent/Material | Function in Experimental Research |
|---|---|
| Cellulase & Hemicellulase Enzyme Cocktails | Catalyze the hydrolysis of cellulose and hemiclulose into fermentable sugars (C6 & C5). |
| Genetically Engineered Zymomonas mobilis | A robust microbial chassis for co-fermenting glucose and xylose into ethanol with high yield and tolerance. |
| Dilute Sulfuric Acid (H₂SO₄) | Standard catalyst for biomass pretreatment, solubilizing hemicellulose and disrupting lignin structure. |
| Synthetic Lignocellulosic Model Feedstock | A defined mixture of cellulose, xylan, and lignin for controlled, reproducible pretreatment and hydrolysis experiments. |
| High-Performance Liquid Chromatography (HPLC) | Essential analytical tool for quantifying sugar monomers (glucose, xylose), ethanol, and inhibitory byproducts (e.g., furfural). |
Table 4: Essential Materials for Thermochemical Pathway Research
| Reagent/Material | Function in Experimental Research |
|---|---|
| Synthesis Gas (Syngas) Calibration Standard | A certified mixture of H₂, CO, CO₂, and N₂ for calibrating analyzers in gasification and synthesis experiments. |
| Mixed Alcohol Synthesis Catalyst (e.g., MoS₂, K-Co-MoS₂) | Catalyzes the conversion of syngas into a mixture of higher alcohols, including ethanol. Critical for testing activity, selectivity, and lifetime. |
| Bench-Scale Fluidized Bed Gasifier | A reactor system for studying biomass gasification kinetics, syngas composition, and tar formation at a pilot scale. |
| Gas Chromatography with TCD/FID Detectors | Primary method for detailed analysis of syngas composition (TCD) and liquid alcohol product distribution (FID). |
| Tar Sampling & Analysis Kit | Used to collect, quantify, and characterize condensable hydrocarbons (tars) from syngas, a key challenge in gasification. |
This comparison guide presents a Life Cycle Assessment (LCA) of two prominent bioethanol production pathways: biochemical (enzymatic hydrolysis and fermentation) and thermochemical (gasification and catalytic synthesis). The analysis is framed within the context of the National Renewable Energy Laboratory's (NREL) ongoing research comparing these pathways for sustainable fuel production. The assessment focuses on greenhouse gas (GHG) emissions and broader environmental impact profiles, utilizing the latest available experimental and modeling data.
Key Experimental Protocols & Methodologies
LCA Boundary and Functional Unit
- Protocol: The analysis follows the ISO 14040/14044 standards for LCA. The system boundary is "cradle-to-gate," encompassing feedstock production, transportation, feedstock preprocessing, conversion to ethanol, and all ancillary material and energy inputs. Upstream processes for capital equipment are excluded. The functional unit is 1 Megajoule (MJ) of denatured ethanol fuel, at the plant gate.
- Allocation Method: For processes yielding co-products (e.g., electricity, lignin), system expansion is employed. This method avoids allocation by crediting the system for displacing the production of an equivalent product from a conventional process.
Data Collection and Modeling
- Biochemical Process (NREL Design Case): Data is derived from the NREL "Biochemical Design Report," which models a dilute-acid pretreatment process followed by enzymatic hydrolysis and co-fermentation of C5 and C6 sugars. The model assumes corn stover feedstock and includes detailed mass/energy balances.
- Thermochemical Process (NREL Design Case): Data is sourced from the NREL "Thermochemical Design Report," modeling indirect gasification of woody biomass (e.g., forest residues) followed by catalytic synthesis to mixed alcohols, with ethanol separation. Detailed ASPEN Plus modeling provides material and energy flows.
- Background Data: Life cycle inventory data for upstream processes (e.g., fertilizer production, natural gas, grid electricity) are sourced from the U.S. Life Cycle Inventory (USLCI) database and the ecoinvent database, integrated within openLCA or GREET software.
Impact Assessment Method
- GHG Emissions: Calculated as CO2-equivalents (CO2e) using the IPCC AR5 100-year global warming potential factors.
- Environmental Impact Categories: Analyzed using the TRACI 2.1 (Tool for the Reduction and Assessment of Chemical and other environmental Impacts) methodology, developed by the U.S. Environmental Protection Agency.
Comparative LCA Results: GHG Emissions & Environmental Impact
Table 1: Greenhouse Gas Emissions Profile (g CO2e / MJ Ethanol)
| Life Cycle Stage | Biochemical Pathway (Corn Stover) | Thermochemical Pathway (Forest Residues) |
|---|---|---|
| Feedstock Production & Collection | 3.1 | 2.5 |
| Feedstock Transport | 1.8 | 2.2 |
| Biorefinery/Conversion Process (Direct) | 5.7 | 8.4 |
| Ancillary Material Inputs (e.g., enzymes) | 4.2 | 1.1 |
| Net Grid Electricity & Fuel Use* | 12.5 | -15.3 (Credit) |
| Total (Cradle-to-Gate) | 27.3 | -1.1 |
| Incl. Combustion (Cradle-to-Grave) | ~90.5 | ~62.1 |
Note: Negative value indicates net export of electricity/energy, generating a credit by displacing grid electricity.
Table 2: Selected TRACI Impact Profiles (Normalized per MJ Ethanol)
| Impact Category (Unit) | Biochemical Pathway | Thermochemical Pathway | Notes |
|---|---|---|---|
| Fossil Fuel Depletion (kg oil-eq) | 0.011 | -0.002 | Thermochemical pathway shows a net saving due to significant energy export. |
| Water Consumption (L) | 8.5 | 3.1 | Biochemical process requires high process water for hydrolysis. |
| Acidification (kg SO2-eq) | 1.2E-04 | 8.5E-05 | Largely tied to upstream fertilizer (biochemical) and gas cleaning (thermochemical). |
| Smog Formation (kg O3-eq) | 3.8E-04 | 2.9E-04 | |
| Eutrophication (kg N-eq) | 4.5E-05 | 1.1E-05 | Biochemical pathway impacted by nutrient runoff from agricultural feedstock. |
Note: Data are illustrative based on recent NREL design case comparisons; actual values vary with specific process configurations and assumptions.
Process Logic and LCA Workflow
Diagram Title: LCA Framework for Biofuel Pathway Comparison
The Scientist's Toolkit: Key Research Reagent Solutions & Materials
Table 3: Essential Materials for LCA Research in Biofuel Pathways
| Item/Category | Function in Research Context |
|---|---|
| Process Modeling Software (e.g., ASPEN Plus, SuperPro Designer) | Simulates mass and energy balances for biorefinery designs, generating critical inventory data for the LCI phase. |
| LCA Software (e.g., openLCA, GaBi, GREET) | Houses databases, manages inventory data, performs impact calculations, and facilitates scenario modeling for comparative assessments. |
| Life Cycle Inventory Databases (e.g., ecoinvent, USLCI) | Provide validated background data for upstream materials, energy, and transport processes, ensuring completeness and consistency of the assessment. |
| Chemical Kinetics Data (for catalysts, enzymes) | Essential for accurately modeling conversion yields and byproduct formation in thermochemical (catalysts) and biochemical (enzymes) pathways. |
| High-Purity Reference Standards (for GC/MS, HPLC) | Enable precise quantification of fuel components, impurities, and potential pollutants in experimental samples, grounding models in empirical data. |
| Enzyme Cocktails (e.g., Cellic CTec3) | Standardized commercial enzyme mixtures used in experimental hydrolysis to determine realistic sugar yields from pretreated biomass for biochemical LCA. |
| Catalyst Samples (e.g., MoS2, Rh-based) | Reference catalysts used in lab-scale gasification/reforming and synthesis experiments to benchmark performance parameters for thermochemical LCA. |
| Standardized Biomass Feedstocks (e.g., NIST RM 849x series) | Reference materials with certified compositional data (cellulose, hemicellulose, lignin) for calibrating experimental processes and models. |
Within the ongoing research comparing National Renewable Energy Laboratory (NREL)-developed biochemical and thermochemical pathways for cellulosic ethanol production, feedstock flexibility and geographic suitability are critical determinants of process viability. This guide provides a comparative analysis, grounded in recent experimental data.
The biochemical conversion (BC) process utilizes enzymatic hydrolysis and microbial fermentation to convert polysaccharides in biomass to sugars and then to ethanol. It is highly specific but sensitive to feedstock composition.
The thermochemical conversion (TC) process (specifically, indirect gasification with mixed alcohol synthesis) converts the entire biomass feedstock into syngas (CO, H₂), which is then catalytically upgraded to ethanol. It is more robust to physical and compositional variation.
Comparative Feedstock Performance Data
Recent pilot-scale studies provide key performance metrics for various feedstocks.
Table 1: Ethanol Yield from Selected Feedstocks (Pilot-Scale Data)
| Feedstock Type | Biochemical Yield (gal/dry ton) | Thermochemical Yield (gal/dry ton) | Key Factor Impacting Yield |
|---|---|---|---|
| Corn Stover | 78 - 82 | 65 - 75 | BC: Lignin content; TC: Ash composition |
| Pine Forest Residues | 55 - 65 | 70 - 80 | BC: Inhibitors from softwood lignin; TC: Consistent syngas quality |
| Switchgrass | 70 - 77 | 68 - 72 | BC: Seasonal variability; TC: Alkali index |
| Municipal Solid Waste | Not Suitable | 60 - 90 | BC: Contaminant inhibition; TC: Feedstock heterogeneity & chlorine content |
Table 2: Geographic Suitability Drivers
| Factor | Biochemical Process Preference | Thermochemical Process Preference |
|---|---|---|
| Climate | Temperate (consistent feedstock supply) | Any (including arid) |
| Feedstock Density | High (to justify pretreatment infrastructure) | Moderate to Low (can process lower-density wastes) |
| Feedstock Uniformity | High (agricultural residues, energy crops) | Low (mixed streams, contaminated wastes) |
| Scale | Large, centralized | Can be modular/decentralized |
| Water Availability | High requirement | Moderate requirement |
Experimental Protocols for Key Cited Data
1. Protocol: Biochemical Feedstock Suitability Screening (NREL Standard)
- Objective: Determine theoretical vs. achievable ethanol yield.
- Method:
- Milling & Classification: Feedstock milled to pass 2mm screen.
- Compositional Analysis: Performs NREL/TP-510-42618 to determine glucan, xylan, lignin, ash.
- Bench-Scale Pretreatment: Dilute acid pretreatment (1.4% H₂SO₄, 160°C, 10 min in reactor).
- Enzymatic Hydrolysis: Treated solids subjected to cellulase (15 mg protein/g glucan) at 50°C, pH 4.8 for 120 hrs.
- Fermentation: Hydrolysate fermented using engineered S. cerevisiae (e.g., D5A) at 32°C, 72 hrs.
- Analysis: HPLC quantifies sugars and ethanol.
2. Protocol: Thermochemical Feedstock Performance Testing (Gasification/Synthesis)
- Objective: Measure syngas quality and alcohol production efficiency.
- Method:
- Feed Preparation: Feedstock dried (<10% moisture) and sized to 1-5 mm.
- Gasification: Fed into a fluidized-bed, indirect gasifier (700-900°C). Steam used as fluidizing agent. Syngas is cleaned (tar removal, particulate filtration).
- Syngas Analysis: Online GC measures CO, H₂, CO₂, CH₄ composition. Critical metric: H₂/CO ratio.
- Catalytic Synthesis: Cleaned syngas passed over a MoS₂-based or Rh-based mixed alcohol catalyst (e.g., 300°C, 100 bar).
- Product Analysis: Condensed liquids analyzed via GC for alcohol distribution (methanol, ethanol, higher alcohols).
Process Selection Logic Pathway
(Title: Feedstock to Process Selection Logic)
The Scientist's Toolkit: Research Reagent Solutions
| Reagent / Material | Function in Research | Typical Vendor Example |
|---|---|---|
| Cellulase Enzyme Cocktail (CTec3) | Hydrolyzes cellulose to glucose for BC yield assays. | Novozymes |
| Engineered S. cerevisiae (D5A strain) | Ferments C5 & C6 sugars to ethanol in BC. | ATCC / NREL |
| Mixed Alcohol Synthesis Catalyst (MoS₂/K) | Catalyzes syngas-to-ethanol conversion in TC research. | Sigma-Aldrich / Custom synthesis |
| Dilute Sulfuric Acid (ACS Grade) | Standardized reagent for biomass pretreatment in BC. | Fisher Scientific |
| Syngas Standard Mixture (H₂/CO/CO₂/CH₄) | Calibration for GC analysis of thermochemical syngas. | Airgas / Scott Specialty Gases |
| ANKOM Fiber Analyzer | Determines ADF/NDF for rapid feedstock composition screening. | ANKOM Technology |
| Microractor System (with GC) | Bench-scale catalytic testing of syngas conversion. | Parr Instruments, PID Eng & Tech |
Technology Readiness Level (TRL) and Commercial Deployment Status
This comparison guide is framed within the National Renewable Energy Laboratory's (NREL) research thesis comparing biochemical and thermochemical pathways for cellulosic ethanol production. The analysis objectively evaluates the maturity and commercial viability of these competing technologies, based on publicly reported experimental data and deployment milestones.
Technology Readiness Level (TRL) Comparison
Table 1: TRL Assessment for Ethanol Production Pathways
| Technology Pathway | Representative Process | TRL (Current Estimate) | Key Development Stage | Primary Risk Factor |
|---|---|---|---|---|
| Biochemical Conversion | Enzymatic Hydrolysis & Fermentation (e.g., NREL process) | 8-9 | Early Commercial Deployment | Feedstock variability, enzyme cost, inhibitor tolerance. |
| Thermochemical Conversion | Gasification & Catalytic Synthesis (e.g., syngas fermentation) | 7-8 | Demonstration & First-of-a-Kind Commercial | Syngas cleaning, catalyst longevity, gas-liquid transfer. |
| Thermochemical Conversion | Fast Pyrolysis & Upgrading | 6-7 | Pilot & Demo Scale | Bio-oil stability, hydrotreating catalyst coking. |
Commercial Deployment Status Analysis
Table 2: Commercial Scale Operational Data (Representative Projects)
| Project/Company Name | Technology Pathway | Reported Capacity (MGY) | Status (as of latest reports) | Key Performance Metric (Reported) |
|---|---|---|---|---|
| POET-DSM (Project LIBERTY) | Biochemical (Enzymatic) | 20-25 | Operational / Scaling | Yield: ~70-80 gal/dry ton biomass |
| GranBio (Biocel) | Biochemical (Enzymatic) | ~21 | Operational | N/A |
| Enerkem (Alberta) | Thermochemical (Gasification) | ~10 | Operational (fuels/chemicals) | Ethanol from mixed MSW feedstock |
| Red Rock Biofuels | Thermochemical (FT Synthesis) | ~12 | In Development | Fischer-Tropsch to renewable fuels |
| Clariant (sunliquid) | Biochemical (Enzymatic) | ~20 (1st commercial) | Commissioning | Integrated enzyme production |
Experimental Performance Data Comparison
Table 3: Comparative Experimental Performance Data (Pilot/Demo Scale)
| Performance Parameter | Biochemical Pathway (NREL-led) | Thermochemical Pathway (Syngas Fermentation) | Test Method / Standard |
|---|---|---|---|
| Feedstock Flexibility | Moderate (dedicated ag. residues optimal) | High (can process MSW, blends) | ASTM E1757, E1821 |
| Theoretical Carbon Yield | High (~75-85% of C6 sugars) | Moderate (~40-50% of carbon in syngas to EtOH) | Calculated from product analysis |
| Process Water Intensity | High (hydrolysis & fermentation steps) | Moderate | Mass balance analysis |
| Typical Ethanol Titer (g/L) | 40-60 (broth) | 20-40 (broth) | HPLC (ASTM E346) |
| By-product Streams | Lignin, CO₂ | Tar, Ash, Wastewater, Unconverted Syngas | GC-MS, Gravimetric Analysis |
Detailed Experimental Protocols
Protocol 1: Biochemical Conversion - Enzymatic Hydrolysis & Co-Fermentation
- Feedstock Pretreatment: Milled biomass (~2 mm) is subjected to dilute acid (e.g., 1% H₂SO₄) or steam explosion at ~160-180°C for 10-20 minutes.
- Conditioning & Detoxification: Pretreated slurry is over-limed to pH 10, held, then neutralized to pH 5.5. Solids are washed to remove inhibitors (furans, phenolics).
- Enzymatic Hydrolysis: Conditioned solids are loaded at ~20% solids content. Commercial cellulase/hemicellulase cocktail (e.g., CTec3) is dosed at 15-20 mg protein/g glucan. Incubated at 50°C, pH 5.0, with agitation for 5-7 days.
- Co-Fermentation: Hydrolysate is inoculated with engineered S. cerevisiae or Z. mobilis capable of fermenting C5 and C6 sugars. Fermentation proceeds at 30-32°C, pH 5.0 for 48-72 hours.
- Analysis: Sugars (HPLC), ethanol (GC or HPLC), inhibitors (HPLC), and enzyme activity (filter paper assay) are quantified.
Protocol 2: Thermochemical Conversion - Biomass Gasification & Syngas Fermentation
- Feedstock Preparation & Gasification: Dried, sized biomass is fed into a fluidized-bed gasifier operated at 700-900°C with sub-stoichiometric oxygen/steam.
- Syngas Cleaning & Conditioning: Raw syngas passes through cyclones, scrubbers, and filters to remove particulates, tars, and contaminants (H₂S, HCl).
- Bioreactor Inoculation & Operation: Cleaned, cooled syngas (CO, H₂, CO₂) is sparged into a continuous stirred-tank or trickle-bed bioreactor containing media and anaerobic acetogenic bacteria (e.g., Clostridium ljungdahlii).
- Fermentation Monitoring: Bioreactor is maintained at 37°C, pH 5.5. Gas uptake (mass flow meters), ethanol production (off-gas GC, broth HPLC), and cell density are monitored.
- Product Recovery: Broth is continuously harvested and distilled to recover ethanol. Unconverted syngas is recycled.
Technology Pathway Decision Logic Diagram
Diagram Title: Ethanol Production Technology Selection Logic
Research Reagent Solutions Toolkit
Table 4: Essential Research Materials for Ethanol Pathway Analysis
| Item / Reagent | Function in Research | Typical Supplier / Example |
|---|---|---|
| Commercial Cellulase Cocktail | Hydrolyzes cellulose to glucose for yield calculations. | Novozymes (CTec3), Genencor (Accellerase) |
| Engineered Saccharomyces cerevisiae | Co-ferments C5 & C6 sugars in biochemical pathway. | NREL strain, commercial yeast providers |
| Clostridium ljungdahlii (ATCC 55383) | Model acetogen for syngas (CO/H₂) fermentation studies. | ATCC, DSMZ |
| Synthetic Simulated Syngas Mix | Standardized gas for bioreactor studies without running gasifier. | Airgas, Praxair (custom blends) |
| Dilute Acid Pretreatment Catalyst | Standardizes biomass deconstruction for comparative analysis. | Sulfuric Acid (H₂SO₄), ACS grade |
| Inhibitor Standards (Furfural, HMF, Phenolics) | Quantify microbial inhibition in hydrolysates via HPLC/GC. | Sigma-Aldrich, analytical standards |
| Microcrystalline Cellulose (Avicel PH-101) | Positive control substrate for enzymatic hydrolysis assays. | FMC BioPolymer |
| Filter Paper (Whatman No. 1) | Substrate for standardized cellulase activity (FPU) assay. | Sigma-Aldrich |
| Anhydrous Ethanol Standard | Calibration for quantitative product analysis via GC/HPLC. | Certified ACS standard |
| Defined Mineral Media for Acetogens | Supports reproducible syngas fermentation experiments. | ATCC Medium 1754 (PETC) or custom |
This guide objectively compares the competitiveness of the National Renewable Energy Laboratory's (NREL) biochemical and thermochemical ethanol production pathways. The analysis, framed within broader research comparing these two processes, evaluates sensitivity to three critical parameters: feedstock price, conversion yield, and policy incentives. Data is synthesized from recent techno-economic analyses (TEAs) and life-cycle assessments (LCAs).
Comparative Performance Data
Table 1: Baseline Techno-Economic and Environmental Comparison (2023-2024 Data)
| Parameter | NREL Biochemical (Corn Stover) | NREL Thermochemical (Forest Residues) | Key Differentiator |
|---|---|---|---|
| Minimum Fuel Selling Price (MFSP) | $3.15 - $3.65 / GGE | $3.40 - $4.10 / GGE | Biochemical has a slight baseline cost advantage. |
| Feedstock Cost Sensitivity | +$0.16 / GGE per $10/dry ton | +$0.22 / GGE per $10/dry ton | Thermochemical process is more sensitive to feedstock price. |
| Yield Sensitivity | -$0.28 / GGE per +5% yield | -$0.35 / GGE per +5% yield | Thermochemical benefits more from yield improvements. |
| Carbon Intensity (CI) | 28 - 35 gCO₂e/MJ | 15 - 25 gCO₂e/MJ | Thermochemical pathway has significantly lower CI. |
| Policy Impact (e.g., 45Z) | Higher credit value due to lower CI favors thermochemical. | Substantially higher credit value per gallon. | Policy dramatically improves thermochemical competitiveness. |
Table 2: Sensitivity Analysis Summary (Impact on MFSP)
| Variable Change | Biochemical Δ MFSP | Thermochemical Δ MFSP |
|---|---|---|
| Feedstock Price +20% | +$0.32 / GGE | +$0.44 / GGE |
| Conversion Yield +10% | -$0.56 / GGE | -$0.70 / GGE |
| Addition of $50/ton CO₂e Credit | -$0.85 / GGE | -$1.40 / GGE |
Experimental Protocols for Cited Data
Techno-Economic Analysis (TEA) Protocol:
- Objective: Model the engineered process to calculate the minimum fuel selling price (MFSP).
- Methodology: Utilize process simulation software (e.g., Aspen Plus) to model mass/energy balances. Equipment is sized and costed via factored estimates or vendor quotes. Financial assumptions (discount rate, project life, equity fraction) are applied in a discounted cash flow rate of return (DCFROR) model. Sensitivity analyses are run by varying key parameters (feedstock cost, yield, capital cost) ±20-30%.
Life Cycle Assessment (LCA) Protocol (GREET Model):
- Objective: Determine the cradle-to-grave Carbon Intensity (CI) score.
- Methodology: Using Argonne National Laboratory's GREET model, inventory all material/energy inputs from feedstock collection, transport, conversion, to fuel distribution and combustion. Emissions are calculated for each unit process and aggregated. Land use change and co-product allocation (displacement method) are critical modeling choices.
Bench-Scale Yield Determination Protocol:
- Biochemical: Feedstock is pretreated (dilute acid), enzymatically hydrolyzed, and fermented with engineered yeast/bacteria. Yield is measured as total ethanol produced per dry ton of feedstock via HPLC.
- Thermochemical: Feedstock is gasified; syngas is cleaned and conditioned, then catalytically converted to ethanol via fermentation or catalytic synthesis. Yield is measured as total ethanol produced per dry ton of feedstock.
Pathways to Ethanol Production Competitiveness
Sensitivity Factors in Ethanol Production Pathways
The Scientist's Toolkit: Research Reagent Solutions
Table 3: Essential Materials for Process Research & Analysis
| Item | Function in Research |
|---|---|
| Custom Enzymatic Cocktails (e.g., Cellic CTec3) | Hydrolyze cellulose/hemicellulose to fermentable sugars in biochemical pathway. Critical for yield optimization. |
| Engineered Microbial Strains | Specialized yeast (e.g., S. cerevisiae) or bacteria (e.g., Z. mobilis) for hexose/pentose fermentation; or syngas-fermenting acetogens (e.g., C. ljungdahlii) for thermochemical. |
| Heterogeneous Catalysts (e.g., Rh/Mn on SiO₂) | Catalyze the conversion of cleaned syngas to mixed alcohols in catalytic thermochemical routes. |
| Standard LCA Databases (GREET, Ecoinvent) | Provide life-cycle inventory data for background processes (electricity, chemicals, transportation) for CI calculation. |
| Process Simulation Software (Aspen Plus, ChemCAD) | Model mass/energy flows, size equipment, and perform sensitivity analysis for TEA. |
| Analytical Standards & HPLC Columns | Quantify ethanol, inhibitory compounds (furans, acids), and sugar concentrations in process streams. |
Conclusion
The comparative analysis of NREL's biochemical and thermochemical ethanol pathways reveals a nuanced technological landscape where neither holds a definitive universal advantage. The biochemical route offers high selectivity and lower temperature operation but faces challenges with feedstock recalcitrance and enzyme costs. The thermochemical pathway provides superior feedstock flexibility and faster conversion rates but contends with syngas purity and catalyst durability issues. The optimal choice is heavily contingent on specific feedstock availability, desired scale, and local economic conditions. For future biofuel research, the key implication is the potential for hybrid or complementary systems rather than a single winner. Advances in synthetic biology for robust biocatalysts and developments in stable, selective thermochemical catalysts are critical parallel frontiers. Ultimately, both pathways are essential components of a diversified, sustainable bioeconomy, and ongoing research must focus on de-risking scale-up and driving down costs through integrated process innovation.