Biochemical vs Thermochemical Conversion: A Comparative Analysis for Sustainable Biomass Valorization
This article provides a comprehensive comparison of biochemical and thermochemical conversion pathways for researchers, scientists, and professionals in bioenergy and sustainable technology development.
Biochemical vs Thermochemical Conversion: A Comparative Analysis for Sustainable Biomass Valorization
Abstract
This article provides a comprehensive comparison of biochemical and thermochemical conversion pathways for researchers, scientists, and professionals in bioenergy and sustainable technology development. It explores the fundamental principles, operational mechanisms, and specific applications of each method, addressing key technological bottlenecks and optimization strategies. The analysis synthesizes current research to evaluate the energy and environmental performance of these pathways, offering a validated framework for selecting appropriate conversion technologies based on feedstock characteristics and desired end-products. By integrating techno-economic and life-cycle assessments, this review serves as a critical resource for advancing biomass conversion strategies within a circular bioeconomy context.
Understanding Biomass Conversion Pathways: Core Principles and Feedstock Fundamentals
Defining Biochemical and Thermochemical Conversion Paradigms
The transition toward a sustainable, bio-based economy necessitates efficient methods for converting renewable biomass into fuels, chemicals, and power. Two dominant technological paradigms have emerged for this transformation: biochemical conversion and thermochemical conversion. These pathways represent fundamentally different approaches to valorizing biomass, each with distinct operational parameters, product slates, and optimal applications. Biochemical conversion employs biological catalysts like enzymes and microorganisms to break down biomass typically at low temperatures and pressures, while thermochemical conversion utilizes heat and chemical catalysts to decompose biomass at elevated temperatures [1]. Understanding the technical specifications, experimental parameters, and performance metrics of these paradigms is crucial for researchers and industry professionals selecting appropriate technologies for specific feedstocks and desired products within integrated biorefinery frameworks.
The growing strategic importance of these pathways is reflected in market projections. The global biorefinery market, valued at USD 212.05 billion in 2024, is expected to reach USD 468.51 billion by 2034, growing at a compound annual growth rate (CAGR) of 8.25% [2]. Similarly, the biomass power generation market is projected to grow from US$90.8 billion in 2024 to US$116.6 billion by 2030 [3]. This analysis provides a structured comparison of these core conversion paradigms, presenting key experimental data, methodological protocols, and technical visualizations to inform research and development activities.
Core Principles and Process Mechanisms
Biochemical Conversion Fundamentals
Biochemical conversion relies on biological catalysts to deconstruct biomass into simpler molecules through controlled biological processes. This paradigm operates under mild temperature and pressure conditions, typically ranging from 20°C to 60°C and at or near atmospheric pressure [1]. The primary mechanisms include:
- Enzymatic Hydrolysis: Specialized enzymes (cellulases, hemicellulases) catalyze the breakdown of complex carbohydrates in lignocellulosic biomass into fermentable sugars like glucose and xylose.
- Fermentation: Microorganisms (yeast, bacteria) metabolize sugars to produce target molecules such as ethanol, organic acids, or biogas. This can occur via submerged fermentation or solid-state fermentation systems.
- Anaerobic Digestion: Microbial consortia in oxygen-free environments progressively convert organic matter into biogas (primarily methane and carbon dioxide) through stages of hydrolysis, acidogenesis, acetogenesis, and methanogenesis.
The biochemical pathway is particularly suitable for starch-rich, sugar-rich, or moist biomass feedstocks and enables high selectivity for specific target molecules with minimal energy input for temperature control.
Thermochemical Conversion Fundamentals
Thermochemical conversion utilizes thermal energy and chemical reactions to transform biomass, operating at significantly higher temperatures (300-1500°C) and often at elevated pressures [1]. The principal technologies include:
- Pyrolysis: Thermal decomposition of biomass in the complete absence of oxygen at temperatures typically between 300-600°C to produce bio-oil, biochar, and syngas. Catalytic pyrolysis employing catalysts like copper oxide (CuO) or titanium dioxide (TiO₂) enhances bio-oil quality by boosting yields of valuable compounds like furfural and levoglucosan [4].
- Gasification: Partial oxidation of biomass at high temperatures (800-1500°C) to produce syngas (primarily CO and H₂), which can be catalytically upgraded to fuels and chemicals.
- Combustion: Complete oxidation of biomass with excess air to generate heat and power, typically used in direct firing systems or co-firing applications.
Thermochemical processes excel at handling heterogeneous, dry, and lignocellulosic biomass with high throughput and conversion rates, though they may require more sophisticated emission control systems.
Table 1: Fundamental Operational Parameters of Conversion Pathways
| Parameter | Biochemical Conversion | Thermochemical Conversion |
|---|---|---|
| Operating Temperature | 20-60°C (mesophilic) [1] | 300-1500°C [1] [4] |
| Operating Pressure | Near atmospheric [1] | Often elevated (process-dependent) |
| Primary Catalysts | Enzymes, microorganisms [1] | Chemical catalysts (e.g., CuO, TiO₂) [4] |
| Reaction Environment | Aqueous, controlled pH | High-temperature, oxidative/reductive |
| Dominant Mechanisms | Hydrolysis, fermentation, digestion | Pyrolysis, gasification, combustion |
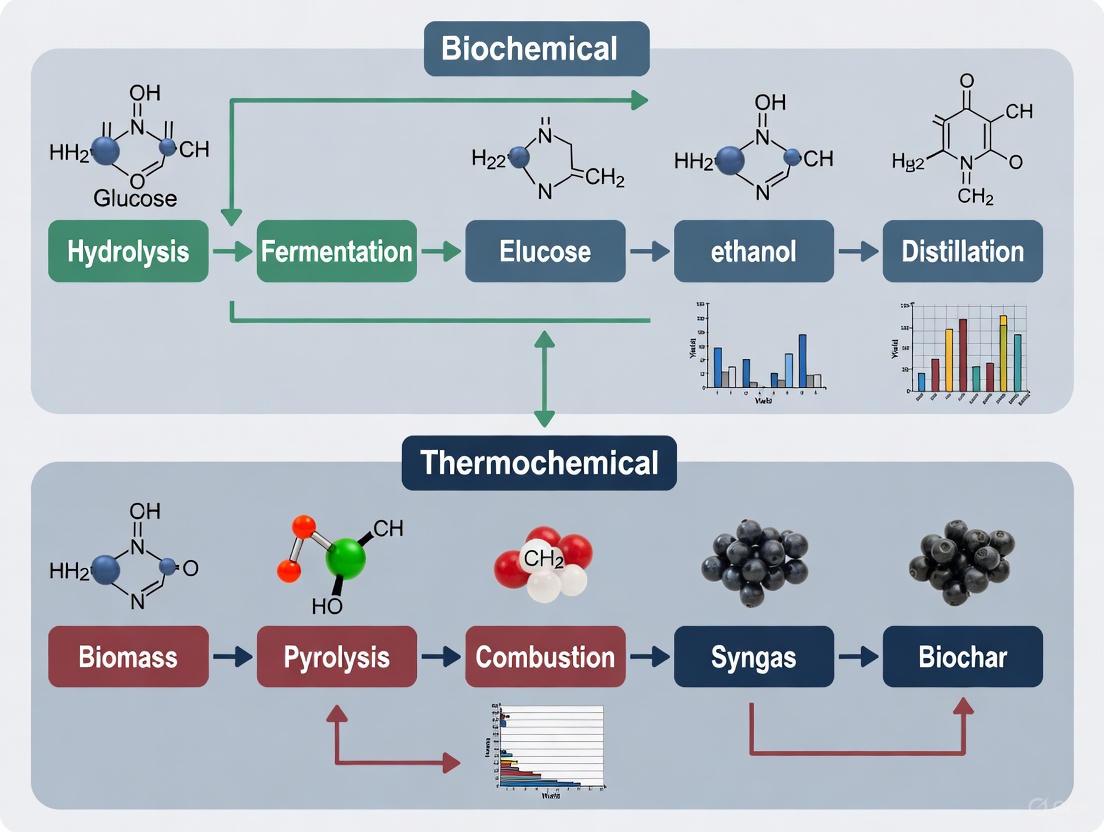
Process Workflow and Pathway Logic
The following diagram illustrates the logical workflow and decision pathways for selecting and implementing biochemical versus thermochemical conversion processes, highlighting key decision points and product outcomes.
Experimental Data and Performance Metrics
Conversion Efficiency and Product Yields
Rigorous experimental studies provide critical performance data for comparing conversion pathway efficiencies. Optimized refuse-derived fuel pyrolysis can yield up to 67.9 wt% liquid oil, while gasification produces syngas with heating values up to 10.9 MJ m⁻³ [5]. In cement kiln applications, thermochemical co-processing achieves thermal substitution rates of 50-60% in rotary kilns and 80-100% in calciners [5]. For biochemical systems, agricultural biomass converted to biochar and hydrochar demonstrates significant crop yield improvements of 19.9–36.9% when applied to soil [6].
Machine learning-optimized biochar production can achieve specific surface areas up to 400.0 m²/g, with remarkable environmental remediation capabilities: heavy metal immobilization in soils with efficiencies exceeding 90.0% and contaminant removal from wastewater with efficiencies of 84.0–90.0% for heavy metals and 96.5% for organic pollutants [6]. These metrics highlight the technical capabilities of advanced thermochemical processes.
Table 2: Quantitative Performance Metrics for Conversion Pathways
| Performance Metric | Biochemical Conversion | Thermochemical Conversion |
|---|---|---|
| Typical Fuel Yield | Ethanol: ~70-90% theoretical [7] | Bio-oil: Up to 67.9 wt% [5] |
| Byproduct Generation | Stillage, CO₂ | Biochar, ash, syngas |
| Process Efficiency | ~40-60% (energy basis) | ~60-80% (energy basis) [5] |
| Carbon Conversion | ~60-80% | ~75-95% [5] |
| Scale (Typical) | Demonstration to Commercial | Pilot to Commercial |
| Reaction Time | Hours to days | Seconds to minutes |
Economic and Environmental Impact Indicators
Techno-economic and life cycle assessment studies provide crucial data for comparing the sustainability and economic viability of conversion pathways. Thermochemical biochar production shows promising environmental metrics, with greenhouse gas emission reductions of 1.5 to 3.5 tCO₂-eq per ton and production costs as low as $116.0/ton for biochar and $30.0/ton for hydrochar [6]. However, bio-based intermediates face significant economic challenges, with bionaphtha maintaining premiums of $800-$900/mt over fossil naphtha as of H2 2025 [8].
A comparative study of lignocellulosic ethanol conversion processes found that biochemical and thermochemical processes have "very comparable yields, economics, and environmental impacts" when standardized assumptions are applied [7]. This suggests that feedstock availability, local infrastructure, and policy frameworks may be more significant determinants of pathway selection than inherent technical superiority.
Experimental Protocols and Methodologies
Thermochemical Conversion Experimental Protocol: Catalytic Pyrolysis
The following detailed methodology outlines a representative experimental approach for catalytic pyrolysis of lignocellulosic biomass, adapted from recent research [4]:
Feedstock Preparation and Characterization:
- Collect biomass samples (e.g., coffee straw, eucalyptus residues).
- Dry at 105°C for 24 hours to reduce moisture content below 10%.
- Mill and sieve to achieve uniform particle size (typically 0.5-1.0 mm).
- Perform proximate analysis (moisture, volatile matter, fixed carbon, ash) and ultimate analysis (C, H, N, S, O) following standard ASTM methods.
- Conduct compositional analysis to determine cellulose, hemicellulose, and lignin content.
Catalyst Preparation:
- Select appropriate catalysts (e.g., copper oxide-CuO, titanium dioxide-TiO₂).
- Prepare catalyst solutions at specified concentrations.
- Employ impregnation method: mix biomass with catalyst solution, stir continuously for 4-6 hours, then dry at 105°C for 12 hours.
- Calculate catalyst loading percentage based on dry biomass weight.
Pyrolysis Experimental Setup:
- Utilize a pyrolyzer coupled with gas chromatography/mass spectrometry (Py-GC/MS) for analytical pyrolysis.
- For bench-scale systems: employ a fixed-bed reactor with temperature control, inert gas (N₂) supply, and condensation system.
- Calibrate temperature sensors and flow controllers before experimentation.
Experimental Operation:
- Load catalyst-impregnated biomass sample into the reactor.
- Purge the system with inert gas (N₂) at 100-200 mL/min for 15-20 minutes to ensure oxygen-free environment.
- Heat the reactor to target temperatures (typically 300, 400, 500, and 600°C) at a controlled heating rate (10-50°C/min).
- Maintain at target temperature for 15-30 minutes to complete reactions.
- Collect condensable vapors in cooling traps maintained at 0-4°C to obtain bio-oil.
- Measure non-condensable gases using gas bags or online analyzers.
- Quantify solid residue (biochar) after reactor cooling.
Product Analysis and Characterization:
- Weigh bio-oil, biochar, and gas fractions to determine mass balance.
- Analyze bio-oil composition using GC/MS with appropriate column and temperature program.
- Quantify major compounds (acetic acid, furfural, levoglucosan) using calibration curves with standards.
- Characterize biochar for proximate analysis, surface area (BET method), and heating value.
Biochemical Conversion Experimental Protocol: Anaerobic Digestion of Food Waste
This protocol details the methodology for biochemical conversion of food waste through anaerobic digestion, based on current research [9]:
Feedstock Collection and Preparation:
- Collect representative food waste samples from targeted sources (e.g., dairy, cafeteria, processing facilities).
- Homogenize using a mechanical grinder to achieve uniform particle size (<2 mm).
- Characterize physicochemical properties: pH, total solids (TS), volatile solids (VS), chemical oxygen demand (COD), and elemental composition.
- Determine carbohydrate, protein, and fat content using standard methods.
Inoculum Acclimation:
- Source anaerobic sludge from operating digesters treating similar waste streams.
- Acclimate inoculum by gradual exposure to food waste over 2-3 weeks.
- Monitor biogas production and volatile fatty acid (VFA) profiles during acclimation.
Experimental Setup:
- Use batch reactors (e.g., 500 mL-1L serum bottles) with rubber septa and aluminum crimps.
- Maintain mesophilic (35±2°C) or thermophilic (55±2°C) conditions in temperature-controlled incubators.
- Include controls with inoculum only to account for background gas production.
- Set up triplicate reactors for each experimental condition.
Process Operation and Monitoring:
- Load reactors with predetermined substrate-to-inoculum ratios (typically 0.5-2.0 gVS/gVS).
- Add necessary nutrients and micronutrients based on feedstock characteristics.
- Adjust initial pH to 6.8-7.2 using buffer solutions if needed.
- Flush headspace with nitrogen gas for 2 minutes to ensure anaerobic conditions.
- Monitor daily biogas production using water displacement or pressure transducers.
- Sample periodically for pH, VFA, and COD analysis.
Analytical Methods:
- Analyze biogas composition (CH₄, CO₂, H₂S) using gas chromatography with thermal conductivity detector.
- Determine VFA profile (C2-C6) using gas chromatography with flame ionization detector.
- Calculate methane yield based on VS added and removed.
- Perform kinetic modeling of methane production using first-order or modified Gompertz models.
Research Reagent Solutions and Essential Materials
The following table details key research reagents, catalysts, and essential materials required for experimental investigations in biomass conversion pathways.
Table 3: Essential Research Reagents and Materials for Conversion Studies
| Reagent/Material | Function/Application | Specifications & Alternatives |
|---|---|---|
| Copper Oxide (CuO) | Catalyst for thermochemical processes; enhances furfural yield in pyrolysis [4] | Purity >99%, nanopowder available; Alternatives: Zeolites (ZSM-5), Ni-based catalysts |
| Titanium Dioxide (TiO₂) | Catalyst for pyrolysis; improves bio-oil quality [4] | Anatase or rutile phase; Purity >99%; Can be doped with metals |
| Cellulase Enzymes | Hydrolyzes cellulose to glucose in biochemical conversion | From Trichoderma reesei; Activity >500 U/mg; Commercial blends available |
| Methanogenic Inoculum | Microbial consortium for anaerobic digestion | From operating anaerobic digesters; Pre-acclimated to substrate |
| Lignocellulosic Biomass | Primary feedstock for conversion processes | Standard reference materials available; Characterized for composition |
| Analytical Standards | Quantification of products (GC/MS, HPLC) | Furfural, levoglucosan, VFA mix, methane |
| Buffer Solutions | pH control in biochemical processes | Phosphate, carbonate buffers; pH indicators |
| Inert Gases | Create anaerobic environments for biochemical and thermochemical processes | Nitrogen (N₂), argon (Ar); High purity (>99.99%) |
Process Integration and Comparative Analysis
Pathway Integration in Biorefinery Systems
Modern biorefineries increasingly integrate both biochemical and thermochemical pathways to maximize resource utilization and product diversification. The lignocellulosic biomass segment held a 38% market share in 2024 for biorefineries, driven by innovations in pretreatment technologies [2]. By technology, the biochemical conversion segment dominated with 44% market share in 2024, while the thermochemical segment is projected to expand rapidly in coming years [2]. This integrated approach allows for cascading biomass utilization where, for example, sugar components are diverted to biochemical processes while lignin-rich residues are directed to thermochemical conversion.
Artificial intelligence is increasingly optimizing these integrated systems. By 2025, AI tools assist in predicting process outcomes, optimizing reaction conditions, and managing resource allocation within dynamic biomass conversion systems [2]. AI-driven digital twins enable real-time control of fermentation, purification, and separation units, allowing operators to adjust parameters preemptively [2]. In thermochemical conversion, machine learning algorithms optimize biochar production parameters to achieve specific surface areas up to 400.0 m²/g and heavy metal immobilization efficiencies exceeding 90% [6].
Comparative Techno-Economic Assessment
A rigorous comparison of lignocellulosic ethanol conversion processes using standardized assumptions found that biochemical and thermochemical approaches have "very comparable yields, economics, and environmental impacts" [7]. This suggests that regional factors, including feedstock availability, policy frameworks, and existing infrastructure, often determine the optimal pathway selection rather than fundamental technical superiority.
The integration of carbon capture and storage (CCS) technologies with biomass conversion systems is creating new opportunities for carbon-negative energy systems. When combined with CCS, biomass power generation can transition from carbon-neutral to carbon-negative, removing CO₂ from the atmosphere while producing energy [3]. This positions both conversion pathways as critical technologies in climate change mitigation strategies, particularly for hard-to-decarbonize sectors like aviation and heavy industry where bio-based fuels and chemicals offer drop-in replacements for their fossil counterparts.
Lignocellulosic biomass, the most abundant renewable carbon source on Earth, presents a pivotal opportunity for sustainable biofuel and biochemical production. Its recalcitrant nature, governed by the complex interplay of cellulose, hemicellulose, and lignin, poses significant challenges for conversion into valuable products. This guide objectively compares the two primary conversion pathways—biochemical and thermochemical—framed within ongoing research to overcome these compositional hurdles.
Comparison of Conversion Pathways
The following table summarizes the core performance metrics of biochemical and thermochemical conversion, based on consolidated experimental data from recent peer-reviewed studies.
Table 1: Performance Comparison of Biochemical vs. Thermochemical Conversion
| Parameter | Biochemical Conversion | Thermochemical Conversion (Fast Pyrolysis) |
|---|---|---|
| Primary Product | Fermentable Sugars (C6/C5) | Bio-Oil |
| Lignin Fate | Remains as solid residue, often unused | Partially depolymerized into bio-oil fractions |
| Hemicellulose Utilization | Requires specialized microbes for C5 fermentation | Decomposed; products contribute to bio-oil |
| Typical Sugar Yield | 70-90% (Cellulose); 50-80% (Hemicellulose)* | N/A (Sugars are degraded) |
| Energy Efficiency | Moderate (due to multiple steps) | High |
| Technology Readiness | Commercial (2G Ethanol Plants) | Pilot to Demonstration Scale |
| Key Challenge | Cost-effective pretreatment & enzyme loading | Bio-oil instability and high oxygen content |
*Yields are highly dependent on the pretreatment severity and biomass source.
Experimental Protocols for Key Methodologies
Protocol 1: Dilute Acid Pretreatment for Biochemical Conversion This protocol details a standard method for hemicellulose hydrolysis and lignin redistribution to enhance enzymatic cellulose digestibility.
- Biomass Milling: Reduce biomass (e.g., corn stover, switchgrass) to a particle size of 0.5-2 mm using a Wiley mill.
- Reaction Setup: Load 10g (dry weight) of biomass into a 500 mL pressurized batch reactor.
- Acid Impregnation: Add 100 mL of a 1.0% (w/w) sulfuric acid (H₂SO₄) solution to achieve a 10:1 liquid-to-solid ratio.
- Pretreatment: Heat the reactor to 160°C and maintain for 30 minutes under constant agitation (150 rpm).
- Quenching & Separation: Rapidly cool the reactor. Separate the solid fraction (cellulose-rich) from the liquid hydrolysate (containing hemicellulose-derived sugars and solubilized lignin) via vacuum filtration.
- Neutralization & Analysis: Wash the solid residue with deionized water until neutral pH. Analyze the solid for glucan content and the liquid for xylose and inhibitor (furfural, HMF) concentrations using HPLC.
Protocol 2: Fast Pyrolysis for Thermochemical Conversion This protocol outlines the process for rapid thermal decomposition of biomass into a liquid bio-oil.
- Biomass Preparation: Dry and mill biomass to <1 mm particles to ensure rapid heat transfer.
- Reactor Loading: Continuously feed 100 g/hr of dried biomass into a fluidized bed reactor pre-heated to 500°C.
- Inert Atmosphere: Maintain a nitrogen (N₂) gas flow (1-2 L/min) as the fluidizing agent to ensure an oxygen-free environment.
- Pyrolysis & Vapor Quenching: The biomass undergoes rapid heating (<2 seconds). The resulting hot vapors are immediately quenched and condensed using a series of condensers maintained at 0-4°C.
- Product Collection: Collect the condensed liquid as bio-oil. Separate and measure non-condensable gases and solid char.
- Bio-Oil Analysis: Characterize the bio-oil for water content (Karl Fischer titration), chemical composition (GC-MS), and higher heating value (bomb calorimeter).
Pathway and Workflow Visualizations
Biochemical Conversion Workflow
Thermochemical Conversion Workflow
The Scientist's Toolkit
Table 2: Essential Research Reagents and Materials
| Reagent/Material | Function in Research |
|---|---|
| Cellulase Enzyme Cocktail | A mixture of enzymes (endoglucanases, exoglucanases, β-glucosidases) that synergistically hydrolyze cellulose into glucose. |
| Sulfuric Acid (H₂SO₄) | A common catalyst in dilute-acid pretreatment to solubilize hemicellulose and disrupt lignin structure. |
| Ionic Liquids (e.g., [EMIM][OAc]) | Advanced solvents for biomass pretreatment that effectively dissolve cellulose and lignin with high potential for recovery. |
| ZSM-5 Zeolite Catalyst | A microporous catalyst used in catalytic fast pyrolysis to deoxygenate pyrolysis vapors, improving bio-oil quality. |
| S. cerevisiae (Engineered Yeast) | A workhorse microbial host for ethanol fermentation; engineered strains can co-ferment C5 and C6 sugars. |
| Nitrogen (N₂) Gas | Creates an inert atmosphere during thermochemical processes to prevent combustion and control reaction pathways. |
The decomposition of complex substances into simpler compounds is a fundamental process in chemistry, biology, and environmental engineering. Two fundamentally distinct pathways—microbial catalysis and thermal decomposition—enable the breakdown of materials through entirely different mechanisms. Microbial catalysis leverages the sophisticated machinery of living microorganisms and their enzymes to perform highly specific, energy-efficient decomposition under mild conditions [10]. In contrast, thermal decomposition employs elevated temperatures to drive chemical breakdown through kinetic energy transfer, often resulting in broader reaction profiles and different product distributions [11]. Understanding the fundamental distinctions between these processes is crucial for selecting appropriate technologies in applications ranging from waste valorization and biofuel production to environmental remediation and chemical synthesis. This guide provides a systematic comparison of these divergent approaches, supported by experimental data and methodological protocols to inform research and development across scientific disciplines.
Core Principles and Mechanistic Foundations
Microbial Catalysis: Biological Precision
Microbial catalysis encompasses decomposition processes mediated by living microorganisms or isolated enzymatic systems. These biological catalysts operate through specialized active sites that bind specific substrates and lower the activation energy for their transformation. A key advantage lies in their exceptional specificity, enabling selective transformation of target compounds within complex mixtures without affecting surrounding molecules [10]. For instance, specialized bacterial systems like the methylthio-alkane reductase (MAR) in Rhodospirillum rubrum perform reductive cleavage of carbon-sulfur bonds in volatile organic sulfur compounds with remarkable precision [12]. This enzymatic complex requires ATP as an energy source and functions under anaerobic conditions, showcasing how biological systems integrate decomposition with cellular energy metabolism.
Microbial decomposition typically occurs under ambient temperatures and pressures, making it inherently energy-efficient compared to thermal approaches. However, these systems can be sensitive to environmental conditions such as pH, temperature fluctuations, and the presence of inhibitory substances [13]. The kinetics of microbial catalysis are generally slower than thermal decomposition, following Michaelis-Menten kinetics rather than simple Arrhenius temperature dependence. Another distinctive feature is the capacity of microbial systems to catalyze challenging chemical transformations under mild conditions, such as the cleavage of strong carbon-fluorine bonds in per- and polyfluoroalkyl substances (PFAS)—a remarkable feat given the exceptional bond strength of C-F bonds (approximately 485 kJ/mol) [14].
Thermal Decomposition: Energy-Driven Breakdown
Thermal decomposition relies on the application of heat to drive chemical breakdown through molecular excitation. As temperature increases, molecules gain vibrational energy, eventually exceeding the bond dissociation energy of the weakest chemical bonds [11]. This process follows fundamental chemical kinetics described by the Arrhenius equation, where reaction rates increase exponentially with temperature. Unlike biological systems, thermal decomposition typically lacks specificity, often resulting in multiple parallel and sequential reaction pathways that generate complex product distributions [15].
The thermal decomposition of biomass illustrates this mechanistic profile, where lignocellulosic components undergo distinct degradation pathways: hemicellulose decomposes first (200-260°C), followed by cellulose (240-350°C), and finally lignin (280-500°C) [11]. This differential decomposition arises from variations in bond strengths and structural stability within each polymer. Thermal processes offer advantages in processing throughput and speed, enabling rapid treatment of substantial material volumes. However, they typically require significant energy input and can produce undesirable byproducts through secondary reactions, including polycyclic aromatic hydrocarbons and other recalcitrant compounds [13].
Table 1: Fundamental Mechanism Comparison
| Characteristic | Microbial Catalysis | Thermal Decomposition |
|---|---|---|
| Energy Source | Biochemical (ATP, reducing equivalents) | Thermal energy |
| Temperature Range | Ambient (20-45°C) | Elevated (200-1000°C) |
| Reaction Specificity | High (enzyme-substrate specificity) | Low (bond strength dependent) |
| Kinetic Profile | Michaelis-Menten saturation kinetics | Arrhenius temperature dependence |
| Primary Controls | Enzyme concentration, nutrient availability, pH | Temperature, residence time, heating rate |
| Common Applications | Wastewater treatment, soil bioremediation, biogas production | Pyrolysis, gasification, waste incineration, chemical synthesis |
Comparative Performance Analysis
Process Efficiency and Product Spectrum
The choice between microbial and thermal decomposition pathways significantly impacts process efficiency and product distributions, particularly in biomass valorization applications. Thermochemical conversion techniques like pyrolysis, gasification, and liquefaction operate at temperatures between 300°C and 1000°C, achieving rapid conversion within seconds to minutes [11]. Fast pyrolysis of agricultural waste at 450-550°C with short residence times (typically 1-2 seconds) can convert up to 75% of biomass into bio-oil, with the remainder forming biochar and syngas [11]. In contrast, biochemical conversion through anaerobic digestion proceeds at mesophilic temperatures (35-40°C) but requires retention times of 15-30 days to achieve substantial volatile solids destruction and biogas production [13].
The product spectrum also differs substantially between these pathways. Thermal decomposition of lignocellulosic biomass typically generates bio-oil, syngas (primarily H₂, CO, CO₂, and CH₄), and biochar in proportions determined by process conditions [11]. Microbial systems, particularly anaerobic digestion, predominantly produce biogas (CH₄ and CO₂) and digestate, with the potential for recovery of valuable biochemicals like organic acids and solvents through controlled fermentation processes [13]. For particularly recalcitrant compounds like PFAS, thermal methods can achieve high destruction efficiencies but often require extreme conditions—incineration at 1000-1200°C—with potential formation of degradation byproducts [14]. Microbial approaches offer a promising low-energy alternative but face challenges in achieving complete mineralization of these persistent contaminants.
Environmental Footprint and Economic Considerations
Life cycle assessment studies reveal distinct environmental footprints for these decomposition pathways. Thermal conversion processes, particularly combustion and gasification, achieve volume reduction exceeding 90% and can directly recover energy, offsetting their operational energy requirements [11]. However, they face challenges with emissions control, particularly for nitrogen oxides, sulfur compounds, and particulate matter, often requiring sophisticated air pollution control systems [13]. Microbial systems generally have lower greenhouse gas emissions and can operate effectively at smaller scales, but may produce waste biomass and odors requiring management [13].
Economic considerations reveal context-dependent advantages. Thermal systems typically have higher capital costs and require specialized materials resistant to high temperatures and corrosion, but offer faster treatment times and smaller physical footprints [11]. Microbial systems generally have lower operating costs, particularly for dilute waste streams, but may require larger land areas and more skilled operation to maintain biological activity [13]. The economic viability of both approaches is highly influenced by feedstock characteristics, with thermal methods generally more tolerant of heterogeneous or contaminated inputs, while microbial processes often require more consistent substrate composition to maintain process stability.
Table 2: Performance Metrics for Biomass Conversion
| Performance Metric | Microbial Catalysis | Thermal Decomposition |
|---|---|---|
| Typical Conversion Time | Days to weeks | Seconds to minutes |
| Energy Efficiency | 30-50% (biochemical to biogas) | 50-80% (biomass to bio-oil) |
| Carbon Retention | 40-60% in biogas | 30-70% in bio-oil/biochar |
| Water Requirement | High (maintain aqueous environment) | Low (often dry processes) |
| Scale-up Considerations | Linear scaling common | Complex reactor design challenges |
| Byproduct Management | Digestate treatment, potential odors | Ash disposal, emissions control |
| Typical Conversion Efficiency | 40-60% volatile solids destruction | 70-90% mass conversion |
Experimental Methodologies
Protocol for Microbial Decomposition Studies
Objective: Evaluate the catalytic activity of microbial consortia or purified enzyme systems in decomposing target substrates.
Materials:
- Anaerobe Workstation: Creates oxygen-free environment for anaerobic microorganisms [12]
- Activity Assay Reagents: ATP, electron donors (dithiothreitol or NADPH), substrate solutions [12]
- Analytical Instruments: HPLC for substrate quantification, GC-MS for gaseous products, spectrophotometer for enzyme kinetics [12]
Methodology:
- Culture Preparation: Inoculate defined medium with microbial culture or purified enzyme preparation under appropriate environmental conditions (e.g., anaerobic chamber for strict anaerobes) [12].
- Reaction Setup: Combine culture/enzyme preparation with buffered substrate solution, electron donors, and essential cofactors in sealed reaction vessels.
- Process Monitoring: Periodically sample reaction mixture for substrate depletion and product formation using appropriate analytical methods (e.g., HPLC, GC-MS).
- Kinetic Analysis: Determine Michaelis-Menten parameters (Kₘ, Vₘₐₓ) from initial rate measurements at varying substrate concentrations.
- Control Experiments: Include heat-inactivated controls and no-substrate controls to account for abiotic degradation and background signals.
Data Interpretation: Microbial decomposition typically shows sigmoidal kinetics for allosteric enzymes or hyperbolic kinetics following Michaelis-Menten behavior. Temperature dependence follows a bell-shaped curve with optimal activity typically between 25-45°C for mesophilic organisms [13].
Protocol for Thermal Decomposition Analysis
Objective: Characterize the thermal degradation behavior and kinetic parameters of materials under controlled heating conditions.
Materials:
- Thermogravimetric Analyzer (TGA): Measures mass loss as a function of temperature and time [15]
- Pyrolysis Reactor: Bench-scale fixed-bed or fluidized-bed reactor with temperature control [11]
- Product Collection System: Condensers for bio-oil, gas bags or online analyzers for gaseous products [11]
Methodology:
- Sample Preparation: Grind and sieve material to uniform particle size (typically 100-500μm) to ensure heat transfer consistency.
- TGA Analysis: Heat sample (5-20mg) under controlled atmosphere (N₂ for pyrolysis, air for combustion) at multiple heating rates (5-50°C/min) to determine degradation profile.
- Kinetic Analysis: Apply model-free methods (e.g., Friedman, Flynn-Wall-Ozawa) or model-fitting approaches to determine apparent activation energy from TGA data.
- Product Characterization: Analyze condensed products (bio-oil) by GC-MS, FTIR; characterize gaseous products by GC-TCD/FID; analyze biochar by elemental analysis, surface area measurement.
- Mass Balance Closure: Quantify all product streams to achieve mass balance closures of 95-105%.
Data Interpretation: Thermal decomposition typically shows distinct mass loss regions corresponding to degradation of specific components. Kinetic analysis reveals apparent activation energies typically ranging from 100-250kJ/mol for biomass components [11].
Pathway Visualization
Diagram 1: Fundamental pathways for microbial and thermal decomposition processes
Research Reagent Solutions
Table 3: Essential Research Materials and Their Applications
| Reagent/Material | Function in Research | Example Applications |
|---|---|---|
| Purified Enzyme Preparations | Catalyze specific decomposition reactions with high selectivity | PpnN nucleosidase for nucleotide cleavage [16], MAR for C-S bond cleavage [12] |
| Defined Microbial Consortia | Provide diverse catalytic capabilities for complex substrates | PFAS-degrading bacteria, anaerobic digestate cultures [14] |
| ATP & Cofactor Solutions | Supply energy and electron transfer capabilities for enzymatic reactions | MAR activity assays, enzyme kinetic studies [12] |
| Thermogravimetric Analyzer | Quantifies mass loss during thermal decomposition | Biomass pyrolysis kinetics, polymer degradation studies [15] |
| Bench-Scale Pyrolysis Reactors | Enable controlled thermal processing with product collection | Bio-oil production optimization, catalytic pyrolysis studies [11] |
| Anaerobic Chambers | Maintain oxygen-free environments for anaerobic microorganisms | Cultivation of strict anaerobes, oxygen-sensitive enzyme assays [12] |
Microbial catalysis and thermal decomposition represent fundamentally distinct approaches to molecular deconstruction, each with characteristic advantages and limitations. Microbial systems offer unparalleled specificity, energy efficiency, and operational under mild conditions but typically require longer processing times and can be sensitive to environmental conditions and inhibitors. Thermal methods provide rapid processing, high throughput, and tolerance to diverse feedstocks but demand substantial energy input and can produce complex product mixtures requiring further refinement.
The optimal choice between these pathways depends heavily on application-specific requirements including feedstock characteristics, desired products, scale considerations, and economic constraints. Emerging research continues to expand the capabilities of both approaches, from engineering enzymes with enhanced stability and novel catalytic functions to developing advanced thermal processes with improved energy integration and product control. Hybrid approaches that leverage the strengths of both biological and thermal processing represent a promising frontier for sustainable decomposition technologies across industrial, environmental, and energy applications.
The transition from fossil-based resources to renewable biomass is a cornerstone of the global strategy to mitigate climate change and enhance energy security. The success of this bio-based economy hinges on the efficient conversion of widely available feedstocks, primarily agricultural residues, forestry waste, and organic solid wastes, into fuels and chemicals. These feedstocks are not uniform; their physical and chemical characteristics vary significantly, influencing their suitability for different conversion pathways. The two primary technological routes for converting lignocellulosic biomass are biochemical conversion and thermochemical conversion. The selection between these pathways is critically dependent on the specific properties of the feedstock, impacting process economics, product yield, and environmental footprint [17] [18]. This guide provides a comparative analysis of the suitability of different waste biomass categories for biochemical and thermochemical conversion processes, supporting informed decision-making for researchers and industry professionals.
Feedstock Composition and Key Attributes
The viability of a biomass feedstock for a given conversion pathway is largely determined by its composition. The three main structural polymers—cellulose, hemicellulose, and lignin—along with ash and moisture content, are the most critical indicators.
Cellulose, a linear polymer of glucose, is a primary source for fermentable sugars in biochemical processes and a contributor to bio-oil yields in thermochemical processes. Hemicellulose, a branched heteropolymer, is relatively easily hydrolyzed into sugars but can also lead to the formation of degradation inhibitors. Lignin, a complex, aromatic polymer, is largely unutilized in biochemical conversion but is a valuable energy-dense component in thermochemical processes [18] [13]. High ash content, particularly alkali metals, can cause catalytic poisoning, slagging, and equipment fouling in thermochemical reactors, making it a detrimental attribute for these systems [17].
The table below summarizes the typical compositional range of common feedstock categories, highlighting their inherent variability.
Table 1: Typical Compositional Range of Common Biomass Feedstocks
| Feedstock Category | Cellulose (% Dry Basis) | Hemicellulose (% Dry Basis) | Lignin (% Dry Basis) | Ash (% Dry Basis) | Key Characteristics |
|---|---|---|---|---|---|
| Agricultural Residues (e.g., Corn Stover, Rice Straw) | 30-50 | 20-35 | 15-20 | 5-15 [17] [13] | High ash and seasonal variability. |
| Herbaceous Energy Crops (e.g., Switchgrass) | 30-50 | 20-35 | 15-20 | 5-10 [17] | Moderate ash content. |
| Forestry Waste (e.g., Wood Chips, Poplar) | 40-50 | 20-30 | 20-30 | 1-5 [17] [19] | Low ash, high lignin content. |
| Organic Solid Waste (e.g., Food Waste, MSW) | 5-30 | 10-25 | 5-20 | 5-30 [13] | Highly variable and heterogeneous. |
Biochemical Conversion Pathway
Biochemical conversion relies on biological catalysts, such as enzymes and microbes, to break down biomass into simple sugars, which are subsequently fermented into products like ethanol, biogas, or organic acids. The process typically involves pretreatment, enzymatic hydrolysis, and fermentation [17] [18].
Figure 1: Biochemical Conversion Process Workflow
Feedstock Suitability for Biochemical Conversion
This pathway is best suited for feedstocks with high cellulose and hemicellulose content, as these are the primary sources of fermentable sugars. The recalcitrance of the plant cell wall, largely due to lignin content and structure, is a major barrier. Therefore, feedstocks with lower lignin or those that respond well to pretreatment are preferred.
Table 2: Biochemical Conversion Feedstock Suitability and Yield Data
| Feedstock | Recommended Pretreatment | Key Experimental Findings | Reported Ethanol Yield (or equivalent) |
|---|---|---|---|
| Corn Stover | Dilute Acid [17] | Pretreatment effective in disrupting cell wall structure; high ash content can be mitigated by fractionation [17]. | Used as a benchmark in NREL models [7]. |
| Switchgrass | Ionic Liquid, Dilute Acid [17] | Continued development of pretreatment is required to achieve high sugar yields due to natural recalcitrance [17]. | Performance can be lower than woody feedstocks without optimized pretreatment [19]. |
| Sweet Sorghum | Milling, Dilute Alkali [13] | High fermentable sugar content leads to excellent financial and environmental performance in biochemical routes [19]. | Among the highest yields for biochemical processes [19]. |
| Pine | Steam Explosion [17] | High lignin content lowers conversion yields; lignin degradation during pretreatment can form inhibitors [17] [19]. | Lower financial performance due to low yield [19]. |
Thermochemical Conversion Pathway
Thermochemical conversion uses heat and chemical processes to break down biomass into intermediate gases, liquids, or solids. The primary technologies include pyrolysis, gasification, and hydrothermal liquefaction (HTL) [18] [13]. These processes are generally less sensitive to lignin content and more sensitive to ash and moisture.
Figure 2: Thermochemical Conversion Process Workflow
Feedstock Suitability for Thermochemical Conversion
Thermochemical processes are more feedstock-flexible but have specific quality requirements. Low ash content, especially low alkali metal concentration, is critical to avoid catalyst poisoning and operational issues like slagging. High lignin content is favorable as it contributes to higher energy yields [17].
Table 3: Thermochemical Conversion Feedstock Suitability and Yield Data
| Feedstock | Conversion Process | Key Experimental Findings | Product Quality & Yield |
|---|---|---|---|
| Pine | Gasification to Mixed Alcohols [19] | Low ash content and high lignin make it ideal; produced highest financial performance in NREL analysis [19]. | High syngas quality and high alcohol yield [19] [7]. |
| Switchgrass | Fast Pyrolysis, Gasification [17] | High ash content leads to decreased product yields and increased catalytic poisoning/slagging [17] [19]. | Lower financial and environmental performance due to ash [19]. |
| Forest Residues | Hydrothermal Liquefaction (HTL) [17] | Woody biomass with low ash is favored for high yields and decreased equipment problems [17]. | Produces high yields of bio-crude oil [17]. |
| Municipal Solid Waste | Gasification, Pyrolysis [18] | Heterogeneity and contaminants are a challenge; pre-processing is essential [18]. | Potential for energy recovery but requires robust gas cleaning [18]. |
Direct Comparative Analysis: Biochemical vs. Thermochemical
A holistic comparison of the two pathways reveals distinct advantages, challenges, and trade-offs, heavily influenced by feedstock choice.
Table 4: Overall Comparison of Conversion Pathways
| Parameter | Biochemical Conversion | Thermochemical Conversion |
|---|---|---|
| Ideal Feedstock Traits | High cellulose/hemicellulose, low lignin, low ash [17]. | Low ash (esp. alkali metals), low moisture, high lignin [17]. |
| Feedstock Flexibility | Lower flexibility, sensitive to lignin and inhibitors [19]. | Higher flexibility, can process a wider range of feedstocks [19]. |
| Primary Products | Ethanol, biogas, butanol, organic acids [18]. | Syngas, bio-oil, biochar, electricity, FT-fuels [18] [13]. |
| Typical Conversion Time | Long (hours to days for fermentation) [13]. | Very fast (seconds in fast pyrolysis to minutes in gasification) [18] [13]. |
| Environmental Impact (LCA) | Slightly better on GHG emissions and fossil fuel consumption [20]. | Lower direct, indirect, and life cycle water consumption [20]. |
| Key Challenges | Long processing times, low product yields, inhibitor formation [17] [21]. | High processing costs, high temperatures, tar formation, catalyst poisoning [17] [18]. |
Essential Research Reagents and Materials
Advancing biomass conversion technologies requires a suite of specialized reagents and materials for process development and analysis.
Table 5: Key Research Reagent Solutions for Biomass Conversion Studies
| Reagent/Material | Function in Research | Application Context |
|---|---|---|
| Ionic Liquids | Solvent for pretreating biomass; effectively disrupts lignin and cellulose crystallinity [17]. | Biochemical Pretreatment |
| Dilute Acid/Alkali | Chemical catalyst for pretreatment; hydrolyzes hemicellulose and disrupts lignin structure [17]. | Biochemical Pretreatment |
| Cellulase & Hemicellulase Enzymes | Biological catalysts for hydrolyzing cellulose and hemicellulose into fermentable sugars [18]. | Biochemical Hydrolysis |
| MoS₂ Catalyst | Catalyzes the conversion of cleaned syngas into mixed alcohols [19]. | Thermochemical Synthesis |
| Specialized Microbes | Genetically engineered organisms for fermenting C5 and C6 sugars to target products [18]. | Biochemical Fermentation |
| Gas Cleaning Adsorbents | Remove contaminants like tars, H₂S, and other catalyst poisons from raw syngas [18]. | Thermochemical Syngas Conditioning |
Emerging Trends and Future Outlook
The bio-feedstock market is projected to grow significantly, reaching USD 224.9 billion by 2035, driven by carbon regulations and circular economy policies [22] [23]. A key trend is the move away from standalone processes toward integrated biorefineries that combine thermochemical and biochemical methods to maximize resource efficiency and valorize all biomass components [21]. For instance, lignin-rich residues from biochemical processes can be converted into bio-oil via pyrolysis, while aqueous streams from thermochemical processes can be treated anaerobically [21]. Future progress depends on overcoming challenges related to feedstock pretreatment, catalyst development, and system optimization to improve the economic viability and environmental performance of both pathways [13].
The escalating global energy demand and the imperative to mitigate climate change have intensified the search for sustainable, carbon-neutral energy sources [24]. Biomass, derived from organic materials such as plants and agricultural residues, stands out as a critical renewable resource due to its unique ability to form a closed carbon cycle [24]. During growth, biomass absorbs atmospheric carbon dioxide (CO2) via photosynthesis; when converted to energy, it releases a similar amount of CO2, resulting in a net-neutral impact on atmospheric carbon over its lifecycle [24] [18]. This positions biomass utilization as an essential pathway for achieving carbon peaking and neutrality targets within global energy transition strategies [24].
The efficiency and sustainability of this carbon cycle are largely determined by the conversion technology employed. Biochemical and thermochemical pathways represent two distinct methodological approaches for transforming raw biomass into usable energy, fuels, and chemicals [1]. The selection between these pathways involves critical trade-offs concerning carbon conversion efficiency, process kinetics, product slate, and overall environmental impact [13] [25]. This guide provides an objective, data-driven comparison of these two technological families, focusing on their operational parameters, carbon neutrality potential, and practical implementation for researchers and scientists in the field.
Comparative Analysis: Biochemical vs. Thermochemical Conversion
The following table summarizes the core characteristics of biochemical and thermochemical conversion pathways, providing a foundational comparison for researchers.
Table 1: Fundamental Comparison of Biomass Conversion Pathways
| Feature | Biochemical Conversion | Thermochemical Conversion |
|---|---|---|
| Core Principle | Utilizes biological agents (enzymes, microorganisms) to break down biomass [1]. | Applies heat and chemical catalysts to decompose biomass [1]. |
| Primary Processes | Anaerobic Digestion (Biogas), Fermentation (Bioethanol) [13]. | Pyrolysis, Gasification, Hydrothermal Liquefaction, Combustion [24] [11]. |
| Typical Operating Conditions | Low temperatures and pressures; ambient or near-ambient [1]. | High temperatures (300°C–1000+°C), often with high pressure [1] [24]. |
| Key Product Spectrum | Biogas (CH₄, CO₂), Bioethanol, Butanol, Organic Acids [13]. | Bio-oil, Syngas (CO, H₂), Biochar, Bioheat [24] [11]. |
| Carbon Conversion Efficiency | Generally lower due to incomplete microbial digestion of lignin [13]. | Generally higher; can convert a larger fraction of biomass carbon, including lignin, into energy products [24]. |
| Process Duration | Slow (days to weeks for anaerobic digestion; hours for fermentation) [25]. | Fast (seconds to minutes for fast pyrolysis; minutes to hours for gasification/slow pyrolysis) [18] [25]. |
| Technology Readiness | High for first-gen biofuels; advanced processes (e.g., cellulosic ethanol) at commercial/pilot scale [26]. | High for combustion; advanced processes (e.g., catalytic pyrolysis, HTL) at pilot and demonstration scale [26]. |
Quantitative Performance and Environmental Impact
Life-cycle assessment (LCA) studies provide critical data for evaluating the carbon neutrality potential of different biorefinery pathways. The following table compiles experimental data and LCA results from recent research.
Table 2: Experimental Data and Environmental Impact Comparison of Select Biorefinery Pathways
| Pathway Description | Key Operational Parameters | Product Yield & Carbon Efficiency | Environmental Impact (WTW GHG Emissions)* & Key Findings |
|---|---|---|---|
| Algae Hydrothermal Liquefaction (HTL) - Pathway I [26] | • Feedstock: Wet algal biomass• Process: Hydrothermal Liquefaction• Avoids energy-intensive drying [26] | • Produces bio-crude for upgrading to renewable diesel [26]. | • Very low emissions; negative net emissions reported [26].• Superior resource efficiency and reduced carbon footprint. |
| Combined Algae Processing (CAP) - Pathway II [26] | • Feedstock: Algal biomass• Process: Integrates biochemical & thermochemical processes• Utilizes CO₂ as a feedstock [26] | • Produces renewable diesel and other products [26]. | • Very low emissions [26].• Shows high potential for sustainable fuel production. |
| Palm Fatty Acid Distillation (PFAD) - Pathway III [26] | • Feedstock: Palm fatty acid distillate (second-gen, non-food crop) [26]• Process: Esterification/Hydroprocessing | • Industrial-scale production of renewable diesel [26]. | • Highest emissions among the three pathways [26].• Raises concerns over land use and sustainability. |
| Lignocellulosic Biochemical Conversion [18] | • Feedstock: Agricultural residues (e.g., straw)• Process: Pretreatment, Enzymatic Hydrolysis, Fermentation | • Cellulosic ethanol yield varies with pretreatment efficiency [27]. | • Can reduce GHG emissions by up to 86% compared to fossil fuels [18].• Technical challenges in lignin depolymerization remain. |
| Refuse-Derived Fuel (RDF) Gasification [5] | • Feedstock: Processed municipal solid waste (RDF)• Process: Gasification | • Syngas with heating values up to 10.9 MJ m⁻³ [5]. | • Reduces waste volume and recovers energy, mitigating landfill methane emissions [5].• Emission control is critical for environmental performance. |
WTW: Well-to-Wheel, a system boundary that includes emissions from feedstock cultivation, fuel production, and transport [26].
Experimental Protocols for Key Conversion Pathways
Protocol for Biochemical Conversion: Anaerobic Digestion of Agricultural Waste
Objective: To produce biogas (methane and carbon dioxide) through the microbial digestion of agricultural waste under anaerobic conditions [13].
Materials:
- Feedstock: Chopped or ground agricultural residue (e.g., wheat straw, corn stover).
- Inoculum: Anaerobic sludge from an operational digester.
- Bioreactor: Batch or continuous-flow anaerobic digester with gas collection system.
- Analytical Equipment: Gas chromatograph (for CH₄, CO₂ analysis), pH meter, Chemical Oxygen Demand (COD) apparatus.
Methodology:
- Pretreatment: Subject the biomass to a mild alkaline (e.g., NaOH) or physical (e.g., milling) pretreatment to disrupt the lignocellulosic structure and enhance biodegradability [13].
- Inoculation and Loading: Mix the pretreated feedstock with anaerobic inoculum in a predetermined ratio (e.g., based on volatile solids) inside the bioreactor.
- Anaerobic Incubation: Flush the headspace of the reactor with nitrogen to ensure anaerobic conditions. Seal the reactor and maintain it at a mesophilic temperature (35-37°C) [13].
- Monitoring and Analysis: Monitor biogas production daily using water displacement or a gas meter. Periodically analyze the biogas composition (CH₄/CO₂ ratio) via gas chromatography. Track pH and COD reduction throughout the process (typically 20-40 days) [13].
- Data Calculation: Calculate the ultimate methane yield (m³ CH₄ per kg of volatile solids added) and the organic removal efficiency.
Protocol for Thermochemical Conversion: Fast Pyrolysis for Bio-Oil Production
Objective: To convert lignocellulosic biomass into liquid bio-oil through rapid thermal decomposition in an inert atmosphere [24] [11].
Materials:
- Feedstock: Dried and finely ground biomass (e.g., sawdust, rice husk) with low moisture content (<10%).
- Reactor: Bench-scale fluidized bed pyrolysis reactor system.
- Carrier Gas: Nitrogen or another inert gas.
- Condensation System: A series of condensers cooled by a mixture of dry ice and ethanol.
- Analytical Equipment: Gas chromatograph, bio-oil characterization equipment (e.g., for water content, viscosity, heating value).
Methodology:
- Feedstock Preparation: Dry and sieve the biomass to a uniform particle size (typically < 2 mm) to ensure efficient heat transfer [24].
- Reactor Setup and Purging: Load the reactor with bed material (e.g., sand). Heat the reactor to the target temperature (typically 450-550°C) [24]. Initiate a flow of inert carrier gas to purge the system of oxygen.
- Pyrolysis Reaction: Continuously feed the prepared biomass into the hot reactor at a controlled rate. Maintain a very short vapor residence time (typically 1-2 seconds) to maximize liquid yield [24] [11].
- Product Collection: Direct the hot vapor and gas products through the condensation train, where the bio-oil condenses and is collected. Collect the non-condensable gases in a gas bag for analysis. The solid residue (biochar) remains in the reactor or is separated by a cyclone.
- Product Analysis: Weigh the collected bio-oil and biochar to determine mass yield. Analyze the bio-oil for its physicochemical properties and the gas for its composition (CO, CO₂, CH₄, H₂) [24].
Pathway Visualization and Logical Workflow
The following diagram illustrates the logical workflow and key decision points in selecting and implementing biomass conversion pathways, highlighting the distinct stages of biochemical and thermochemical processes.
Diagram 1: Biomass Conversion Pathways Workflow.
The Scientist's Toolkit: Essential Research Reagents and Materials
Table 3: Key Reagents and Materials for Biomass Conversion Research
| Item Name | Function/Application | Key Characteristics & Notes |
|---|---|---|
| Lignocellulolytic Enzymes (e.g., Cellulase, Hemicellulase) [27] | Hydrolyzes cellulose and hemicellulose into fermentable sugars during biochemical conversion. | Specific activity, thermostability, and resistance to inhibitors are critical performance parameters. |
| Anaerobic Sludge Inoculum [13] | Serves as a consortium of microorganisms for initiating and maintaining anaerobic digestion processes. | Source (e.g., wastewater plant, existing digester) and microbial diversity affect biogas yield and stability. |
| Zeolite & Metal-Oxide Catalysts (e.g., ZSM-5, Ni-based catalysts) [24] [11] | Used in catalytic pyrolysis and syngas reforming to upgrade bio-oil quality and enhance gas yields. | Key properties include acidity, pore size, and resistance to coking and sintering at high temperatures. |
| Lignocellulosic Standard (e.g., α-Cellulose, Xylan, Kraft Lignin) [18] | Used as model compounds for method development and calibration in analytical studies. | Provides a consistent and defined material for understanding the conversion of individual biomass components. |
| Inert Carrier Gas (e.g., High-Purity N₂, Ar) [24] | Creates an oxygen-free environment for thermochemical processes like pyrolysis and gasification. | High purity is essential to prevent unwanted oxidation reactions that can form tar and reduce product quality. |
The pursuit of carbon neutrality through biomass utilization is a complex endeavor with no single optimal solution. Both biochemical and thermochemical pathways offer distinct and viable routes for closing the carbon cycle, yet they present different profiles in terms of technology maturity, carbon conversion efficiency, and environmental performance.
Third-generation thermochemical pathways, such as algae hydrothermal liquefaction, demonstrate remarkable potential for achieving very low or even negative net emissions [26]. Thermochemical methods generally offer higher carbon conversion efficiency and faster processing times, making them suitable for a wider range of feedstocks, including lignin-rich materials [24] [25]. Conversely, advanced biochemical pathways, while facing challenges with recalcitrant feedstocks, can achieve significant GHG reductions—up to 86% for cellulosic ethanol—and benefit from continuous advancements in enzymatic and microbial technologies [18].
The choice between these pathways is highly context-dependent, influenced by factors such as feedstock type, desired end-products, and regional economic and policy frameworks. The integration of artificial intelligence for process optimization and the development of hybrid biorefinery concepts that combine the strengths of both pathways are promising frontiers for research [27] [11]. Future progress hinges on supportive policies, continued research into catalyst development and feedstock pretreatment, and collaboration across academia, industry, and government to firmly establish biomass as a cornerstone of a sustainable, carbon-neutral energy future [27] [24].
Operational Mechanisms and Product Spectrum: From Laboratory to Industrial Application
The transition toward a circular bioeconomy has intensified the focus on technologies that convert waste biomass into valuable energy and chemicals. Among these, biochemical conversion pathways—specifically anaerobic digestion (AD), fermentation, and syngas bioconversion—offer sustainable alternatives to fossil-based production. These processes leverage microbial consortia or pure cultures to transform organic materials found in agricultural waste, food waste, and livestock manure into biofuels and biochemicals. Anaerobic digestion is a well-established biological process where microorganisms break down biodegradable material in the absence of oxygen, primarily producing biogas [28]. Syngas fermentation, a hybrid thermochemical-biochemical process, involves the biological conversion of synthesis gas (a mixture of CO, H₂, and CO₂) into products such as alcohols and volatile fatty acids (VFAs) [29] [30]. This guide provides a detailed, data-driven comparison of these biochemical pathways, focusing on their operational performance, microbial mechanisms, and industrial scalability to inform research and development strategies.
Biochemical conversion methods are distinguished by their operational principles, microbial pathways, and resultant product profiles. The table below summarizes the core characteristics, advantages, and limitations of anaerobic digestion, conventional fermentation, and syngas bioconversion.
Table 1: Comparative analysis of key biochemical conversion pathways.
| Feature | Anaerobic Digestion (AD) | Syngas Fermentation | Conventional Fermentation |
|---|---|---|---|
| Primary Products | Biogas (CH₄, CO₂), Digestate [28] | Ethanol, Acetic Acid, H₂, VFAs [29] [30] | Ethanol, Butanol, Lactic Acid [13] |
| Core Microbial Process | Hydrolysis, Acidogenesis, Acetogenesis, Methanogenesis [28] | Wood-Ljungdahl Pathway, Biological Water-Gas Shift [29] [30] | Sugar fermentation by microorganisms (e.g., yeast, bacteria) [13] |
| Typical Feedstocks | Dairy cow manure, food waste, sewage sludge [31] [28] | Syngas from gasification of biomass (e.g., wood, MSW) or industrial off-gases [29] [32] [30] | Sugar-rich or starch-rich biomass (e.g., corn, sugarcane) [13] |
| Optimal Temperature | Mesophilic (~37°C) [28] | Mesophilic (~37°C) to Thermophilic [30] | Varies (e.g., ~30°C for yeast) [13] |
| Key Advantage | Waste stabilization, nutrient recovery in digestate [28] | Utilizes gaseous waste streams; high product flexibility [29] [30] | Established, high-volume production from simple sugars [13] |
| Key Limitation | Susceptible to inhibition (e.g., VFA, ammonia accumulation) [28] | Low gas-liquid mass transfer rate limits productivity and scalability [30] | Competition with food sources; often requires sterile conditions [30] |
The performance of these systems is highly dependent on operational parameters. For instance, in anaerobic digestion, the organic loading rate (OLR) is a critical factor. A study on co-digesting cattle manure with green grocery waste demonstrated that an OLR of 3 g VS L⁻¹ day⁻¹, combined with an applied voltage of 0.7 V in a microbial electrolysis cell (MEC) system, yielded a significantly higher biogas production compared to a conventional AD system [31]. Similarly, in syngas fermentation, parameters like gas composition, pH, and temperature are crucial for directing microbial "decision-making" toward desired products like hydrogen or VFAs [29].
Experimental Protocols and Performance Data
Protocol for Enhanced Anaerobic Digestion with Microbial Electrolysis Cell (AD-MEC)
Objective: To overcome limitations of conventional AD (low biogas yield, long retention times) by integrating a Microbial Electrolysis Cell (MEC) to enhance methane production [31].
- 1. Reactor Setup: Configure a single-stage anaerobic reactor with an effective volume of 6 L. Include multiple electrode sets (e.g., 2E: one anode/cathode pair; 4E: two anode/cathode pairs) to increase the surface area for microbial biofilm formation. The control setup has no electrodes [31].
- 2. Feedstock Preparation: Collect and homogenize cattle manure and green grocery waste. Use these substrates in a co-digestion setup to ensure a balanced carbon-to-nitrogen ratio [31].
- 3. Operation: Maintain mesophilic conditions (37°C). Apply a low external voltage (e.g., 0.7 V) across the electrodes. The system is operated at various Organic Loading Rates (OLRs), with a hydraulic retention time (HRT) of 10 days [31].
- 4. Data Collection: Monitor and record daily biogas production. Analyze the composition of the biogas (e.g., CH₄, CO₂) using gas chromatography. Measure the reduction in chemical oxygen demand (COD) to assess organic matter removal [31].
Table 2: Experimental data from AD-MEC study showing the impact of electrode configuration and OLR on biogas yield [31].
| Electrode Setup | OLR (g VS L⁻¹ day⁻¹) | Applied Voltage (V) | Biogas Yield | CH₄ Yield (NL/g VS) |
|---|---|---|---|---|
| Control (No electrodes) | 3.0 | 0.0 | Baseline | Baseline |
| 2E (Single electrode pair) | 3.0 | 0.7 | Significantly higher than control | Significantly higher than control |
| 4E (Double electrode pairs) | 3.0 | 0.7 | Highest (significantly higher than 2E and control) | 0.232 (1.6x higher than single pair) |
Protocol for Syngas Fermentation for Hydrogen and VFA Production
Objective: To utilize syngas (CO, CO₂, H₂) as a feedstock for microbial consortia to produce high-value resources like hydrogen and volatile fatty acids (VFAs) [29] [30].
- 1. Inoculum and Conditioning: Source a natural microbial consortium from diverse anaerobic sludges (e.g., from wastewater treatment or food waste digesters). Condition the consortium by gradually exposing it to syngas to adapt the microbes and suppress methanogenic activity, thereby favoring the production of intermediates like H₂ and VFAs [29] [30].
- 2. Bioreactor Operation: Use a continuous stirred-tank reactor (CSTR) or a bubble column reactor designed to maximize gas-liquid mass transfer—a key challenge in syngas fermentation. Maintain strict anaerobic conditions [30].
- 3. Parameter Control: Control critical parameters to steer microbial pathways. pH is a primary lever; a pH below 5.0 typically inhibits methanogenesis and promotes acidogenesis. The H₂/CO ratio in the syngas feed also influences whether the biological water-gas shift reaction or the Wood-Ljungdahl pathway is favored, determining the end products [29].
- 4. Monitoring and Analysis: Monitor gas uptake rates (CO and H₂ consumption). Quantify liquid-phase products using high-performance liquid chromatography (HPLC) for VFAs (e.g., acetic, propionic, butyric acids) and gas chromatography for H₂ and other gases in the headspace [29].
Microbial Pathways and Metabolic Networks
The core of these bioconversion processes lies in the complex metabolic networks of microorganisms. The following diagrams illustrate the key pathways for anaerobic digestion and syngas fermentation.
Diagram 1: Anaerobic digestion four-stage pathway.
Diagram 2: Syngas fermentation metabolic pathways.
The Scientist's Toolkit: Essential Research Reagents and Materials
Successful experimentation in biochemical conversion requires specific reagents and equipment. The following table details essential items for setting up and monitoring these bioprocesses.
Table 3: Key research reagent solutions and materials for biochemical conversion experiments.
| Item Name | Function/Application | Experimental Context |
|---|---|---|
| Anaerobic Sludge Consortium | Serves as the inoculum, providing a diverse microbial community to carry out the digestion or fermentation processes [29] [28]. | Sourced from wastewater treatment plants; used as the starting culture in both AD and syngas fermentation reactors [29]. |
| Stainless Steel Fermenter (SS316L) | The core bioreactor vessel; provides corrosion resistance and durability for sterile-grade operations [33]. | Used in pilot-scale and industrial-scale fermenters for syngas fermentation and other bioprocesses [33]. |
| In-line Fermentation Monitors (pH, DO) | Provides real-time, continuous monitoring of critical process parameters (pH, dissolved oxygen) without sampling interruption [34]. | Essential for maintaining optimal pH for acetogenesis in AD or for steering product spectrum in syngas fermentation [29] [34]. |
| Nutrient Media | A nutrient-rich growth medium supplying essential minerals, vitamins, and nutrients for microbial growth and product formation [33]. | Used in syngas fermentation to support the growth of acetogenic bacteria; composition can be optimized for specific products [33]. |
| Gas Chromatography (GC) System | Analyzes the composition of biogas (CH₄, CO₂, H₂) and syngas, providing quantitative data on process performance [31] [30]. | Used to measure methane yield in AD experiments and hydrogen production in syngas fermentation studies [31]. |
| HPLC System | Separates, identifies, and quantifies components in a liquid sample, crucial for measuring VFA and alcohol concentrations [29]. | Used to monitor VFA accumulation (e.g., acetic, propionic acid) in AD and syngas fermentation broths [29] [28]. |
Anaerobic digestion, syngas fermentation, and conventional fermentation each present distinct profiles of technical maturity, product versatility, and operational challenges. AD is a robust technology for waste management and renewable energy (biogas) production, with performance highly dependent on OLR and capable of enhancement through integration with MECs [31] [28]. Syngas fermentation offers a unique pathway to convert gaseous waste streams into a flexible array of high-value chemicals, though its scalability is currently constrained by gas-mass transfer limitations [29] [30]. The future of these biochemical pathways lies in integrated biorefinery approaches. Combining thermochemical processes like gasification with biochemical syngas fermentation can maximize resource recovery from complex biomass, creating a more circular and sustainable bioeconomy [18] [30]. Continued research in microbial strain selection, metabolic engineering, and advanced reactor design will be crucial to overcome existing bottlenecks and unlock the full potential of these technologies.
Thermochemical conversion represents a suite of technologies that utilize heat and chemical processes to transform biomass into valuable energy products, including biofuels, bio-oil, syngas, and biochar. These technologies stand in contrast to biochemical conversion methods, which rely on biological agents like enzymes and microorganisms to break down biomass at lower temperatures [1]. The thermochemical pathway is characterized by its ability to operate at very high temperatures and pressures, efficiently processing a wide range of feedstocks, including lignocellulosic biomass, agricultural residues, and organic wastes [1] [18]. The primary thermochemical technologies—pyrolysis, gasification, and hydrothermal liquefaction (HTL)—offer distinct advantages in terms of processing speed, feedstock flexibility, and product profiles, making them crucial components in the development of sustainable bioenergy systems and the transition toward a circular bioeconomy.
The fundamental principle underlying all thermochemical processes is the decomposition of complex organic polymers in biomass through the application of heat under controlled environments. This decomposition leads to the production of solid, liquid, and gaseous fuels, with the specific product distribution depending on the process parameters and the technology employed [13]. Compared to biochemical pathways, thermochemical methods generally offer higher energy output per unit of biomass, with studies indicating yields ranging from 0.1–15.8 MJ/kg depending on the feedstock and process conditions [35]. However, these processes also typically incur greater greenhouse gas emissions (0.003–1.2 kg CO₂/MJ) and higher costs (0.01–0.1 USD/MJ) than their biochemical counterparts, highlighting important trade-offs that must be considered in technology selection [35].
Comparative Analysis of Thermochemical Technologies
The following table provides a systematic comparison of the three major thermochemical conversion technologies across key technical and operational parameters.
Table 1: Comparative Analysis of Major Thermochemical Conversion Technologies
| Parameter | Pyrolysis | Gasification | Hydrothermal Liquefaction (HTL) |
|---|---|---|---|
| Process Definition | Thermal decomposition in the absence of oxygen [13] | Partial oxidation of carbonaceous feedstock [13] | Conversion of wet biomass in aqueous medium at high pressure and temperature [36] [37] |
| Typical Temperature Range | Varies by type: Fast (300-700°C), Slow (300-550°C) [18] | Typically above 700°C [18] | 220-350°C [36] [37] |
| Pressure Conditions | Atmospheric [18] | Atmospheric or elevated [18] | 6-20 MPa (high pressure) [37] |
| Primary Product | Bio-oil, Biochar, Syngas [13] | Syngas (H₂, CO, CH₄, CO₂) [13] | Biocrude (Bio-oil) [36] [38] |
| Feedstock Moisture Requirement | Low moisture required (<10-15%) [18] | Low to moderate moisture preferred [18] | Handles high moisture biomass (>50%); no drying needed [37] |
| Reaction Time | Fast: 3-5 seconds; Slow: 30-180 minutes [18] | Seconds to minutes (continuous process) | 15 minutes to 90 minutes [18] [37] |
| Key Advantages | High bio-oil yield (fast pyrolysis); Biochar production [18] | Syngas flexibility for power, fuels, chemicals [13] | Processes wet feedstocks directly; energy-efficient for high-moisture biomass [37] |
| Key Challenges | Requires dry feedstock; bio-oil requires upgrading [18] | Tar formation; syngas cleaning required [18] | High-pressure equipment; corrosion issues [18] |
Technology-Specific Operational Protocols
Pyrolysis
Pyrolysis involves the thermal decomposition of biomass in the complete absence of oxygen. The process can be categorized into slow, fast, and flash pyrolysis, with the primary differences being heating rate, temperature, and residence time, which ultimately determine the product distribution [18] [13].
Detailed Experimental Protocol:
- Feedstock Preparation: Biomass feedstock (e.g., rice straw, wood chips) is dried to a moisture content below 10-15% and ground to particles of 1-2 mm size to ensure efficient heat transfer [18].
- Reactor Configuration: The processed feedstock is fed into a pyrolysis reactor (e.g., fluidized bed, fixed bed). An inert atmosphere is established and maintained by purging with nitrogen gas at a flow rate of 0.5-1 L/min.
- Process Conditions: The reactor is heated to the target temperature (300-700°C) at a defined heating rate (e.g., 10-100°C/min for slow pyrolysis; >1000°C/s for fast pyrolysis). Vapors are rapidly condensed in a condensation system maintained at 0-4°C.
- Product Collection: The condensed liquid is collected as bio-oil. Non-condensable gases (syngas) are collected in gas bags or vented. Solid residue (biochar) is collected after the reactor cools down [13].
Gasification
Gasification converts biomass into a combustible gas mixture (syngas) through a partial oxidation reaction at high temperatures [13].
Detailed Experimental Protocol:
- Feedstock Preparation: Biomass is dried (moisture content ~10-15%) and sized to 1-5 cm particles to ensure uniform gas flow.
- Reactor Operation: Biomass is fed into a gasifier (e.g., fluidized bed, downdraft). A controlled amount of gasifying agent (air, oxygen, or steam) is introduced. For air gasification, an equivalence ratio (ER) of 0.2-0.4 is typically maintained.
- Process Conditions: The reactor operates at temperatures typically above 700°C. The residence time for solids ranges from minutes to hours, while gas residence time is on the order of seconds.
- Syngas Cleaning: The raw syngas containing contaminants like tar, particulates, and alkali compounds is passed through a series of cleaning units—cyclones, scrubbers, and filters—to produce clean syngas suitable for end-use applications [18].
Hydrothermal Liquefaction (HTL)
HTL is a thermochemical process specifically designed to convert high-moisture biomass into biocrude in a hot, pressurized water environment [36] [38] [37].
Detailed Experimental Protocol:
- Slurry Preparation: Wet biomass (e.g., microalgae, macroalgae, food waste) is homogenized with water to create a slurry with 10-20% solid content. No prior drying is required.
- Reactor Loading: The slurry is loaded into a high-pressure batch reactor (e.g., Parr reactor). The reactor is sealed and purged with an inert gas like nitrogen to remove oxygen.
- Process Conditions: The reactor is heated to a target temperature between 240-320°C while maintaining autogenous pressure, typically in the range of 15-30 MPa. The mixture is held at this condition for a reaction time of 15-90 minutes with continuous stirring [36] [37].
- Product Separation: After the reaction, the reactor is cooled to room temperature. The gas phase is vented and collected. The remaining products are separated by solvent extraction (e.g., using dichloromethane) or centrifugation into four phases: biocrude, aqueous phase, solid biochar, and gas [36].
Figure 1: Decision workflow for selecting thermochemical conversion technologies based on feedstock moisture and target products.
The Scientist's Toolkit: Essential Research Reagents and Materials
Successful experimental research in thermochemical conversion requires specific reagents, catalysts, and materials. The following table details key items and their functions.
Table 2: Essential Research Reagents and Materials for Thermochemical Conversion Experiments
| Reagent/Material | Function/Application | Specific Examples |
|---|---|---|
| Biomass Feedstocks | Raw material for conversion; composition affects yield and product quality. | Agricultural residues (rice straw, wheat straw) [13], Algal biomass (Chlorella, Nannochloropsis) [36], Forestry residues, Organic waste [37] |
| Catalysts | Enhance reaction rates, improve product yield and quality, and reduce operating temperatures. | Heterogeneous Catalysts: MoO₃, Zeolites, Base transition metals (e.g., Co, Ni) [36]. Homogeneous Catalysts: Alkali catalysts (e.g., Na₂CO₃) [36]. |
| Gasifying Agents | React with biomass during gasification to produce syngas. | Air, Oxygen, Steam [18] [13] |
| Solvents | Used for product separation, extraction, and sometimes as a reaction medium. | Water (for HTL), Dichloromethane (for biocrude extraction), Ethanol, Methanol [36] |
| Inert Gases | Create an oxygen-free environment for pyrolysis and HTL reactions. | Nitrogen (N₂), Helium (He) [36] |
| High-Pressure Reactors | Withstand high temperatures and pressures for HTL and gasification. | Batch reactors (Parr reactors), Continuous flow reactors [36] [37] |
Pyrolysis, gasification, and hydrothermal liquefaction each offer distinct advantages and face unique challenges in converting biomass into valuable energy products. Pyrolysis is optimal for producing bio-oil and biochar from dry feedstocks, gasification excels in syngas production for power and chemical synthesis, and HTL provides a unique solution for converting wet biomass without energy-intensive drying. The choice of technology depends heavily on feedstock characteristics, desired products, and economic considerations. Continued research focusing on catalyst development, process optimization, and economic feasibility is essential to overcome existing barriers and fully realize the potential of these thermochemical technologies in the global renewable energy landscape.
The transition from fossil-based fuels to renewable energy sources is a critical global endeavor, with lignocellulosic biomass serving as a pivotal sustainable alternative [11] [18]. The effective conversion of this biomass into biofuels, power, and chemicals hinges on selecting and optimizing appropriate technological pathways, primarily categorized as biochemical or thermochemical conversion [13]. These pathways differ fundamentally in their operational mechanisms, with biochemical processes employing biological catalysts like enzymes and microorganisms, and thermochemical processes relying on elevated temperatures and, often, inorganic catalysts to deconstruct biomass [1]. The performance, product yield, and economic viability of these systems are profoundly governed by their core process parameters. This guide provides a detailed, data-driven comparison of the essential operating conditions—temperature ranges, residence times, and catalytic requirements—for these two distinct pathways, offering researchers a foundational resource for technology selection and process design.
Comparative Analysis of Operating Parameters
The following tables summarize the key operational parameters for the primary conversion technologies within biochemical and thermochemical pathways.
Table 1: Core Operating Parameters for Thermochemical Conversion Processes
| Process | Temperature Range (°C) | Residence Time | Pressure | Catalytic Requirements | Primary Product(s) |
|---|---|---|---|---|---|
| Slow Pyrolysis [39] [40] | ~400 °C | 30–180 minutes [18] | Ambient | Often non-catalytic; catalysts may be used for bio-oil upgrading (e.g., zeolites) [11] | Biochar [40] |
| Fast Pyrolysis [39] [40] | 500–650 °C | 3–5 seconds [18] | Ambient | Catalysts (e.g., HZSM-5) used in catalytic fast pyrolysis to deoxygenate bio-oil [11] [39] | Bio-oil [40] |
| Gasification [39] | 700–1200 °C [39] | Seconds to minutes (for gas) | Ambient / Elevated | In-bed catalysts (e.g., dolomite, Ni-based) can be used to reduce tar and reform hydrocarbons [39] | Syngas (CO, H₂) [13] |
| Hydrothermal Liquefaction (HTL) [18] | 280–370 °C | ~90 minutes [18] | High (to keep water liquid) | Heterogeneous catalysts (e.g., Pt, Ru) can be used to improve bio-crude yield and quality [11] | Bio-crude |
| Combustion [11] | >800 °C | N/A | Ambient | Non-catalytic | Heat |
Table 2: Core Operating Parameters for Biochemical Conversion Processes
| Process | Temperature Range (°C) | Residence Time/HRT | pH | Catalytic Requirements | Primary Product(s) |
|---|---|---|---|---|---|
| Anaerobic Digestion [13] | Mesophilic: 30–40 °CThermophilic: 50–60 °C | 15–30 days | Neutral (~7) | Microbial consortia (hydrolytic, acidogenic, acetogenic, methanogenic bacteria) [13] | Biogas (CH₄, CO₂) [13] |
| Fermentation (for Ethanol) [19] | 30–37 °C (for yeast) | 48–96 hours | ~5 (after neutralization) | Biological catalysts (yeast, e.g., S. cerevisiae); Enzymatic catalysts (cellulases, hemicellulases) [19] | Ethanol [19] |
Detailed Experimental Protocols and Methodologies
Thermochemical Pathway: Two-Stage Pyrolysis with In-line Catalytic Reforming for H₂-Rich Gas Production
This protocol outlines an advanced thermochemical process for targeted hydrogen production, integrating pyrolysis and immediate catalytic upgrading of vapors [39].
- 1. Feedstock Preparation: The biomass feedstock (e.g., agricultural waste like rice husk or forestry residue) is air-dried and comminuted using a knife mill to a particle size of 1-2 mm to ensure efficient heat and mass transfer [11] [41].
- 2. Reactor Configuration and Setup: A two-stage reactor system is employed. The first stage is a fluidized bed pyrolysis reactor, and the second is a fixed-bed catalytic reformer connected in-line. The system is purged with an inert gas (N₂) at a flow rate of 0.5 L/min to establish an oxygen-free environment [39].
- 3. Pyrolysis Stage: The biomass is fed into the first reactor, which is heated to a fast pyrolysis temperature of 500 °C at a high heating rate (~100 °C/min). The volatile gases and vapors produced are carried by the N₂ carrier gas into the second reactor [39] [40].
- 4. Catalytic Reforming Stage: The hot vapors from the pyrolysis reactor enter the second fixed-bed reactor, which is maintained at a higher temperature (600-800 °C) and contains a catalyst bed of Ni-based catalyst on an Al₂O₃ support (1-2 mm pellets). The catalyst facilitates cracking and steam reforming reactions, converting heavier hydrocarbons into H₂-rich syngas [39].
- 5. Product Collection and Analysis: The resulting gaseous product is passed through a condenser to remove any residual condensable tars. The non-condensable, H₂-rich syngas is collected in a gas bag. The gas composition (H₂, CO, CO₂, CH₄) is quantified using Gas Chromatography with a Thermal Conductivity Detector (GC-TCD). The solid biochar is collected from the first reactor and weighed [39].
Biochemical Pathway: Separate Hydrolysis and Fermentation (SHF) of Lignocellulosic Biomass
This protocol describes a standard biochemical method for converting the polysaccharides in lignocellulosic biomass into ethanol, involving distinct pretreatment, enzymatic hydrolysis, and fermentation steps [19].
- 1. Feedstock Preparation and Pretreatment: The biomass (e.g., wheat straw or corn stover) is milled to a particle size of <2 mm. A dilute acid pretreatment is performed by treating the biomass with 1% (w/w) H₂SO₄ at a solid-to-liquid ratio of 1:10 at 160 °C for 20 minutes in a pressurized reactor. This step disrupts the lignin sheath and hydrolyzes hemicellulose [19].
- 2. Neutralization and Detoxification: The pretreated slurry is filtered and the pH of the liquid fraction (hydrolysate) is adjusted to 5.0 using Ca(OH)₂ or NaOH to neutralize the acid and create a suitable environment for enzymes and yeast. Inhibitors like furfural may be removed via overliming or adsorption [19].
- 3. Enzymatic Hydrolysis: The washed, pretreated solid fraction (rich in cellulose) is transferred to a bioreactor. A commercial cellulase enzyme cocktail (e.g., 15 FPU/g cellulose) is added in a citrate buffer (pH 4.8-5.0). The hydrolysis is carried out at 50 °C with constant agitation (150 rpm) for 72 hours to convert cellulose to glucose [19].
- 4. Fermentation: The hydrolysate from step 3 is cooled to 32 °C and inoculated with a fermentative microorganism, typically the yeast Saccharomyces cerevisiae (at 10% v/v inoculum). The fermentation is conducted for 48-72 hours under anaerobic conditions without agitation [19].
- 5. Product Recovery: The resulting "beer" containing ~5-10% ethanol is distilled and dehydrated using molecular sieves to achieve fuel-grade ethanol (>99.5% purity) [19].
Pathway Visualization and System Workflows
The following diagram illustrates the logical workflow and key decision points for selecting and implementing biomass conversion pathways based on feedstock characteristics and desired products.
Diagram 1: Biomass conversion pathway selection logic.
The Scientist's Toolkit: Essential Research Reagents and Materials
Table 3: Key Reagents and Materials for Biomass Conversion Research
| Reagent/Material | Function/Application | Example Specifications |
|---|---|---|
| Ni-Based Catalyst [39] | Catalytic reforming of pyrolysis vapors for H₂ production; tar cracking in gasification. | Ni (5-20 wt%) supported on Al₂O₃; pellet size 1-2 mm. |
| HZSM-5 Zeolite [11] [39] | Catalytic upgrading of bio-oil via deoxygenation, cracking, and aromatization. | SiO₂/Al₂O₃ ratio: 25-50; powder or pellet form. |
| Cellulase Enzyme Cocktail [19] | Hydrolysis of cellulose to fermentable glucose in biochemical processes. | Activity: ≥15 Filter Paper Units (FPU)/mL. |
| Saccharomyces cerevisiae [19] | Fermentative microorganism for converting sugars to ethanol. | Commercial dry yeast; 10% (v/v) inoculum size. |
| Dilute Sulfuric Acid (H₂SO₄) [19] | Acid pretreatment of biomass to solubilize hemicellulose. | Concentration: 0.5-1.5% (w/w). |
| Inert Gas (N₂) [39] | Creating an oxygen-free environment for pyrolysis and gasification. | Purity: ≥99.99%. |
The transition toward a sustainable bioeconomy hinges on the efficient conversion of biomass into a portfolio of valuable products, including biofuels, biochar, syngas, and various chemicals. Two primary technological pathways—thermochemical and biochemical conversion—enable this transformation, each with distinct mechanisms, operational parameters, and output profiles. Thermochemical conversion utilizes heat and chemical processes to decompose biomass at elevated temperatures (typically 300–1000 °C), yielding products like bio-oil, syngas, and biochar [1] [11]. In contrast, biochemical conversion employs biological agents such as enzymes and microorganisms to break down biomass at low temperatures and pressures, primarily producing biogas and ethanol through processes like anaerobic digestion and fermentation [1] [13]. This guide provides a structured comparison of these pathways, supported by experimental data and protocols, to inform researchers and industry professionals in selecting and optimizing conversion strategies for targeted product outputs.
Comparative Analysis of Conversion Pathways and Product Portfolios
The following table summarizes the core characteristics, operational parameters, and primary products of the two main conversion pathways.
Table 1: Comparative overview of thermochemical and biochemical conversion pathways
| Feature | Thermochemical Conversion | Biochemical Conversion |
|---|---|---|
| Core Mechanism | Decomposition using heat and chemical catalysts [1] | Breakdown by enzymes and microorganisms [1] |
| Process Examples | Pyrolysis, Gasification, Hydrothermal Liquefaction [11] [18] | Anaerobic Digestion, Fermentation [13] [18] |
| Typical Operating Temperature | High (300°C to 1000°C) [1] [11] | Low (Mesophilic: 30-40°C; Thermophilic: 50-60°C) [1] |
| Operating Pressure | Can operate at high pressures [1] | Operates at low pressures [1] |
| Conversion Speed | Rapid (seconds to minutes) [18] | Slow (days to months) [13] |
| Primary Products | Bio-oil, Syngas, Biochar [11] | Biogas (CH₄, CO₂), Ethanol, Organic Acids [13] |
| Key Value-added Chemicals | Furans, Levoglucosan, Phenol [11] | Ethanol, Butanol, Organic Acids [18] |
Product Portfolio from Different Pathways
- Thermochemical Product Range: The portfolio is diverse and influenced by process conditions. Pyrolysis, especially fast pyrolysis, is optimized for bio-oil production, which can be upgraded into fuels or chemicals [11] [18]. Gasification produces syngas (a mixture of CO, H₂, CH₄, CO₂), which is a precursor for power generation or chemical synthesis (e.g., via Fischer-Tropsch process) [11] [42]. Biochar is a solid carbon-rich product from slower pyrolysis processes, with applications in soil amendment, carbon sequestration, and as a catalyst [43] [44].
- Biochemical Product Range: This pathway specializes in biogas production via anaerobic digestion, primarily composed of methane and carbon dioxide, which can be purified to biomethane [13]. Fermentation processes are adept at converting sugars into liquid biofuels like ethanol and butanol, as well as various organic acids [18].
Experimental Protocols for Key Processes
Protocol: Biochar Production via Slow Pyrolysis
This protocol outlines the production of biochar from soybean dreg (okara), a model agricultural waste, detailing the influence of drying methods and pyrolysis temperature [43].
- 1. Feedstock Preparation: Obtain soybean dregs (okara) from a tofu/soymilk processing facility. Wash the fresh okara at least three times with deionized water to remove impurities. Divide the cleaned biomass into batches for different drying methods:
- Oven Drying: Dry in a laboratory oven (e.g., Memmert) at 60°C until constant weight.
- Freeze Drying: Dry using a freeze dryer (e.g., SP Scientific) to preserve the honeycomb structure of the biomass.
- 2. Pyrolysis Reactor Setup: Utilize a horizontal tube furnace for the pyrolysis process. Ensure the system can maintain an oxygen-limited or inert atmosphere (e.g., using a nitrogen gas purge).
- 3. Pyrolysis Procedure:
- Load a portion of the dried okara into the reactor tube.
- Purge the system with an inert gas (e.g., N₂) for approximately 30 minutes to eliminate oxygen.
- Increase the temperature to the target pyrolysis temperature (e.g., 400°C, 500°C, 600°C) at a controlled heating rate (e.g., 10°C/min).
- Maintain the target temperature for a defined residence time (e.g., 1-2 hours).
- After the hold time, allow the reactor to cool to room temperature under continued inert gas flow.
- Collect the solid residue, which is the biochar, and weigh it to determine yield.
- 4. Biochar Activation (Optional - Chemical Activation): To enhance properties like surface area, the biochar can be activated. Impregnate the biochar with a chemical agent like KOH (e.g., 1:1 mass ratio of KOH to biochar) followed by thermal treatment at a higher temperature (e.g., 600-800°C) under an inert atmosphere. The resulting material is then washed with dilute HCl and deionized water to a neutral pH and dried [44].
- Key Parameters & Data: The choice of drying method significantly impacts the final biochar. Freeze-drying preserves the biomass structure, leading to biochar with a higher specific surface area [43]. Pyrolysis temperature is critical; higher temperatures (≥500°C) generally produce biochar with a higher surface area, greater carbon content, and higher chemical stability [43] [44].
Protocol: Syngas Production from Biomass-Plastic Co-Gasification
This protocol describes a data-driven approach using machine learning to optimize syngas composition from the co-gasification of biomass and plastic, a process that can enhance hydrogen yield and reduce tar formation [42].
- 1. Feedstock Preparation and Characterization:
- Select biomass types (e.g., agricultural residues) and common plastics (e.g., Polyethylene (PE), Polyethylene terephthalate (PET), Polystyrene (PS)).
- Characterize all feedstocks through ultimate analysis (C, H, O, N, S content) and proximate analysis (moisture, volatile matter, fixed carbon, ash content).
- 2. Experimental Data Compilation:
- Conduct co-gasification experiments in a suitable reactor (e.g., fluidized bed gasifier) under varying conditions.
- Record operational parameters: temperature, steam-to-fuel ratio, equivalence ratio, and biomass-to-plastic blend ratio.
- Analyze the resulting syngas composition (H₂, CO, CO₂, CH₄, C2-C4 hydrocarbons) for each experimental run using gas chromatography.
- Compile a comprehensive dataset of input variables and corresponding output syngas compositions.
- 3. Machine Learning Model Development & Optimization:
- Train multiple machine learning models (e.g., CatBoost, Random Forest, XGBoost) on the compiled dataset to predict syngas composition based on input parameters.
- Evaluate model performance using metrics like R² (coefficient of determination). Studies have shown CatBoost can achieve R² values of 0.80–0.94 on test data for major syngas components [42].
- Apply interpretability analysis (e.g., SHapley Additive exPlanations - SHAP) to the best-performing model to quantify the influence of each input parameter (e.g., temperature, steam/fuel ratio) on the syngas output.
- Key Insights from Protocol: SHAP analysis reveals that temperature and steam/fuel ratio are the most influential operational parameters. High temperatures favor the production of CO and H₂, while increased steam raises H₂ yield but suppresses CO. The biomass proportion in the feedstock blend significantly affects the H₂/CO ratio and carbon conversion [42].
The following diagram illustrates the core workflows and product outputs for the thermochemical and biochemical conversion pathways.
The Scientist's Toolkit: Essential Research Reagents and Materials
Successful experimentation in biomass conversion requires specific reagents and materials. The following table details key items and their functions in related research protocols.
Table 2: Key research reagents and materials for biomass conversion studies
| Reagent/Material | Function in Research | Example from Protocols |
|---|---|---|
| Lignocellulosic Biomass | Primary feedstock for conversion processes. Composition (cellulose, hemicellulose, lignin) dictates product yield and type. | Soybean dreg (okara), agricultural residues (straw, husks), forestry waste [43] [13]. |
| Chemical Activators | Used to post-treat and upgrade biochar, creating pores and increasing surface area for catalytic or adsorption applications. | KOH, HCl (for washing to neutral pH) [43] [44]. |
| Catalysts | Enhance reaction rates, improve product selectivity, and reduce tar formation in thermochemical processes. | La0.5Ce0.5O2-δ (LCO) for oxidative coupling of methane; metal-supported catalysts for syngas upgrading [45] [44]. |
| Inert Gas | Creates an oxygen-free environment crucial for pyrolysis and gasification to prevent combustion. | Nitrogen (N₂) gas purge [43]. |
| Microbial Consortia | The active agents in biochemical conversion that break down organic matter to produce biogas or ethanol. | Anaerobic sludge, specialized bacteria and archaea for digestion; yeast for fermentation [13] [18]. |
Performance Data and Comparison of Outputs
Quantitative data is essential for evaluating the efficiency and suitability of each conversion pathway. The tables below summarize key performance metrics for the primary products.
Table 3: Performance data for thermochemical conversion products
| Product | Process | Key Metric | Reported Value/Data Range | Influencing Factors |
|---|---|---|---|---|
| Biochar | Slow Pyrolysis | Yield | Varies with feedstock and temperature | Higher lignin content & lower temps (e.g., ~400°C) increase yield [43] [44]. |
| Biochar | Slow Pyrolysis | Specific Surface Area | Up to 400 m²/g after activation [6] | Pyrolysis temperature, activation method (e.g., KOH) [44]. |
| Syngas | Co-gasification | H₂/CO Ratio | Adjustable via process parameters | Increased steam raises H₂ but suppresses CO; biomass proportion affects ratio [42]. |
| Syngas | Co-gasification | Heating Value | Up to 10.9 MJ m⁻³ [5] | Feedstock composition and gasification conditions. |
| Bio-oil | Pyrolysis | Yield | Up to 67.9 wt% from refuse-derived fuel [5] | Fast pyrolysis conditions, temperature, feedstock. |
Table 4: Performance data for biochemical conversion products
| Product | Process | Key Metric | Reported Value/Data Range | Influencing Factors |
|---|---|---|---|---|
| Biogas | Anaerobic Digestion | Yield | Highly variable based on feedstock | Organic loading rate, temperature, retention time [13]. |
| Biogas | Anaerobic Digestion | Methane (CH₄) Content | Typically 50-70% of biogas [13] | Feedstock composition, digester health. |
| Ethanol | Fermentation | Yield | Dependent on sugar content and efficiency | Feedstock pretreatment, microbial strain, inhibition [18]. |
The choice between thermochemical and biochemical conversion pathways is not a matter of superiority but of strategic alignment with project goals, feedstock availability, and desired product portfolios. Thermochemical processes, characterized by high speed, high temperature, and versatility, are well-suited for producing a wide array of solid, liquid, and gaseous fuels and chemical precursors [1] [11] [18]. In contrast, biochemical pathways offer a low-energy, microbial-driven route primarily to biogas and ethanol, though they face challenges with slower conversion rates and pretreatment requirements [1] [13].
Future advancements will be driven by integrated biorefinery models that combine the strengths of both pathways to maximize resource efficiency [18]. Furthermore, the integration of machine learning and AI for process prediction and optimization, as demonstrated in syngas production, represents a powerful tool for accelerating research and improving the economic viability of biomass conversion technologies [11] [42]. The continued development of robust catalysts and efficient pretreatment methods will be crucial in advancing the commercial-scale production of biofuels, biochar, syngas, and value-added chemicals from renewable biomass.
Integrated biorefineries represent a paradigm shift in bio-based production, moving from single-product facilities toward multi-product, multi-pathway complexes that maximize resource utilization and economic viability. By combining various biochemical and thermochemical conversion pathways, these advanced facilities can process a diverse range of biomass feedstocks—from agricultural residues and energy crops to municipal solid waste—into an array of biofuels, bio-chemicals, and biomaterials. This integrated approach significantly enhances resource efficiency by enabling the complete valorization of biomass components, creating synergistic relationships between different conversion technologies, and improving overall process economics through product diversification [46].
The fundamental principle behind integrated biorefineries mirrors that of traditional petroleum refineries: through flexible processing architectures, they can optimize product slates in response to market demands while minimizing waste streams. This operational flexibility is crucial for navigating the variable composition of biomass feedstocks, which can differ significantly in their cellulose, hemicellulose, and lignin content [11]. By combining multiple conversion platforms, integrated biorefineries can direct specific biomass fractions to their highest-value uses, thereby addressing one of the most significant challenges in biomass processing—the technological and economic limitations of single-pathway approaches [47] [48].
Comparative Analysis of Conversion Pathways
Biochemical Conversion Pathways
Biochemical conversion utilizes enzymes and microorganisms as biological catalysts to break down biomass into intermediary compounds that are subsequently converted to fuels and chemicals. The process typically begins with biomass pretreatment to disrupt the recalcitrant lignocellulosic structure, followed by enzymatic hydrolysis to depolymerize cellulose and hemicellulose into monomeric sugars, and concludes with microbial fermentation where engineered microorganisms convert these sugars into target products [47] [49].
The primary advantage of biochemical pathways lies in their high selectivity for specific products under mild operating conditions (typically 20-60°C and ambient pressure), which translates to lower energy inputs compared to thermochemical processes. Common biochemical products include bioethanol through yeast fermentation, biogas (primarily methane and CO₂) via anaerobic digestion, and various organic acids and biopolymers through specialized microbial strains [47]. However, biochemical conversion faces significant challenges, including the cost and difficulty in breaking the complex structure of lignocellulosic cell walls, the relatively slow conversion rates of biological systems, sensitivity to inhibitors generated during pretreatment, and the need for sterile conditions in many processes [47] [49].
Table 1: Key Characteristics of Biochemical Conversion Processes
| Parameter | Alcoholic Fermentation | Anaerobic Digestion |
|---|---|---|
| Primary Products | Bioethanol, Butanol | Biogas (CH₄, CO₂), Digestate |
| Typical Feedstocks | Sugarcane, Corn, Cellulosic Biomass | Organic Waste, Manure, Sewage |
| Operating Conditions | 20-37°C, pH 4.5-6.0 | 35-55°C, Anaerobic |
| Conversion Time | 48-96 hours | 15-30 days |
| Key Challenges | Inhibitor Tolerance, Sugar Yield | Slow Rate, Sulfur Content |
Thermochemical Conversion Pathways
Thermochemical conversion employs heat and chemical processes to transform biomass into energy and chemicals through thermal degradation of biomass components. The four principal thermochemical pathways are pyrolysis (thermal decomposition in absence of oxygen), gasification (partial oxidation to produce syngas), combustion (complete oxidation for heat/power), and hydrothermal liquefaction (conversion in hot, pressurized water) [48] [11].
These processes operate at significantly higher temperatures (300-1000°C) and shorter residence times compared to biochemical conversion, enabling rapid processing of heterogeneous feedstocks, including those unsuitable for biological processing such as mixed plastics and high-lignin materials. The primary products include bio-oil from pyrolysis, syngas (CO, H₂, CH₄) from gasification, and biochar from slower pyrolysis processes [48] [5]. A key advantage of thermochemical pathways is their ability to process nearly the entire biomass fraction, including lignin which is largely unconvertible through biochemical means. However, these processes face challenges with tar formation that can complicate downstream processing, the need for catalyst development to improve product quality, and potential emissions that require sophisticated control systems [48] [5].
Table 2: Key Characteristics of Thermochemical Conversion Processes
| Parameter | Pyrolysis | Gasification | Combustion |
|---|---|---|---|
| Primary Products | Bio-oil, Biochar, Syngas | Syngas (CO, H₂) | Heat, Electricity |
| Operating Temperature | 400-600°C | 800-1000°C | 800-1100°C |
| Operating Atmosphere | Absence of Oxygen | Limited Oxygen | Excess Oxygen |
| Conversion Efficiency | 60-75% (bio-oil) | 70-85% (syngas) | 20-40% (electricity) |
| Key Challenges | Bio-oil Stability, Upgrading | Tar Removal, Ash Slagging | Emissions Control |
Direct Comparative Analysis
When evaluating biochemical versus thermochemical pathways, each demonstrates distinct advantages depending on feedstock characteristics, desired products, and scale of operation. Biochemical pathways generally offer superior product selectivity and can directly produce specific molecules with functional groups, making them particularly suitable for chemical and pharmaceutical applications. In contrast, thermochemical pathways typically achieve higher carbon conversion efficiencies and faster processing rates, making them advantageous for fuel production and power generation [47] [48].
The table below provides a quantitative comparison of key performance indicators for both pathways based on experimental data and commercial operations:
Table 3: Direct Comparison of Biochemical vs. Thermochemical Conversion Pathways
| Performance Metric | Biochemical Pathway | Thermochemical Pathway |
|---|---|---|
| Typical Feedstock Moisture Content | High (70-90%) [47] | Low (<30%) [48] |
| Operating Temperature Range | 20-60°C [49] | 300-1000°C [48] |
| Residence Time | Days (fermentation) [47] | Seconds to minutes [48] |
| Sugar Recovery Efficiency | 76-92% [47] | N/A |
| Bio-oil Yield | N/A | Up to 67.9 wt% [5] |
| Syngas Heating Value | N/A | Up to 10.9 MJ/m³ [5] |
| Technology Readiness Level | Commercial (1G) to Demonstration (2G) | Commercial to Demonstration |
| Capital Intensity | High (bioreactors, sterilization) | High (high-pressure/temperature reactors) |
| Product Diversity | Medium (fuels, chemicals) | High (fuels, power, chemicals, char) |
Integration Strategies and Synergistic Effects
The integration of biochemical and thermochemical pathways within a single biorefinery complex creates synergistic relationships that enhance overall efficiency, economics, and sustainability. Three primary integration strategies have emerged as particularly promising: sequential fractionation, waste stream valorization, and hybrid processing.
In sequential fractionation, biomass components are first separated and then routed to their optimal conversion pathways. For instance, the carbohydrate fraction (cellulose and hemicellulose) can be directed to biochemical conversion for ethanol production, while the lignin-rich residue undergoes thermochemical processing through pyrolysis or gasification [46]. This approach maximizes the value derived from each biomass component by leveraging the particular strengths of each conversion platform.
The waste stream valorization strategy focuses on converting residual streams from one process into inputs for another. A prominent example is the thermochemical conversion of lignin-rich fermentation residues, which are difficult to digest biologically but represent a valuable feedstock for gasification or pyrolysis to produce syngas, bio-oil, or process heat [47] [48]. Similarly, digestate from anaerobic digestion can be processed through hydrothermal liquefaction, while waste glycerol from biodiesel production can be reformed to hydrogen.
Hybrid processing involves more tightly coupled systems where intermediate products from one process serve as direct inputs to another. For instance, syngas from biomass gasification can be fermented by acetogenic bacteria to produce ethanol or other chemicals through microbial gas fermentation [48]. This combination leverages the high carbon conversion efficiency of gasification with the product specificity of biological systems.
The integration of biorefineries with other industrial processes, such as wastewater treatment facilities or cement manufacturing, represents another emerging strategy. For example, a novel wastewater treatment biorefinery demonstrated significantly enhanced net energy production (increasing from 109 to 325 kWh/(cap·yr)) while achieving nutrient recovery and eliminating major greenhouse gas emissions [50]. Similarly, co-processing of refuse-derived fuel in cement kilns has achieved thermal substitution rates of 50-60% in rotary kilns and 80-100% in calciners, substantially reducing fossil fuel consumption [5].
Experimental Protocols and Methodologies
Biochemical Conversion Experimental Protocol
Biomass Pretreatment and Enzymatic Hydrolysis
- Feedstock Preparation: Reduce biomass particle size to 1-2 mm using a laboratory mill to increase surface area for subsequent processing.
- Dilute Acid Pretreatment: Treat biomass with 1-5% (w/w) sulfuric acid at a solid-to-liquid ratio of 1:10. Heat mixture to 121°C for 30-60 minutes in an autoclave to hydrolyze hemicellulose and disrupt lignin structure [47].
- Neutralization and Detoxification: Adjust pH to 5.0 using calcium hydroxide or sodium hydroxide, followed by removal of inhibitory compounds (furfurals, phenolics) through overliming or activated carbon treatment.
- Enzymatic Hydrolysis: Add commercial cellulase enzyme cocktail (15-20 FPU/g biomass) and β-glucosidase (15-30 CBU/g biomass) to the pretreated biomass. Incubate at 50°C, pH 4.8-5.0, with continuous agitation at 150 rpm for 72-96 hours. Monitor glucose concentration daily using HPLC [47].
- Sugar Recovery Assessment: Calculate sugar yield based on initial carbohydrate content and measure enzyme efficiency as glucose released per unit enzyme protein.
Microbial Fermentation
- Inoculum Preparation: Cultivate Saccharomyces cerevisiae or other suitable microbial strains in YPD medium (10 g/L yeast extract, 20 g/L peptone, 20 g/L glucose) at 30°C with agitation (200 rpm) until mid-exponential phase (OD600 ≈ 6-8).
- Fermentation Setup: Transfer hydrolyzate to fermentation vessel, supplement with nutrients (yeast extract, peptone, ammonium sulfate), and inoculate with 10% (v/v) actively growing microbial culture.
- Process Conditions: Maintain temperature at 30-37°C, pH 5.0-6.0, with mild agitation (100-150 rpm) under anaerobic conditions. Monitor cell density, substrate consumption, and product formation over 48-72 hours [49].
- Product Analysis: Quantify ethanol or other fermentation products using GC-MS or HPLC. Calculate yield factors (g product/g sugar consumed), volumetric productivity (g/L/h), and final titer (g/L).
Thermochemical Conversion Experimental Protocol
Biomass Pyrolysis for Bio-oil Production
- Feedstock Preparation: Dry biomass to moisture content <10% using an oven at 105°C for 24 hours, then grind and sieve to 0.5-1.0 mm particle size to ensure uniform heating.
- Reactor Configuration: Utilize a bench-scale fluidized bed reactor with continuous biomass feeding capability. Preheat reactor to desired temperature (400-600°C) under inert nitrogen atmosphere (flow rate: 0.5-1.0 L/min) [48] [11].
- Pyrolysis Operation: Introduce biomass at feed rate of 100-500 g/h with residence time of 1-5 seconds in the hot zone. Collect liquid products in a condensation train maintained at 0-4°C, non-condensable gases in gas bags, and solid biochar in a separate collection vessel.
- Product Characterization:
- Analyze bio-oil for water content (Karl Fischer titration), pH, viscosity, and chemical composition (GC-MS).
- Determine biochar yield, proximate analysis (moisture, volatile matter, fixed carbon, ash), and elemental composition.
- Quantify gas composition (CO, CO₂, H₂, CH₄) using gas chromatography with TCD detector [11].
- Yield Calculations: Calculate mass balances and product distribution based on initial biomass input and collected fractions.
Catalytic Upgrading of Bio-oil
- Catalyst Preparation: Use zeolite catalysts (HZSM-5, FCC) or transition metals (Ni, Co, Pt) on suitable supports. Activate catalysts under specified conditions (temperature, atmosphere) prior to use.
- Upgrading Process: Employ fixed-bed or fluidized-bed reactor systems at 350-500°C under hydrogen pressure (1-10 MPa) for hydrodeoxygenation. Alternatively, conduct catalytic cracking at atmospheric pressure with nitrogen as carrier gas.
- Product Analysis: Evaluate upgraded oil for oxygen content, heating value, acidity, and stability. Compare composition to petroleum fractions to assess potential for fuel applications [11].
Research Reagent Solutions and Essential Materials
Successful implementation of integrated biorefinery research requires specific reagents, catalysts, and analytical standards. The following table details key research solutions essential for experimental work in this field:
Table 4: Essential Research Reagents and Materials for Biorefinery Research
| Reagent/Material | Function/Application | Specifications/Alternatives |
|---|---|---|
| Cellulase Enzyme Cocktails | Hydrolysis of cellulose to glucose | Trichoderma reesei derived, Activity: 15-100 FPU/g |
| Saccharomyces cerevisiae | Ethanol fermentation from hexoses | Wild-type (ATCC 4126) or engineered strains |
| Clostridium spp. | Butanol/ABE fermentation | C. acetobutylicum (ATCC 824) for solvent production |
| HZSM-5 Zeolite Catalyst | Bio-oil catalytic upgrading | SiO₂/Al₂O₃ ratio: 25-40, for deoxygenation |
| Nickel-Based Catalysts | Syngas reforming and upgrading | 10-20% Ni on Al₂O₃, for methanation/water-gas shift |
| Sulfuric Acid | Biomass pretreatment | 1-5% (w/w) for dilute acid pretreatment |
| Sodium Hydroxide | Alkaline pretreatment & pH adjustment | 0.5-4% (w/w) for delignification |
| Anaerobic Chamber | Oxygen-free fermentation setup | <1 ppm O₂ for strict anaerobe cultivation |
| HPLC System | Sugar, acid, inhibitor quantification | Bio-Rad Aminex HPX-87H column, RID detection |
| GC-MS System | Bio-oil composition analysis | DB-5 capillary column, EI ionization, NIST library |
The future development of integrated biorefineries is evolving along several innovative trajectories that promise to enhance efficiency, sustainability, and economic viability. Artificial intelligence and machine learning are increasingly being deployed to optimize complex biorefinery operations, with algorithms capable of predicting biomass conversion yields, optimizing process parameters, and identifying optimal product slates based on market conditions [11]. The integration of precision fermentation technologies enables production of higher-value products, including pharmaceuticals, nutraceuticals, and specialty chemicals, which can significantly improve biorefinery economics [51].
The emerging focus on carbon accounting and lifecycle assessment is driving the development of standardized methodologies for quantifying the environmental benefits of integrated biorefineries, particularly their potential for carbon dioxide removal through bioenergy with carbon capture and storage (BECCS) [46]. International collaborations, such as the Integrated Biorefineries Mission under Mission Innovation, are working to harmonize evaluation frameworks and accelerate technology deployment through joint research programs and funding initiatives [46].
In conclusion, integrated biorefineries combining biochemical and thermochemical pathways represent the most promising approach for comprehensive biomass valorization. By leveraging the complementary strengths of both conversion platforms, these facilities can maximize resource efficiency, enhance economic resilience through product diversification, and significantly advance the transition toward circular bioeconomies. Future research should focus on improving system integration, developing advanced catalysts and biocatalysts, reducing capital and operating costs, and establishing standardized sustainability metrics to guide technology development and policy support.
Overcoming Technical Bottlenecks: Pretreatment, Catalyst Development, and Process Intensification
Lignocellulosic biomass (LCB), primarily composed of cellulose (30-50%), hemicellulose (20-43%), and lignin (15-30%), represents the most abundant renewable organic resource on Earth, with annual production exceeding 220 billion tons [52]. Despite its abundance, the inherent recalcitrance of LCB poses a significant challenge to its conversion into biofuels and value-added products. This recalcitrance stems from the complex hierarchical structure where lignin acts as a protective "glue," forming a robust lignin-carbohydrate complex (LCC) that shields cellulose and hemicellulose from enzymatic and microbial degradation [53] [54]. The crystalline structure of cellulose and the physical barrier created by hemicellulose further contribute to this natural resistance to deconstruction [55].
Pretreatment is the critical first step in biorefining processes to overcome biomass recalcitrance. Effective pretreatment disrupts the lignocellulosic matrix, removes lignin, increases porosity and surface area, and enhances enzyme accessibility to carbohydrates [52]. An optimal pretreatment method should be low-cost, adaptable to various feedstocks, maximize carbohydrate recovery, and minimize inhibitor generation that can hinder downstream processes [53]. The selection of appropriate pretreatment technology significantly influences the overall economic viability and sustainability of biorefineries, with this step accounting for a substantial portion of total processing costs [53] [56].
Within the broader context of biomass conversion pathways, pretreatment serves as the gateway step for both biochemical and thermochemical processes. Biochemical conversion utilizes biological agents like enzymes and microorganisms to break down pretreated biomass into fuels such as ethanol at relatively low temperatures and pressures [1]. In contrast, thermochemical conversion employs heat and chemical catalysts to decompose biomass into bio-oil, syngas, or biochar through processes like pyrolysis and gasification, operating at high temperatures and pressures [1] [13]. The fundamental difference lies in their conversion mechanisms: biochemical pathways selectively deconstruct biomass components, while thermochemical methods rapidly transform entire biomass into energy-dense intermediates [13].
Comprehensive Analysis of Pretreatment Techniques
Classification and Mechanisms of Pretreatment Technologies
Pretreatment methods are broadly categorized into physical, chemical, physicochemical, biological, and combined approaches, each with distinct mechanisms for overcoming biomass recalcitrance. Physical methods including milling, grinding, and irradiation reduce particle size, decrease cellulose crystallinity, and increase surface area through mechanical energy input [56]. Chemical approaches employ acids, alkalis, ionic liquids, or organic solvents to break lignin-carbohydrate linkages and solubilize lignin and hemicellulose [53] [52]. Physicochemical techniques such as steam explosion and ammonia fiber expansion (AFEX) combine physical and chemical actions using high pressure and temperature with chemical reagents [53]. Biological pretreatment utilizes fungi and enzymes to selectively degrade lignin with minimal energy input, though processing times can be lengthy [52].
The deconstruction mechanism varies significantly across methods. Alkaline pretreatments like ammonia soaking effectively cleave ester bonds in LCCs, causing lignin dissolution and structural swelling [57]. Ionic liquids disrupt hydrogen bonding networks and dissolve crystalline cellulose through their unique solvent properties [53]. Hydrothermal methods employ hot water or steam to hydrolyze hemicellulose and redistribute lignin [58]. Deep eutectic solvents, an emerging option, fractionate biomass components through hydrogen bond donation and acceptance [53]. Each mechanism targets different aspects of recalcitrance, resulting in varied compositional changes and inhibitor profiles that significantly influence downstream conversion efficiency.
Comparative Performance of Leading Pretreatment Technologies
Table 1: Comparative analysis of major pretreatment technologies for lignocellulosic biomass
| Pretreatment Method | Mechanism of Action | Optimal Conditions | Lignin Removal | Hemicellulose Recovery | Inhibitors Generated | Compatibility with Conversion Pathways |
|---|---|---|---|---|---|---|
| Dilute Acid | Hydrolyzes hemicellulose, disrupts lignin structure | 140-190°C, 0.5-2% H₂SO₄ [56] | Moderate | Low (significant degradation) | High (furfural, HMF, acetic acid) [52] | Biochemical (with detoxification) |
| Alkaline (Ammonia) | Cleaves lignin-carbohydrate bonds, causes swelling | 75-180°C, 15-18% NH₃ [58] [57] | Moderate to High | High | Low | Primarily biochemical |
| Hydrothermal | Hydrolyzes hemicellulose, redistributes lignin | 180-220°C, liquid hot water [58] | Low to Moderate | Moderate | Moderate (acetic acid, furan derivatives) | Both biochemical & thermochemical |
| Ionic Liquid | Dissolves cellulose, disrupts hydrogen bonding | 90-150°C, 10-15% IL [58] | High | High | Low (but IL toxicity concerns) | Primarily biochemical |
| Steam Explosion | Autohydrolysis, shearing forces | 160-260°C, 0.7-4.8 MPa [53] | Moderate | Moderate | Moderate (furan derivatives) | Both biochemical & thermochemical |
| Biological | Enzymatic lignin degradation | 25-40°C, fungi/enzymes [52] | Selective but slow | High | Negligible | Primarily biochemical |
Table 2: Experimental performance data for different pretreatment methods on various feedstocks
| Pretreatment Method | Feedstock | Sugar Yield (g/L) | Ethanol Titer (g/L) | Ethanol Productivity (g/L/h) | Lipid Recovery | Reference |
|---|---|---|---|---|---|---|
| Soaking in Aqueous Ammonia (SAA) | Transgenic sugarcane (Oilcane) | 253.73 | 100.62 | 2.08 | Reduced in ammonia-pretreated bagasse [58] | [58] |
| Hydrothermal | Transgenic sugarcane (Oilcane) | 213.10 | 64.47 | 0.53 | Higher lipid retention [58] | [58] |
| Ionic Liquid | Transgenic sugarcane (Oilcane) | 154.20 | 52.95 | 0.36 | Reduced in IL-pretreated bagasse [58] | [58] |
| Ammonia Fiber Expansion (AFEX) | Corn stover | ~85% theoretical glucose yield | N/A | N/A | N/A | [57] |
| Liquid Hot Water | Corn stover | ~90% theoretical xylose yield | N/A | N/A | N/A | [53] |
Recent comparative studies on transgenic sugarcane lines demonstrate the significant impact of pretreatment selection on conversion efficiency. Soaking in aqueous ammonia (SAA) achieved superior sugar yields (253.73 g/L) and ethanol titers (100.62 g/L) compared to hydrothermal and ionic liquid methods [58]. The lower acetic acid concentration in ammonia-pretreated hydrolysates enhanced fermentability, resulting in higher ethanol productivity (2.08 g L⁻¹ h⁻¹) [58]. For lipid-accumulating oilcane lines, pretreatment selection significantly influenced lipid recovery, with hydrothermal methods better preserving lipids while ammonia and ionic liquid treatments reduced fatty acid content in bagasse [58].
Advanced and Emerging Pretreatment Strategies
Integrated pretreatment approaches combining multiple methods show promise for overcoming limitations of individual techniques. Chemical-biological hybrids reduce processing time and chemical consumption while minimizing inhibitor formation [53]. Mechanical-chemical combinations like biomass milling with chemical treatment reduce energy input while enhancing digestibility [56]. For instance, combining ball milling with hot compressed water treatment reduced pretreatment energy and enzyme loading while maintaining high sugar yields [56].
Advanced solvent systems including ionic liquids (e.g., cholinium lysinate) and deep eutectic solvents offer tailored deconstruction with excellent recyclability [53] [58]. These green solvent technologies effectively fractionate biomass components under milder conditions with minimal inhibitor generation. Ammonia-based methods have evolved into advanced configurations like Ammonia Fiber Expansion (AFEX), Extractive Ammonia (EA), and Compacted Biomass with Recycled Ammonia (COBRA), which improve feedstock logistics while maintaining conversion efficiency [57].
Machine learning and artificial intelligence are increasingly applied to optimize pretreatment processes, finding hidden patterns and correlations where traditional methods face challenges [53] [55]. These data-driven approaches enable predictive modeling of biomass composition effects on pretreatment efficiency and real-time monitoring of biorefinery processes [53]. The integration of AI accelerates the development of tailored pretreatment strategies for specific biomass varieties and target products.
Experimental Protocols and Methodologies
Standardized Experimental Workflows
Table 3: Essential research reagents and solutions for pretreatment studies
| Reagent/Solution | Composition/Specifications | Primary Function in Pretreatment | Application Examples |
|---|---|---|---|
| Cholinium Lysinate | 10-15% (w/w) in water [58] | Ionic liquid that solubilizes lignin and disrupts crystalline cellulose | Pretreatment of oilcane bagasse at 140°C [58] |
| Aqueous Ammonia | 15-18% (w/v) ammonium hydroxide [58] | Alkaline agent that cleaves lignin-carbohydrate complexes | Soaking in Aqueous Ammonia (SAA) at 75°C for 3.5h [58] |
| Cellulase Enzyme Cocktail | Multi-enzyme mixtures (cellulase, β-glucosidase, hemicellulase) | Hydrolyzes cellulose to fermentable glucose | Enzymatic hydrolysis following pretreatment [56] |
| Deep Eutectic Solvents | Natural eutectic mixtures (e.g., choline chloride-urea) | Green solvent for lignin removal and cellulose swelling | Emerging pretreatment for various agricultural residues [53] |
| Sulfuric Acid | 0.5-2% (w/w) in water [56] | Acid catalyst that hydrolyzes hemicellulose to xylose | Dilute acid pretreatment at 140-190°C [56] |
Analytical Methodologies for Evaluation
Comprehensive analysis of pretreatment effectiveness requires multiple characterization techniques. Fourier Transform Infrared Spectroscopy (FTIR) identifies chemical bond changes and functional group modifications in lignin, cellulose, and hemicellulose [53]. X-ray Diffraction (XRD) determines cellulose crystallinity index by comparing primary peak intensity to minimum intensity between prominent peaks [53]. Scanning Electron Microscopy (SEM) visualizes morphological changes, surface roughness, and porosity development in pretreated biomass [53].
Compositional analysis following National Renewable Energy Laboratory (NREL) standards quantifies cellulose, hemicellulose, and lignin content before and after pretreatment [58]. High-Performance Liquid Chromatography (HPLC) measures sugar yields (glucose, xylose) and inhibitor concentrations (furfural, hydroxymethylfurfural, acetic acid) in hydrolysates [58]. For specialized analysis, 2D HSQC NMR spectroscopy characterizes lignin structure and lignin-carbohydrate complex linkages, while imaging polarized FTIR examines polymer spatial orientation in cell walls [54].
Ethanol yield and productivity calculations employ standard fermentation metrics: ethanol titer (g L⁻¹) representing final concentration, yield (g ethanol per g sugar) indicating conversion efficiency, and productivity (g L⁻¹ h⁻¹) measuring production rate [58]. Lipid recovery from transgenic oilcane lines involves solvent extraction followed by total fatty acid quantification through transmethylation and GC analysis [58].
Comparative Data Analysis and Technical Evaluation
Performance Across Biomass Varieties and Genetic Modifications
Biomass composition varies significantly across species, influencing pretreatment effectiveness. Grasses with glucuronoarabinoxylan ester linkages typically respond favorably to ammonia pretreatment, while hardwoods and softwoods require tailored approaches [57]. For instance, corn stover with higher glucuronoarabinoxylan content exhibits superior sugar conversion after ammonia pretreatment compared to miscanthus [57]. Natural genetic variations also impact deconstruction efficiency; bamboo variants with lower lignin content (15.3% vs. 21.0%) demonstrated significantly enhanced enzymatic digestibility due to reduced lignin protection and altered cellulose microfibril orientation [54].
Transgenic approaches manipulating lignin biosynthesis pathways create feedstocks with reduced recalcitrance. Downregulated lignin biosynthesis in poplar resulted in thinner cell walls and enhanced saccharification efficiency [54]. Oilcane lines engineered to accumulate lipids in vegetative tissue present dual-product opportunities, though pretreatment selection critically influences both lipid recovery and carbohydrate conversion [58]. These genetic modifications demonstrate the potential for developing tailor-made plants amenable to gentler, more economical pretreatment processes.
Techno-economic and Environmental Considerations
Pretreatment selection significantly impacts biorefinery economics and sustainability. Conventional methods often achieve effective deconstruction but face limitations in inhibitor formation, energy demand, and industrial scalability [53]. Ammonia-based processes offer advantages through catalyst recovery and reuse, minimizing chemical waste and environmental impact [57]. Hydrothermal pretreatment eliminates chemical inputs but may generate inhibitors that require additional detoxification steps [58].
Integrated biorefineries that co-produce biofuels, animal feed, and biomaterials from waste biomass enhance economic viability while supporting circular economy principles [57]. Combined pretreatment strategies can reduce energy consumption and chemical use compared to single methods, improving both economic and environmental metrics [56]. Techno-economic analysis (TEA) reveals pretreatment as typically the largest expense in bioconversion processes, emphasizing the importance of optimizing this step for commercial feasibility [53].
Life cycle assessment of pretreatment technologies must account for embedded energy, chemical consumption, waste treatment requirements, and potential for inhibitor generation that impacts downstream efficiency. Biological and hybrid approaches generally offer superior environmental profiles but may require longer processing times, creating trade-offs between operational and environmental objectives [56].
The comprehensive analysis of advanced pretreatment technologies reveals a rapidly evolving landscape where method selection must align with feedstock characteristics, conversion pathways, and target products. Soaking in aqueous ammonia emerges as a leading candidate for biochemical conversion, demonstrating superior sugar yields (253.73 g/L) and ethanol titers (100.62 g/L) in comparative studies [58]. Hydrothermal methods offer advantages for thermochemical pathways and lipid recovery, while ionic liquids provide excellent fractionation with concerns about cost and toxicity [58]. The fundamental divergence between biochemical and thermochemical pathways dictates different pretreatment priorities: biochemical routes require preservation of carbohydrate integrity for fermentation, while thermochemical processes focus on overall energy density and handling characteristics.
Future advancements will likely focus on hybrid approaches that combine the strengths of multiple pretreatment methods while minimizing their individual limitations [56]. The integration of machine learning and artificial intelligence will enable predictive optimization of pretreatment conditions for specific biomass varieties [53] [55]. Genetic engineering of feedstocks with reduced recalcitrance will allow milder, more economical pretreatment strategies [54]. Sustainable solvent systems with closed-loop recycling, particularly advanced ionic liquids and deep eutectic solvents, represent another promising direction [53]. As biorefineries evolve toward multi-product systems, pretreatment technologies must adapt to fractionate biomass into well-defined streams for conversion to fuels, chemicals, and materials, maximizing both economic and environmental benefits [57].
Catalyst Deactivation and Optimization Strategies for Thermochemical Processes
Catalyst deactivation presents a fundamental challenge in industrial heterogeneous catalysis, compromising performance, efficiency, and sustainability across numerous processes [59]. Within the context of biomass conversion, both thermochemical and biochemical pathways offer distinct approaches for biofuel production, each with specific catalytic requirements and deactivation profiles. Thermochemical conversion utilizes heat and chemical catalysts to decompose biomass through processes like gasification, pyrolysis, and hydrothermal liquefaction, operating at elevated temperatures and pressures [60] [1]. In contrast, biochemical conversion employs biological agents like enzymes and microorganisms to break down plant matter under milder conditions [1]. This guide focuses specifically on catalyst performance within thermochemical processes, examining deactivation mechanisms and optimization strategies critical for maintaining operational efficiency and economic viability in biomass-to-fuel applications.
Catalyst Deactivation Mechanisms
Catalyst deactivation in thermochemical processes occurs through multiple pathways, often operating simultaneously. Understanding these mechanisms is essential for developing effective mitigation strategies.
Table 1: Primary Catalyst Deactivation Mechanisms in Thermochemical Processes
| Deactivation Mechanism | Description | Common in Processes | Effect on Catalyst |
|---|---|---|---|
| Coking/Carbon Deposition | Formation and deposition of carbonaceous materials blocking active sites and pores | Gasification, Pyrolysis, Reforming [59] [60] | Site blocking, pore blockage, increased pressure drop |
| Poisoning | Strong chemisorption of species on active sites rendering them inactive | Various processes with impurity-containing feedstocks [59] | Permanent or temporary site deactivation |
| Thermal Degradation/Sintering | Loss of active surface area due to crystal growth or support collapse at high temperatures | High-temperature processes (>500°C) [59] | Reduced active surface area, structural deterioration |
| Mechanical Damage | Physical breakdown of catalyst particles | Fluidized bed reactors, continuous processes [59] | Particle attrition, bed plugging, material loss |
Coke formation represents a particularly prevalent deactivation pathway in industrial processes involving organic compounds and heterogeneous catalysts [59]. Theoretically, coke affects catalyst performance through two primary mechanisms: active site poisoning through overcoating of active sites, and pore clogging that makes active sites inaccessible to reactants [59]. The specific nature of coke formed depends on both the catalyst characteristics and reaction parameters, necessitating tailored regeneration approaches for different catalytic processes [59].
Comparative Analysis of Catalyst Performance Across Thermochemical Processes
Catalyst behavior varies significantly across different thermochemical conversion platforms, with each process exhibiting distinct deactivation profiles and operational challenges.
Table 2: Catalyst Performance and Deactivation Across Thermochemical Conversion Processes
| Process | Typical Conditions | Primary Catalysts | Key Deactivation Mechanisms | Typical Catalyst Lifespan |
|---|---|---|---|---|
| Gasification | 700-900°C (fluidized bed), 1000-1400°C (entrained bed) [60] | Ni-based, AAEM (alkali and alkaline earth metals) [60] | Coking, sulfur poisoning, ash deposition, attrition [60] | Varies with feedstock and operating conditions |
| Pyrolysis | 400-700°C, absence of oxidizers [60] | Zeolites, AAEM, Ni-based [60] | Coking, pore blockage [59] | Moderate to rapid deactivation possible |
| Hydrothermal Liquefaction | Moderate temperature, high pressure [60] | Heterogeneous acid/base catalysts | Coke formation, structural deterioration [59] | Limited data available |
| Methane Dry Reforming | 700-900°C (conventional) [61] | Ni-based, noble metals [61] [62] | Coking, thermal sintering [61] | Conventional: rapid deactivation; Solar: >800 hours demonstrated [61] |
| CO₂ Methanation | 200-550°C, 1-100 bar [62] | Ni, Ru, Rh, Co [62] | Coking, sintering, oxidation, poisoning [62] | Varies with operating conditions and catalyst formulation |
Recent advances in catalytic systems have demonstrated remarkable improvements in durability. For instance, in methane dry reforming—a process historically hindered by coke formation and catalyst deactivation—novel approaches using concentrated solar energy with well-designed catalysts featuring Ni-O₄ coordination active centers have achieved operational stability for over 800 hours while maintaining high conversion rates of approximately 93.6% for CH₄ and 93.7% for CO₂ [61].
Experimental Protocols for Catalyst Deactivation and Regeneration Studies
Standardized experimental methodologies are essential for meaningful comparison of catalyst performance and deactivation resistance across different studies and research groups.
Light-Off Performance Testing
The light-off performance evaluation determines the temperature at which a catalyst becomes active, which is particularly important for processes with fluctuating feedstock supply or frequent start-up/shut-down cycles [63]. The experimental protocol involves:
- Reactor Setup: Fixed-bed reactor system with precise temperature control and gas composition monitoring
- Temperature Ramping: Gradual temperature increase from low to high range (e.g., 260-430°C for ammonia synthesis catalysts) while maintaining constant gas hourly space velocity (GHSV)
- Product Analysis: Continuous monitoring of product formation (e.g., ammonia concentration in volppm for synthesis catalysts)
- Data Analysis: Calculation of rate constant k from measured product concentration, plotting natural logarithm of k (ln(k)) against reciprocal temperature (1000/K)
- Light-Off Value Determination: Extrapolation to identify temperature at which specific product concentration is achieved (e.g., 50 ppm ammonia) [63]
Coke Formation and Analysis Protocol
Standardized methodology for quantifying and characterizing coke deposits:
- Accelerated Coking: Subject catalyst to coking conditions using model compounds or actual process feedstocks
- Thermogravimetric Analysis (TGA): Measure weight loss during controlled temperature oxidation to quantify coke content
- Temperature-Programmed Oxidation (TPO): Characterize coke reactivity and type by monitoring CO/CO₂ evolution during temperature ramping in oxygen-containing atmosphere
- Post-Reaction Characterization: Employ techniques such as X-ray diffraction (XRD), scanning electron microscopy (SEM), and X-ray photoelectron spectroscopy (XPS) to examine structural changes [60]
Regeneration Efficiency Testing
Protocol for evaluating catalyst regeneration methods:
- Initial Activity Measurement: Establish baseline catalytic performance under standard conditions
- Controlled Deactivation: Subject catalyst to defined deactivation conditions (time, temperature, feedstock)
- Regeneration Treatment: Apply specific regeneration method (oxidation, gasification, hydrogenation, etc.) under controlled parameters
- Activity Recovery Assessment: Measure catalytic performance post-regeneration and calculate percentage activity recovery relative to fresh catalyst
- Multiple Cycle Testing: Repeat deactivation-regeneration cycles to assess long-term regenerability [59]
Catalyst Regeneration Strategies and Optimization
Regeneration of deactivated catalysts to restore their activity is both practically and economically valuable, as catalyst deactivation represents a constant challenge in industrial catalytic processes [59].
Diagram 1: Catalyst regeneration decision framework illustrates pathway selection based on deactivation mechanism.
Conventional Regeneration Methods
Traditional regeneration approaches include:
- Oxidation Treatments: Coke elimination using oxygen, air, or ozone [59]. Air combustion effectively removes carbon deposits but presents challenges due to exothermic nature causing hot spots and localized temperature gradients that can damage catalyst structure [59]. Ozone treatment enables lower-temperature regeneration (e.g., for coked ZSM-5 catalysts) [59].
- Gasification: Utilizing CO₂ or steam to gasify carbon deposits, though this requires careful temperature control to prevent catalyst damage [59].
- Hydrogenation: Hydrogen treatment can remove carbonaceous deposits and reduce oxidized catalytic species [59].
- Thermal Conditioning: Elevated temperature treatments can reactivate certain catalysts, as demonstrated in hydrogen internal combustion engine oxidation catalysts where higher temperature conditioning effectively prevented significant deactivation [64].
Emerging Regeneration Technologies
Advanced regeneration methods offer improved efficiency and reduced catalyst damage:
- Supercritical Fluid Extraction (SFE): Utilizing supercritical fluids (typically CO₂) to extract contaminants and coke precursors from catalyst pores [59].
- Microwave-Assisted Regeneration (MAR): Applying microwave energy for selective heating and more controlled coke removal [59].
- Plasma-Assisted Regeneration (PAR): Using non-thermal plasma for low-temperature decomposition of coke deposits [59].
- Atomic Layer Deposition (ALD): Precise deposition of protective layers or regeneration of active sites at atomic scale [59].
The Researcher's Toolkit: Essential Reagents and Materials
Table 3: Essential Research Reagents and Materials for Catalyst Deactivation Studies
| Reagent/Material | Function/Application | Example Specifications | Key Considerations |
|---|---|---|---|
| Standard Catalyst Materials | Benchmarking and comparative studies | EuroPt-1, EUROCAT standards, Zeolyst materials [65] | Well-characterized, commercially available reference materials |
| Ni-based Catalysts | Methanation, reforming, gasification studies | Various supports (SiO₂, Al₂O₃, MgO) [62] | Cost-effective, widely applicable, susceptible to coking |
| Noble Metal Catalysts | High-performance applications | Ru, Rh, Pt-based systems [61] [62] | Higher cost, often enhanced activity and stability |
| Zeolite Materials | Acid-catalyzed reactions, shape-selective catalysis | ZSM-5, FAU framework materials [59] [65] | Framework stability, acidity, pore structure |
| Characterization Reagents | Catalyst surface and structural analysis | TPO/TGA gases, titration chemicals, spectroscopy standards | Purity, compatibility with analytical instruments |
| Regeneration Agents | Catalyst reactivation studies | High-purity O₂, H₂, CO₂, ozone generators [59] | Controlled composition, safety considerations |
The development of standardized catalyst databases like CatTestHub provides researchers with benchmarked materials and reaction data, enabling more reproducible and comparable experimental results across different research groups [65]. This represents an important advancement in catalysis research methodology, facilitating more reliable assessment of deactivation resistance and regeneration efficiency.
Catalyst deactivation remains an inevitable challenge in thermochemical biomass conversion processes, directly impacting operational efficiency, economic viability, and environmental sustainability. Through systematic understanding of deactivation mechanisms—particularly coking, poisoning, and thermal degradation—researchers can develop targeted optimization strategies. The integration of advanced regeneration technologies alongside improved catalyst design offers promising pathways to enhanced catalyst longevity. As thermochemical processes continue to evolve toward greater integration with renewable energy systems, catalyst development must address not only traditional steady-state operation but also dynamic conditions with fluctuating feedstock supply and frequent start-up/shut-down cycles. Future research directions should emphasize the development of robust, regenerable catalytic systems capable of maintaining performance under the variable operating conditions characteristic of renewable-energy-integrated processes.
Microbial Inhibition and Fermentation Efficiency Challenges in Biochemical Systems
The pursuit of sustainable bio-based processes has brought two primary conversion pathways to the forefront: biochemical and thermochemical. While thermochemical pathways utilize high temperatures to decompose biomass into fuels and chemicals, biochemical conversion relies on the intricate activity of microorganisms and enzymes to transform organic matter into desired products such as ethanol, lactic acid, and biogas [1] [13]. This biological approach operates at low temperatures and pressures, offering potential advantages in energy efficiency and product specificity [1]. However, the very foundation of biochemical conversion—its dependence on living systems—also presents its most significant challenges: microbial inhibition and fermentation efficiency limitations.
Within the context of competing conversion technologies, understanding these biochemical challenges becomes paramount. Thermochemical pathways, including pyrolysis and gasification, yield higher energy output (0.1–15.8 MJ/kg biomass) but incur greater greenhouse gas emissions (0.003–1.2 kg CO₂/MJ) and costs (0.01–0.1 USD/MJ) compared to biochemical pathways [35]. Biochemical systems, though potentially more environmentally favorable, face fundamental biological constraints that impact their economic viability and scalability. The efficiency of these systems is frequently compromised by various inhibition mechanisms that disrupt microbial metabolism, leading to reduced growth rates, incomplete substrate utilization, and diminished product yields [66]. Addressing these challenges requires a deep understanding of inhibition sources, their impacts on microbial physiology, and the development of effective mitigation strategies to make biochemical conversion competitive with thermochemical alternatives.
Microbial inhibition in biochemical systems arises from multiple sources, each presenting distinct challenges to process efficiency. These inhibitory factors can be broadly categorized into substrate-related inhibition, product toxicity, and inhibitors generated during feedstock pretreatment. Understanding these categories is essential for developing effective countermeasures.
Substrate Inhibition occurs when high concentrations of the carbon source itself become toxic to microbial cells. In lactic acid fermentation, high initial sugar concentration has been demonstrated to inhibit strain growth, creating a paradoxical situation where increasing substrate availability beyond an optimal threshold actually decreases process efficiency [66]. This phenomenon is particularly problematic in high-solid fermentations aimed at maximizing product titers.
End-Product Toxicity represents another fundamental challenge. In lactic acid production, the accumulation of lactic acid during later fermentation stages exerts toxic effects on microbial cells [66]. This product inhibition creates a self-limiting process where increasing product concentration progressively slows down and eventually halts the fermentation. Similar challenges exist in ethanol fermentation, where alcohol accumulation compromises microbial membrane integrity and metabolic function.
Inhibitory Compounds from Pretreatment particularly affect processes using lignocellulosic biomass. When agricultural by-products such as straw, rice husk, or bran are used as feedstocks, pretreatment processes often release compounds that inhibit microbial activity [66]. These inhibitors include furan derivatives (furfural and 5-hydroxymethylfurfural), weak acids (acetic, formic, and levulinic acids), and phenolic compounds. The sensitivity of strains to these inhibitory compounds released during pretreatment represents a major obstacle in industrial production [66]. The presence of these compounds disrupts cellular functions, impairs membrane integrity, and inhibits enzymatic activity, leading to prolonged lag phases, reduced growth rates, and decreased product formation.
Table 1: Major Categories of Microbial Inhibitors in Biochemical Conversion Systems
| Inhibitor Category | Specific Examples | Primary Sources | Impact on Microbial Cells |
|---|---|---|---|
| Substrate Inhibition | High sugar concentration | Feedstock formulation | Inhibits growth; reduces metabolic activity |
| End-Product Toxicity | Lactic acid, ethanol, butanol | Accumulation during fermentation | Disrupts membrane integrity; inhibits metabolism |
| Pretreatment-Derived Inhibitors | Furfurals, HMF, phenolic compounds, weak acids | Lignocellulosic biomass pretreatment | Damages cell membranes; inhibits enzymes; extends lag phase |
| By-Product Formation | Mixed acids; diols; changes in optical purity | Shifts in cultural environment and conditions | Reduces product purity and value; consumes carbon inefficiently |
Quantitative Analysis of Inhibition Effects on Fermentation Efficiency
The impact of microbial inhibition on fermentation efficiency can be quantified through key performance indicators including product concentration, yield, and productivity. These metrics provide a comprehensive view of how inhibition constraints manifest in real fermentation systems and highlight the performance gaps that must be addressed.
Research on lactic acid fermentation reveals significant variations in performance across different feedstocks and microbial strains. For instance, when using food waste as a substrate, Lactobacillus manihotivorans DSM 13343 achieved a lactic acid concentration of 18.69 g/L with a yield of 0.73 g/g, while Lactobacillus plantarum DSM 20174 under similar conditions produced 17.03 g/L with a yield of 0.69 g/g [66]. In more optimized systems using beechwood feedstock, Lactobacillus delbrueckii subsp. bulgaricus reached significantly higher concentrations of 62.00 g/L with a yield of 0.69 g/g through simultaneous saccharification and fermentation [66]. These disparities highlight how inhibition effects are strain-dependent and influenced by process configuration.
The inhibitory effect of substrate concentration is clearly demonstrated in fermentation systems using complex feedstocks. For example, microbial consortium CEE-DL15 utilizing sugarcane molasses achieved 112.34 g/L lactic acid from 350 g/L molasses after 25 hours of batch fermentation, with a maximum productivity of 4.49 g/(L·h) [66]. This represents a yield of approximately 0.32 g/g, significantly lower than the theoretical maximum, indicating substantial inhibition effects at high substrate loading. Similarly, in orange peel waste fermentation using Lactobacillus delbrueckii ssp. bulgaricus CECT 5037, a lactic acid concentration of 39.00 g/L was achieved, though the yield was not reported [66].
The temporal progression of inhibition is another critical factor affecting efficiency. In lactic acid fermentations, the accumulation of LA in the late stage of fermentation has a toxic effect on microbial cells [66]. This end-product inhibition creates a negative feedback loop where increasing product concentration progressively slows metabolic activity, ultimately limiting the maximum achievable product titer. This phenomenon is particularly pronounced in high-productivity systems where rapid metabolite accumulation occurs.
Table 2: Fermentation Performance Metrics Across Different Feedstocks and Conditions
| Feedstock | Microbial Strain | LA Concentration (g/L) | Yield (g/g) | Productivity (g/(L·h)) | Key Challenges |
|---|---|---|---|---|---|
| Food waste | L. manihotivorans DSM 13343 | 18.69 | 0.73 | - | Substrate complexity; by-product formation |
| Beechwood | L. delbrueckii subsp. bulgaricus | 62.00 | 0.69 | 0.86 | End-product inhibition |
| Sugarcane molasses | Microbial consortium CEE-DL15 | 112.34 | 0.32 | 4.49 | High substrate inhibition |
| Cheese whey | Pediococcus acidilactici KTU05-7 | 47.0–51.2 | - | - | Lactose utilization; need for neutralizer |
| Household food waste | Lactobacillus rhamnosus ATCC 7469 | 30.25 | - | - | Inconsistent composition; microbial contamination |
Experimental Protocols for Studying Microbial Inhibition
Protocol for Assessing Inhibitor Tolerance in Microbial Strains
Objective: To quantitatively evaluate the tolerance of lactic acid bacterial strains to inhibitors commonly found in lignocellulosic hydrolysates.
Materials and Reagents:
- Test Microorganisms: Lactic acid bacteria strains (e.g., Lactobacillus spp., Bacillus coagulans)
- Growth Medium: MRS broth or defined fermentation medium
- Inhibitor Stock Solutions: Furfural (5 g/L), 5-HMF (5 g/L), acetic acid (10 g/L), vanillin (1 g/L), syringaldehyde (1 g/L) prepared in appropriate solvents
- Analytical Equipment: Spectrophotometer for optical density measurement, HPLC system for product analysis, pH meter
- Culture Vessels: Erlenmeyer flasks or anaerobic tubes with working volume of 50-100 mL
Methodology:
- Prepare baseline medium without inhibitors and experimental media with inhibitor concentrations representative of lignocellulosic hydrolysates (e.g., furfural 1-2 g/L, HMF 1-3 g/L, acetic acid 2-5 g/L, phenolics 0.1-0.5 g/L).
- Inoculate each medium with exponentially growing preculture at 1-5% (v/v) inoculation rate.
- Incubate under optimal conditions (temperature, pH, anaerobic) with continuous monitoring.
- Sample at regular intervals (0, 2, 4, 6, 8, 12, 24 h) for analysis.
- Measure optical density (600 nm) to track growth, substrate consumption via HPLC, and product formation.
- Calculate key parameters: maximum specific growth rate (μmax), lag phase duration, biomass yield, and product yield.
Data Analysis:
- Compare growth curves and kinetic parameters between baseline and inhibitor-supplemented cultures
- Determine inhibitor concentration that reduces μmax by 50% (IC50 value)
- Assess correlation between inhibitor concentration and extended lag phase
- Evaluate impact on product yield and selectivity
This protocol enables systematic screening of strain tolerance and identification of inhibition thresholds that impact fermentation performance [66].
Protocol for Fed-Batch Fermentation with Inhibitor Mitigation
Objective: To implement and validate fed-batch strategies for minimizing substrate and product inhibition in high-productivity lactic acid fermentation.
Materials and Reagents:
- Bioreactor System: Fermenter with pH, temperature, and dissolved oxygen control
- Feedstock Solution: High-concentration sugar solution (e.g., glucose, xylose, or hydrolysate)
- Neutralizing Agent: CaCO₃, NaOH, or NH₄OH for pH control
- Analytical Instruments: HPLC with refractive index or UV detector for substrate and product quantification
Methodology:
- Establish batch phase with initial substrate concentration below inhibition threshold (typically 50-80 g/L).
- Monitor substrate concentration in real-time or at frequent intervals.
- Initiate feeding when substrate concentration decreases to 10-20 g/L.
- Implement feeding strategy based on:
- Constant feeding rate
- Exponential feeding matching microbial growth
- Feedback control based on substrate concentration or metabolic activity
- Maintain pH at optimal level through automatic addition of neutralizing agent.
- Consider intermittent product removal through in-situ separation techniques.
- Continue fermentation until working volume limits or significant decline in productivity.
Data Analysis:
- Compare maximum achievable product titer with batch fermentation
- Calculate overall productivity and yield
- Assess feeding strategy impact on microbial physiology and by-product formation
- Evaluate economic feasibility based on final product concentration and purification costs [66]
Visualization of Inhibition Mechanisms and Experimental Approaches
The following diagrams illustrate key inhibition mechanisms in biochemical systems and experimental approaches for their investigation.
Microbial Inhibition Mechanisms in Biochemical Systems
Experimental Workflow for Inhibition Studies
The Scientist's Toolkit: Essential Research Reagents and Solutions
Addressing microbial inhibition requires specialized reagents, tools, and methodologies. The following table catalogues essential solutions for research in this field.
Table 3: Research Reagent Solutions for Studying Microbial Inhibition
| Reagent/Category | Specific Examples | Function/Application | Experimental Considerations |
|---|---|---|---|
| Model Inhibitors | Furfural, HMF, acetic acid, vanillin, syringaldehyde, phenolic compounds | Simulating lignocellulosic hydrolysate composition; dose-response studies | Prepare fresh stock solutions; determine solubility in aqueous systems; use appropriate controls |
| Specialized Growth Media | MRS broth, defined mineral media, hydrolysate-mimicking media | Cultivation under controlled conditions; isolation of specific inhibition effects | Consider nutrient composition effects on inhibitor tolerance; adjust based on microbial requirements |
| Analytical Standards | Organic acids (lactic, acetic), alcohols (ethanol, butanol), inhibitors (furfurals, phenolics) | HPLC/UPLC calibration; accurate quantification of metabolites and inhibitors | Establish validated calibration curves; include internal standards for complex matrices |
| Neutralizing Agents | CaCO₃, NaOH, NH₄OH, Mg(OH)₂ | pH control during fermentation; mitigating end-product inhibition | Consider solubility and precipitation effects; evaluate impact on downstream processing |
| Rescue Metabolites | Yeast extract, amino acids, vitamins, reducing agents (cysteine) | Reversing inhibitor effects; restoring metabolic activity | Evaluate cost-effectiveness for scale-up; assess impact on product purity |
| Enzyme Preparations | Cellulases, hemicellulases, laccases, peroxidase | Hydrolysis of polymeric feedstocks; detoxification of inhibitors | Optimize loading and conditions; assess enzyme-inhibitor interactions |
| Biosensors & Probes | pH sensors, dissolved oxygen probes, fluorescent viability stains | Real-time process monitoring; cell viability assessment | Calibrate regularly; validate against reference methods |
Comparative Analysis: Biochemical vs. Thermochemical Pathways
When evaluating biochemical conversion within the broader context of biomass valorization, a comparative analysis with thermochemical pathways reveals distinct advantages and challenges for each approach. Thermochemical methods, including pyrolysis, gasification, and combustion, operate at very high temperatures and pressures to decompose biomass into fuels and value-added products [1] [67]. These processes typically yield higher energy output (0.1–15.8 MJ/kg) but incur greater greenhouse gas emissions (0.003–1.2 kg CO₂/MJ) and costs (0.01–0.1 USD/MJ) compared to biochemical pathways [35].
Biochemical conversion, while suffering from microbial inhibition challenges, offers several comparative advantages. It operates at low temperatures and pressures, reducing energy input requirements [1]. The biological catalysts (enzymes and microorganisms) provide high specificity, often resulting in fewer by-products and simpler purification processes. However, the longer processing times and sensitivity to feedstock impurities represent significant drawbacks relative to thermochemical approaches [13].
The feedstock flexibility also differs substantially between these pathways. Thermochemical processes can handle a wider variety of feedstocks, including those with high lignin content that are unsuitable for biochemical conversion [5] [13]. Biochemical processes typically require more specific, biodegradable feedstocks with minimal inhibitory compounds, though research on microbial consortia and engineered strains is expanding this range [66] [68].
From a sustainability perspective, biochemical pathways generally have lower greenhouse gas emissions and environmental impact, but face challenges in scalability and process stability compared to established thermochemical technologies [35] [13]. The integration of both approaches in hybrid biorefineries may offer the most promising path forward, leveraging the strengths of each technology while mitigating their respective limitations.
Emerging Solutions and Future Research Directions
Addressing microbial inhibition and efficiency challenges requires innovative approaches spanning multiple disciplines. Emerging solutions focus on strain development, process engineering, and advanced monitoring technologies to overcome fundamental limitations in biochemical conversion systems.
Advanced Strain Development through systems and synthetic biology represents a powerful approach for enhancing inhibitor tolerance. Engineering microbes with improved resistance to inhibitors and enhanced product yield is a key research direction [68]. This includes engineering microbes for enhanced biosecurity, carbon efficiencies, and fuels and chemical production [68]. The development of robust microbial chassis with expanded substrate utilization capabilities and heightened tolerance to inhibitors and products is essential for expanding the range of viable feedstocks.
Process Intensification Strategies including fed-batch fermentation, cell recycle systems, and in-situ product recovery have demonstrated potential for mitigating inhibition effects. In lactic acid production, fed-batch fermentation with L. rhamnosus ATCC 7469 using brewer's spent grain and malt rootlets achieved 58.01 g/L lactic acid with a productivity of 1.19 g/(L·h), significantly higher than batch operations [66]. These approaches maintain inhibitor and product concentrations below critical thresholds, enabling higher cell densities and extended production phases.
Smart Fermentation Technologies integrating biosensors, Internet of Things (IoT), artificial intelligence (AI), and machine learning (ML) enable real-time microbial monitoring and process control [69]. These systems allow dynamic optimization of fermentation parameters in response to changing microbial physiology, potentially preventing inhibition before it significantly impacts productivity. The implementation of smart technologies is particularly valuable for traditional fermentation processes that suffer from microbial variability and inconsistent product quality [69].
Feedstock Preprocessing and Formulation strategies aim to reduce inhibitor concentrations before fermentation. Physical, chemical, and biological pretreatment methods can selectively remove or degrade inhibitory compounds while preserving fermentable sugars [66] [13]. The development of tailored pretreatment protocols for specific feedstock-microbe combinations represents an important research direction for improving fermentation efficiency.
Future research should prioritize integrated approaches that combine biological, process, and technological innovations to develop robust, efficient biochemical conversion systems capable of competing with thermochemical alternatives in the evolving bioeconomy.
Energy Integration and Reactor Design for Improved Process Economics
The transition from fossil-based resources to sustainable energy systems necessitates the efficient conversion of lignocellulosic biomass into biofuels and bio-chemicals. Two dominant technological pathways for this conversion are the biochemical and thermochemical processes [18] [70]. While both pathways aim to valorize biomass, their fundamental principles, operational demands, and resulting products differ significantly. The economic viability of biorefineries is heavily influenced by the efficiency of energy integration and the design of the core reactor systems [21] [71]. This guide provides a comparative analysis of biochemical and thermochemical conversion pathways, with a focused examination of their energy integration strategies and reactor design economics, to inform researchers and industry professionals in their technology selection and development efforts.
Fundamental Pathway Comparison: Biochemical vs. Thermochemical Conversion
The core distinction between the two pathways lies in their conversion mechanism. Biochemical conversion employs biological agents like enzymes and microorganisms to break down biomass into simple sugars, which are subsequently fermented into fuels such as ethanol [1] [13]. This process operates at relatively low temperatures and pressures. In contrast, thermochemical conversion utilizes heat and chemical catalysts to decompose biomass at high temperatures, producing intermediate energy carriers like syngas (via gasification) or bio-oil (via pyrolysis), which can be further upgraded into liquid fuels [1] [41].
The composition of lignocellulosic biomass—primarily cellulose, hemicellulose, and lignin—dictates its suitability for each pathway. Biochemical processes are highly effective at converting cellulose and hemicellulose but struggle with lignin, which remains largely unconverted [18]. Thermochemical processes, however, can convert all components, including lignin, making them more robust to feedstock variation [41]. The following diagram illustrates the logical relationship and primary products of these two pathways.
Comparative Performance Data
A direct comparison of key performance metrics is essential for evaluating the economic potential of each pathway. The data below, synthesized from process simulation models and life cycle assessment studies, summarizes the conversion efficiencies, representative yields, and environmental impacts for the production of ethanol from lignocellulosic biomass [19] [20].
Table 1: Comparative performance metrics for biochemical and thermochemical ethanol production
| Performance Metric | Biochemical Conversion | Thermochemical Conversion |
|---|---|---|
| Primary Product | Ethanol | Mixed Alcohols (incl. Ethanol) |
| Theoretical Ethanol Yield (Mg/dry Mg biomass) | ~0.24 - 0.30 [19] | ~0.22 - 0.28 [19] |
| Energy Efficiency (Plant Level) | ~70-80% (projected) [20] | Similar to Biochemical [20] |
| Process Conditions | Low Temp (30-60°C), Low Pressure [1] | High Temp (Pyrolysis: 450-600°C; Gasification: >700°C) [13] [71] |
| Conversion Time | Long (days for fermentation) [13] [21] | Very Short (seconds to minutes) [18] |
| Feedstock Flexibility | Lower (sensitive to lignin/ash content) [19] [41] | Higher (tolerates varied feedstocks, including those high in lignin) [19] |
| GHG Emissions (g CO₂-eq/MJ fuel) | Lower (with co-product credit) [20] | Slightly Higher, but can be lower in biorefinery mode [20] |
| Fossil Fuel Consumption (MJ/MJ fuel) | Lower [20] | Slightly Higher [20] |
| Water Consumption (L/MJ fuel) | Higher (direct and indirect) [20] | Significantly Lower (direct, indirect, life cycle) [20] |
Financial analyses, such as those comparing National Renewable Energy Lab (NREL) process models, indicate that thermochemical conversion can produce biofuels with a lower Tool for the Reduction and Assessment of Chemical and Other Environmental Impacts (TRACI) single score and somewhat lower greenhouse gas (GHG) emissions per megajoule (MJ) of fuel [19]. However, biochemical conversion paired with optimal feedstocks like sweet sorghum can achieve the highest financial performance and lowest environmental impacts for that pathway [19].
Experimental Protocols for Pathway Evaluation
Protocol for Biochemical Conversion Assessment
This protocol outlines the standard method for evaluating sugar release from lignocellulosic biomass via enzymatic hydrolysis, a key determinant of ethanol yield [19] [72].
- Feedstock Preparation: Biomass is first ground to pass a 2.0 mm screen using a Wiley knife mill, following standard laboratory methods [72].
- Dilute-Acid Pretreatment: The biomass is subjected to a pretreatment with dilute acid (e.g., sulfuric acid) at elevated temperatures (e.g., 160-180°C) to solubilize hemicellulose and disrupt the lignin structure, making cellulose more accessible [19].
- Compositional Analysis: The pretreated solid fraction is analyzed for glucan, xylan, and acid-insoluble lignin content according to Laboratory Analytical Procedures (LAP) from NREL. This involves a two-stage acid hydrolysis to quantify carbohydrates and gravimetric analysis for lignin [72].
- Enzymatic Hydrolysis: The pretreated biomass is subjected to enzymatic saccharification using commercial cellulase enzyme cocktails. This is typically performed in a buffered solution at 50°C and pH ~4.8-5.0 with constant agitation for a period of 3-7 days [72].
- Sugar Quantification: Samples are taken at intervals during hydrolysis. The liquid hydrolysate is analyzed for glucose and xylose concentration using High-Performance Liquid Chromatography (HPLC) equipped with a Bio-Rad Aminex HPX-87P column [72].
- Data Analysis: The sugar yield is calculated as the percentage of the theoretical maximum sugar available in the pretreated biomass that was released during hydrolysis. A yield of ~70% is considered indicative of a feedstock well-suited for biochemical conversion [72].
Protocol for Thermochemical Conversion Assessment
This protocol describes the methodology for fast pyrolysis, a prominent thermochemical process, to produce bio-oil, with yield and quality as the primary evaluation metrics [72].
- Feedstock Preparation: Biomass is finely ground to pass a 200 μm sieve to ensure rapid and uniform heat transfer [72].
- Pyrolysis Reactor Setup: A fast pyrolysis reactor, such as a fluidized bed or a microwave-enhanced system, is prepared. The system is purged with an inert gas (e.g., nitrogen) to maintain an oxygen-free environment [72].
- Pyrolysis Experiment: The ground biomass feedstock is fed into the pre-heated reactor. For fast pyrolysis, the reactor temperature is maintained between 450-600°C with a very short vapor residence time of less than 2 seconds [13] [71].
- Product Collection and Separation: The produced vapors are rapidly quenched and condensed to obtain liquid bio-oil. The non-condensable gases and solid biochar are also collected and quantified separately [72].
- Product Analysis:
- Bio-oil Yield: The mass of condensed bio-oil is measured and reported as a weight percent of the dry biomass feed.
- Bio-oil Quality: The bio-oil is analyzed for properties such as water content, viscosity, and acidity (Total Acid Number - TAN). For instance, pyrolysis of biochemical residue can yield an oil with a ~60% reduced TAN compared to whole biomass pyrolysis, indicating higher quality [72].
- Elemental Analysis: The bio-oil and biochar can undergo ultimate analysis (C, H, O, N content) to determine their elemental composition and Higher Heating Value (HHV) [41].
Reactor Design and Energy Integration Strategies
Reactor design is a critical cost driver in both pathways, but the challenges differ. Biochemical processes rely on large-volume, agitated reactors for hydrolysis and fermentation, which require sterilization and precise control of temperature and pH [13]. Thermochemical processes, such as gasifiers and pyrolyzers, require advanced materials to withstand high temperatures and corrosion, significantly increasing capital costs [18] [71].
Energy integration is pivotal for improving process economics. Biochemical facilities often burn the lignin-rich residue to generate steam and electricity, making the plant energy-self-sufficient [19]. In thermochemical plants, waste heat from exothermic synthesis steps or product combustion can be recovered and used to drive the primary endothermic reactions (e.g., gasification) or for feedstock pre-drying, a major energy sink [71]. A promising hybrid strategy involves using the lignin-rich residue from biochemical conversion as a feedstock for thermochemical processes like fast pyrolysis. This approach can improve overall yields of fermentable sugars and bio-oil above 80%, compared to about 60% when using a single conversion strategy [72]. The following workflow visualizes this integrated biorefinery concept.
The Scientist's Toolkit: Essential Research Reagents and Materials
Successful research and development in biomass conversion rely on a suite of specialized reagents and materials. The following table details key items used in the experimental protocols cited herein.
Table 2: Key research reagents and materials for conversion pathway studies
| Reagent/Material | Function in Research | Example Application |
|---|---|---|
| Cellulase Enzyme Cocktails | Hydrolyzes cellulose polymer into fermentable glucose sugars. | Enzymatic hydrolysis of pretreated biomass [72]. |
| Sulfuric Acid (H₂SO₄) | Catalyst for dilute-acid pretreatment; hydrolyzes hemicellulose. | Biomass pretreatment to enhance enzymatic digestibility [19] [72]. |
| Molybdenum (Mo) Catalysts | Catalyzes the conversion of syngas into mixed alcohols. | Catalytic synthesis of ethanol and propanol from syngas in thermochemical processes [19]. |
| Lignocellulosic Biomass Feedstocks | Renewable carbon source for conversion processes. | Hybrid poplar, shrub willow, corn stover, switchgrass used in process development [19] [41] [72]. |
| Biochar | Porous carbon solid; soil amendment, catalyst, or additive. | Produced via slow pyrolysis; can be used to enhance methane production in anaerobic digestion systems [13] [71]. |
| Levulinic Acid-based NADES | Green solvent for sustainable pretreatment and delignification. | Pretreatment of sawdust, achieving ~91% delignification [70]. |
Biochemical and thermochemical conversion pathways present distinct trade-offs in terms of technology maturity, operational intensity, and environmental footprint. Biochemical conversion often demonstrates advantages in GHG emissions and fossil fuel consumption, while thermochemical pathways excel in water conservation, feedstock flexibility, and conversion speed [19] [20]. The economic analysis suggests that the choice of optimal pathway is highly dependent on the specific biomass feedstock and local resource constraints, particularly water availability.
The future of economically viable biorefining likely lies in the integration of these two pathways. Hybrid systems, where the residue from biochemical processing is valorized through thermochemical conversion, can maximize resource recovery and overall energy efficiency, pushing yields beyond the limits of standalone processes [72] [71]. Future research should prioritize the optimization of such integrated systems, alongside advancements in feedstock pretreatment, catalyst development, and robust reactor design tailored for hybrid operations, to unlock the full economic potential of lignocellulosic biomass.
Machine Learning and AI Applications for Process Optimization and Prediction
The global transition toward sustainable energy and chemical production has intensified the focus on converting lignocellulosic biomass into valuable biofuels and biochemicals. Two primary technological pathways dominate this landscape: biochemical conversion, which utilizes biological agents like enzymes and microorganisms, and thermochemical conversion, which relies on high-temperature processes [1]. Selecting the optimal pathway is complex, influenced by feedstock composition, desired products, and economic viability. Machine Learning (ML) and Artificial Intelligence (AI) are emerging as transformative tools to navigate this complexity, enabling enhanced prediction, optimization, and comparison of these conversion routes [40] [73]. This guide provides an objective comparison of biochemical and thermochemical pathways, focusing on the integral role of ML and AI in accelerating research and development for scientists and engineers in drug development and bioenergy sectors.
Comparative Analysis of Conversion Pathways
Biochemical and thermochemical conversions represent two distinct philosophies for valorizing biomass. Their core differences, which make them suitable for different applications, are summarized in the table below.
Table 1: Fundamental Comparison of Biochemical and Thermochemical Conversion Pathways
| Aspect | Biochemical Conversion | Thermochemical Conversion |
|---|---|---|
| Core Principle | Uses biological catalysts (enzymes, microorganisms) to break down biomass [1]. | Uses heat and chemical catalysts to decompose biomass [1]. |
| Process Examples | Enzymatic hydrolysis, fermentation, anaerobic digestion [74]. | Pyrolysis, gasification, hydrothermal liquefaction [18]. |
| Typical Operating Conditions | Low temperatures and pressures [1]. | High temperatures and pressures [1]. |
| Primary Products | Bioethanol, biobutanol, biogas [74]. | Bio-oil, syngas, biochar [1] [40]. |
| Reaction Time | Longer processing times (hours to days) [21]. | Very fast reaction times (seconds to minutes) [18]. |
| Key Feedstock Traits | High cellulose/hemicellulose, low lignin content [74]. | Lignin content tolerable; low moisture and ash content desired [41]. |
The following diagram illustrates the logical decision workflow for selecting and optimizing a conversion pathway, integrating the key comparison metrics and the role of machine learning.
Diagram 1: Decision workflow for biomass conversion pathway selection integrated with ML.
Machine Learning Applications in Pathway Optimization
Machine learning algorithms are adept at finding complex, non-linear relationships in multivariate data, making them ideal for modeling and optimizing biomass conversion processes where numerous parameters interact.
ML for Thermochemical Conversion Prediction
In thermochemical conversion, ML models are primarily used to predict product yields and optimize process conditions, reducing the need for costly and time-consuming experiments.
Table 2: Machine Learning Applications in Thermochemical Conversion
| ML Task | Algorithms Used | Input Features | Output Prediction | Reported Performance/Findings |
|---|---|---|---|---|
| Product Yield Prediction [40] | Regression Analysis, Random Forest (RF) | Waste composition (C, H, O content), operating conditions (temperature, heating rate) | Yields of solid, liquid, and gaseous products from slow/fast pyrolysis and gasification | Models built with 95% confidence level to guide researchers and minimize experimental runs [40]. |
| Thermochemical Property Prediction [73] | Support Vector Machine (SVM), Random Forest (RF), Graph Neural Networks (GNNs) | Molecular structure (SMILES), custom descriptor sets (CDS) | Enthalpy of formation (EOF), entropy, heat capacities | CDS-RF model identified as a cost-effective and scalable alternative to resource-intensive quantum calculations [73]. |
| Process Selection Guidance [40] | Statistical Models / Decision Matrix | Carbon content (Moderate: 40-46%, High: >47%), Hydrogen content | Favored process: Gasification (if H high) or Slow Pyrolysis (if H low) for moderate C; Fast Pyrolysis for high C [40]. |
ML for Biochemical Conversion Monitoring
Biochemical processes, while slower, are highly complex biological systems. ML aids in monitoring and controlling these processes to maximize yield.
- Enzymatic Hydrolysis Optimization: ML models can predict sugar yields from enzymatic hydrolysis of lignocellulose by learning from data on feedstock composition, pretreatment methods, and enzyme cocktails. This is crucial for achieving commercially viable sugar concentrations for distillation [74].
- Fermentation and Anaerobic Digestion Control: AI systems can analyze real-time data from bioreactors (e.g., pH, temperature, metabolite levels) to predict and mitigate issues like product inhibition or microbial stress, thereby improving the efficiency of producing biofuels like biobutanol, bioethanol, and biogas [74].
Experimental Protocols and Data Generation
The efficacy of ML models is entirely dependent on the quality and relevance of the experimental data used for their training. Below are standardized protocols for generating key data for both pathways.
Protocol for Thermochemical Product Yield Analysis
This protocol outlines the experimental procedure for generating data on product yields from pyrolysis, which can be used to train ML models for prediction [40].
- Feedstock Preparation: Air-dry the biomass feedstock to a constant weight. Grind and sieve to a uniform particle size (e.g., 0.5-1.0 mm).
- Proximate and Ultimate Analysis: Conduct proximate analysis (moisture, volatile matter, fixed carbon, ash content) and ultimate analysis (C, H, N, S, O content) of the prepared feedstock.
- Pyrolysis Experiment Setup: Load a predetermined mass of feedstock (e.g., 10-50 g) into a fixed-bed or fluidized-bed reactor.
- Process Execution: Purge the reactor with an inert gas (e.g., N₂) to establish an oxygen-free environment. Apply a controlled heating rate (e.g., 10 °C/min for slow pyrolysis; >100 °C/s for fast pyrolysis) to a target temperature (400-650 °C) and maintain for a specified residence time.
- Product Collection and Quantification:
- Condensable Gases (Bio-oil): Condense the vapors using a series of condensers maintained at low temperatures (e.g., 0-4 °C). Weigh the collected bio-oil.
- Non-Condensable Gases (Syngas): Collect and measure the volume of the gas. Analyze its composition via Gas Chromatography (GC).
- Solid Residue (Biochar): Cool the reactor and weigh the remaining solid char.
- Data Recording: Record the mass yields of bio-oil, syngas, and biochar as a percentage of the initial dry feedstock mass. Correlate these yields with the feedstock properties and process parameters.
Protocol for Biochemical Sugar Yield Analysis
This protocol details the enzymatic hydrolysis process to generate data on fermentable sugar yields, a critical parameter for biochemical pathway efficiency [74].
- Feedstock Pretreatment: Subject the biomass to a pretreatment method (e.g., steam explosion, dilute-acid hydrolysis) to disrupt the lignin structure and enhance enzyme accessibility.
- Enzymatic Hydrolysis: Prepare a slurry of the pretreated biomass in a buffer solution (e.g., citrate buffer, pH 4.8-5.0) at a high solids loading (e.g., 10-20% w/w). Add a commercial cellulase and hemicellulase enzyme cocktail. Incubate the mixture in a shaking incubator at 50 °C for 48-72 hours.
- Sample Withdrawal and Quenching: At regular intervals (e.g., 0, 3, 6, 12, 24, 48, 72 h), withdraw small samples and immediately heat them to 95 °C for 10 minutes to deactivate the enzymes.
- Sugar Quantification: Centrifuge the quenched samples and analyze the supernatant using High-Performance Liquid Chromatography (HPLC) to quantify the concentrations of glucose, xylose, and other monomeric sugars.
- Data Recording: Calculate the sugar yield as a percentage of the theoretical maximum based on the cellulose and hemicellulose content of the pretreated biomass. Record yields against variables like pretreatment severity, enzyme dosage, and hydrolysis time.
The Scientist's Toolkit: Key Research Reagents and Solutions
Successful experimentation in both pathways relies on a suite of specialized reagents and analytical tools. The following table lists essential items for researchers in this field.
Table 3: Essential Research Reagent Solutions for Conversion Pathway Research
| Item Name | Function/Application | Relevant Pathway |
|---|---|---|
| Cellulase & Hemicellulase Cocktail | Enzyme blend for hydrolyzing cellulose and hemicellulose into fermentable sugars [74]. | Biochemical |
| S. cerevisiae / Genetically Engineered Yeast | Microorganism for fermenting sugars into bioethanol and other biofuels [74]. | Biochemical |
| Anaerobic Digestion Inoculum | A consortium of anaerobic microbes for converting organic matter into biogas [74]. | Biochemical |
| Custom Descriptor Set (CDS) | A curated set of molecular features used by ML models to predict thermochemical properties [73]. | Thermochemical |
| Inert Gas (N₂ or Ar) | Creates an oxygen-free environment for pyrolysis and gasification processes [40]. | Thermochemical |
| Catalysts (e.g., Zeolites) | Used in catalytic pyrolysis or gasification to improve bio-oil quality or syngas composition [18]. | Thermochemical |
| HPLC System | Quantifies sugar monomers (glucose, xylose) and inhibitory byproducts (e.g., furfural, HMF) in hydrolysates [74]. | Biochemical |
| Gas Chromatograph (GC) | Analyzes the composition of syngas (H₂, CO, CO₂, CH₄) and biogas [40]. | Both |
| Calorimeter | Determines the Higher Heating Value (HHV) of biomass feedstocks and solid/liquid products [41]. | Thermochemical |
Integrated Workflow and Data Utilization
The true power of ML is realized when data from controlled experiments is fed into predictive models to inform process design. The following diagram illustrates this integrated workflow for a thermochemical process, from initial data collection to final model deployment.
Diagram 2: ML model development and deployment workflow for conversion processes.
Performance Metrics and Sustainability Assessment: Techno-Economic and Environmental Evaluation
The global transition toward a sustainable bioeconomy has intensified the need for efficient biomass conversion technologies. Lignocellulosic biomass, with an annual production of approximately 181 billion tons, represents a crucial renewable resource for producing biofuels, bioenergy, and value-added chemicals [18]. The two primary technological pathways for converting this biomass—thermochemical and biochemical processes—offer distinct advantages and challenges in terms of yield, conversion rate, and product quality [13]. This guide provides a systematic comparison of these pathways, offering researchers and industry professionals a detailed analysis of their performance metrics based on current experimental data and technological developments. Understanding these parameters is essential for selecting the appropriate conversion strategy based on specific feedstock characteristics, desired products, and economic constraints.
Thermochemical conversion utilizes heat and chemical processes to transform biomass, while biochemical conversion employs biological catalysts like enzymes and microorganisms [18] [13]. The table below summarizes the fundamental characteristics of these pathways and their main processes.
Table 1: Fundamental Characteristics of Biomass Conversion Pathways
| Conversion Pathway | Main Processes | Primary Products | Key Operating Conditions | Typical Feedstock |
|---|---|---|---|---|
| Thermochemical | Pyrolysis (Fast & Slow), Gasification, Hydrothermal Liquefaction, Combustion | Bio-oil, Syngas, Biochar, Heat, Bioelectricity | High temperatures (300-1000°C), Varying pressure conditions, Absence or limited oxygen | Agricultural residues, Forestry waste, Municipal solid waste, Energy crops |
| Biochemical | Anaerobic Digestion, Fermentation (Ethanol, Butanol), Syngas Fermentation, Microbial Electrolysis Cells | Biogas (Methane), Bioethanol, Biobutanol, Biohydrogen, Organic acids | Mild temperatures (20-70°C), Ambient pressure, Biological catalysts (enzymes, microorganisms) | Agricultural waste, Food processing residues, Livestock manure, Dedicated energy crops |
The core distinction between these pathways lies in their conversion mechanisms and timescales. Thermochemical processes achieve rapid breakdown of biomass components through thermal degradation, typically completing in seconds to minutes [18]. In contrast, biochemical processes rely on biological catalysts to break down biomass, requiring significantly longer processing times ranging from days to weeks [13] [75].
Conversion Efficiency Metrics: Yield, Rate, and Product Quality
Quantitative Yield and Rate Comparison
The product yield and conversion rate vary significantly between technologies, influenced by feedstock composition, process parameters, and technological maturity. The following table synthesizes experimental data from recent studies comparing these critical efficiency metrics.
Table 2: Yield and Rate Comparison of Thermochemical and Biochemical Conversion Processes
| Conversion Process | Typical Product Yields | Conversion Rate | Key Influencing Parameters | Product Quality & Characteristics |
|---|---|---|---|---|
| Fast Pyrolysis | Bio-oil: 50-75 wt% [40]; Optimized refuse-derived fuel: up to 67.9 wt% liquid oil [5] | Very fast (seconds to minutes) [18] | Temperature (500-650°C), Heating rate, Particle size, Vapor residence time | Bio-oil: High oxygen content, acidic, requires upgrading; Heating value: ~16-19 MJ/kg [11] |
| Slow Pyrolysis | Biochar: 30-35 wt%; Optimized biochar with specific surface area up to 400 m²/g [6] | Slow (30-180 minutes) [18] | Temperature (~400°C), Heating rate, Residence time | Biochar: High carbon content, porous structure; Used for soil amendment, adsorption, carbon sequestration [40] |
| Gasification | Syngas: Varies with feedstock; Heating values up to 10.9 MJ/m³ for refuse-derived fuel [5] | Fast (minutes) | Temperature (800-1000°C), Equivalence ratio, Gasifying agent, Catalyst | Syngas: Mainly CO, H₂, CH₄, CO₂; Requires tar removal; Suitable for power generation, chemical synthesis [18] [5] |
| Anaerobic Digestion | Biogas: 0.2-0.5 m³/kg VS; Methane content: 50-75% [13] | Slow (20-50 days) | Temperature (mesophilic: 30-40°C, thermophilic: 50-60°C), pH, C/N ratio, Retention time | Biogas: Requires upgrading to biomethane; Digestate: Nutrient-rich, useful as fertilizer [13] [75] |
| Fermentation (Ethanol) | Ethanol: 70-90% of theoretical yield [75]; Enzymatic systems: >90% conversion yields [76] | Moderate (2-5 days) | Enzyme loading, Temperature (30-37°C), pH, Sugar concentration | Bioethanol: Requires purification; Lower energy content (21.1 MJ/L) than gasoline but reduces CO₂ emissions [27] |
Product Quality and Applications
Product quality varies substantially between conversion pathways. Thermochemical processes typically generate energy-dense products like bio-oil and syngas that can be directly utilized for heat and power generation or further refined into transportation fuels [18] [11]. Biochemical processes produce fuels such as biogas and bioethanol that often require additional upgrading steps but generally have better compatibility with existing fuel infrastructure [27] [13].
Advanced enzymatic systems in biochemical conversion have demonstrated remarkable efficiency improvements, achieving near 90-100% conversion yields with minimal waste generation [76]. This represents a significant advantage over traditional fermentation processes, which typically achieve approximately 30% yields due to cell toxicity limitations and cell biomass waste [76].
Experimental Protocols and Methodologies
Thermochemical Conversion: Fast Pyrolysis Protocol
Objective: To convert lignocellulosic biomass into bio-oil through rapid thermal decomposition in the absence of oxygen. Materials:
- Feedstock: Dried, powdered biomass (<2 mm particle size)
- Reactor: Fluidized bed reactor with temperature control
- Carrier gas: Nitrogen (oxygen-free)
- Condensation system: Multiple condensers maintained at different temperatures
- Collection vessels for bio-oil, char, and non-condensable gases
Procedure:
- Feedstock Preparation: Dry biomass to moisture content <10%, then grind and sieve to achieve uniform particle size distribution.
- Reactor Setup: Preheat reactor to target temperature (500-650°C) under continuous nitrogen flow to maintain inert atmosphere.
- Feeding System: Introduce biomass feedstock at controlled rate (typically 1-5 kg/h) using screw feeder or pneumatic transport.
- Vapor Condensation: Direct resulting vapors through series of condensers maintained at progressively lower temperatures (from 200°C to 0°C) to collect bio-oil fractions.
- Product Collection: Separate and quantify bio-oil (liquid), char (solid), and non-condensable gases (gas) for yield calculation.
- Analysis: Characterize bio-oil for water content, pH, viscosity, heating value, and chemical composition using appropriate analytical methods (GC-MS, Karl Fischer titration, etc.).
Key Parameters: Temperature, heating rate, vapor residence time, particle size, and condensation efficiency significantly impact product distribution and quality [18] [11].
Biochemical Conversion: Anaerobic Digestion Protocol
Objective: To convert organic biomass into biogas through microbial degradation in the absence of oxygen. Materials:
- Inoculum: Adapted anaerobic sludge or digestate from operating biogas plant
- Substrate: Prepared biomass (size-reduced and pre-treated if necessary)
- Bioreactors: Batch or continuous systems with temperature control and gas collection
- Gas collection system: Gas bags or inverted cylinders with water displacement
- Analytical equipment: pH meter, GC for biogas composition, COD analysis kits
Procedure:
- Inoculum Preparation: Collect active anaerobic digester sludge and pre-incubate to deplete residual biodegradable material.
- Substrate Preparation: Reduce particle size of biomass (<1 cm) to increase surface area; apply pre-treatment if necessary (alkaline, acidic, or thermal).
- Reactor Setup: Mix inoculum and substrate in optimal ratio (typically 1:1 to 3:1 based on volatile solids) in sealed bioreactors.
- Incubation: Maintain reactors at optimal temperature (mesophilic: 35±2°C or thermophilic: 55±2°C) with continuous mixing (if applicable) for hydraulic retention time of 20-50 days.
- Gas Monitoring: Regularly measure biogas production volume and composition (methane, carbon dioxide, hydrogen sulfide).
- Process Monitoring: Track pH, volatile fatty acids, alkalinity, and chemical oxygen demand to assess process stability.
- Digestate Analysis: Characterize residual material for nutrient content and stability after digestion.
Key Parameters: Temperature, pH (optimal 6.8-7.5), carbon-to-nitrogen ratio (20-30:1), organic loading rate, mixing intensity, and hydraulic retention time significantly impact process efficiency and methane yield [13] [75].
Process Visualization
Diagram Title: Biomass Conversion Pathways Comparison
This diagram visualizes the two primary biomass conversion pathways, highlighting their distinct process conditions, main technologies, and resulting products with key efficiency metrics.
Research Reagent Solutions
The following table details essential reagents, catalysts, and materials required for experimental research in biomass conversion technologies.
Table 3: Essential Research Reagents and Materials for Biomass Conversion Studies
| Reagent/Material | Function/Application | Specific Examples & Technical Specifications | Supplier Considerations |
|---|---|---|---|
| Lipase Enzymes | Catalyze transesterification and hydrolysis reactions in biodiesel production | Free lipase, immobilized lipase; Used under mild reaction conditions (30-50°C, ambient pressure) | Select based on thermal stability, pH optimum, and specificity for target substrates |
| Cellulase Enzymes | Hydrolyze cellulose to fermentable sugars in biochemical conversion | Cellulase cocktails; Optimal activity at 45-50°C, pH 4.5-5.5; Required dosage varies with biomass type and pretreatment | Consider enzyme activity units, purity, and compatibility with pretreatment methods |
| PETase Enzymes | Degrade polyethylene terephthalate (PET) plastics in waste processing | FAST-PETase; Can degrade untreated post-consumer PET in approximately one week | Emerging technology; limited commercial availability; requires specific reaction conditions |
| Heterogeneous Catalysts | Upgrade bio-oil from pyrolysis through deoxygenation, cracking, and reforming | Zeolites (ZSM-5), transition metal catalysts (Ni, Co); Operate at 300-600°C | Select based on target reactions (deoxygenation, cracking), acidity, and metal loading |
| Anaerobic Inoculum | Microbial consortium for biogas production through anaerobic digestion | Adapted anaerobic sludge from operating biogas plants; Maintain at 35°C (mesophilic) or 55°C (thermophilic) | Source from facilities processing similar feedstock; pre-incubate to activate microbial communities |
| Chemical Pretreatment Agents | Disrupt lignocellulosic structure to enhance enzymatic digestibility | Dilute acid (H₂SO₄, HCl), alkaline (NaOH, Ca(OH)₂), oxidative (ozone) reagents; Concentration typically 0.5-5% | Consider corrosion-resistant equipment for acidic treatments; neutralization required post-treatment |
This comparison guide demonstrates that both thermochemical and biochemical conversion pathways offer distinct advantages for specific applications and feedstock types. Thermochemical processes, particularly pyrolysis and gasification, provide rapid conversion rates (seconds to minutes) and are suitable for diverse feedstock including those with high lignin content [18] [11]. Biochemical processes, while slower (days to weeks), achieve higher conversion yields for specific products like bioethanol (>90% with advanced enzymatic systems) and operate under milder conditions [13] [76]. The integration of artificial intelligence and machine learning approaches is enhancing both pathways by optimizing process parameters, predicting yields, and accelerating catalyst development [27] [40]. Selection between these technologies should consider factors including feedstock composition, desired products, scalability requirements, and environmental impacts, with emerging hybrid approaches potentially offering the most efficient solutions for comprehensive biomass valorization in a circular bioeconomy framework.
The transition from a fossil-based economy to a sustainable, biobased one necessitates advanced technologies capable of converting renewable biomass into fuels and chemicals. Among these technologies, biochemical and thermochemical conversion pathways represent two prominent approaches for processing lignocellulosic biomass, algal feedstocks, and waste streams into valuable products [77] [26] [78]. Life Cycle Assessment (LCA) has emerged as a critical methodological framework for quantifying the environmental performance of these conversion routes, enabling researchers and policymakers to make informed decisions based on comprehensive carbon footprint analysis and environmental impact evaluation [77] [79] [26]. This guide provides a systematic comparison of biochemical and thermochemical conversion pathways, synthesizing quantitative LCA data, detailing experimental methodologies, and analyzing environmental performance across multiple impact categories to inform research and development in sustainable biofuel and bioproduct production.
Methodology of Life Cycle Assessment for Conversion Pathways
LCA Framework and System Boundaries
Life Cycle Assessment follows a standardized methodology comprising four key phases: goal definition and scope delineation, life cycle inventory compilation, life cycle impact assessment, and result interpretation [80]. For comparing biochemical and thermochemical pathways, researchers typically employ a cradle-to-gate approach that includes feedstock production, transportation, processing, and conversion, but excludes product use [77]. Alternatively, well-to-wheel (WTW) system boundaries encompass the complete lifecycle from feedstock generation through fuel combustion in vehicles [26] [19].
Recent studies have advanced LCA methodology through harmonized approaches that integrate specialized software tools. For instance, researchers have coupled OpenLCA with process simulation results from Aspen Plus and thermal management results from MATLAB to enhance modeling accuracy [79]. Such integration allows for more reliable assessment of emerging conversion technologies where experimental data may be limited.
Key Environmental Impact Categories
LCA studies for conversion pathways typically evaluate multiple environmental impact categories, with particular emphasis on:
- Climate Change: Measured in kg CO₂ equivalent (eq.), including biogenic carbon accounting [79] [26]
- Energy Consumption: Cumulative energy demand, distinguishing between renewable and non-renewable sources [19]
- Acidification Potential: Measured in g SO₂ eq., indicating air pollution impacts [79]
- Eutrophication Potential: Measured in g PO₄ eq., assessing water quality impacts [80]
- Particulate Matter Formation: Evaluating air quality and health impacts [80]
Table 1: Standard LCA Impact Categories and Units for Conversion Pathways
| Impact Category | Measurement Unit | Characterization Method | Relevance to Conversion Pathways |
|---|---|---|---|
| Climate Change | kg CO₂ eq. | IPCC | Carbon footprint of entire process |
| Acidification | g SO₂ eq. | CML | Emissions from processing steps |
| Eutrophication | g PO₄ eq. | CML | Nutrient runoff from feedstock production |
| Non-renewable Energy Use | MJ eq. | VDI | Fossil fuel consumption |
| Particulate Matter Formation | g PM₂.₅ eq. | TRACI | Air quality impacts from combustion |
Biochemical Conversion Pathway
Process Description and Experimental Protocols
Biochemical conversion utilizes biological catalysts, including enzymes and microorganisms, to decompose biomass into simple sugars that are subsequently fermented into fuels and chemicals [77] [19]. The National Renewable Energy Laboratory (NREL) has developed a standardized biochemical conversion process featuring several critical unit operations [19]:
Pretreatment: Biomass undergoes dilute acid pretreatment at elevated temperatures (160-190°C) to break down lignocellulosic structure and improve enzymatic accessibility.
Enzymatic Hydrolysis: Cellulase enzymes convert cellulose into fermentable glucose sugars under controlled pH and temperature conditions (48-50°C).
Fermentation: Genetically engineered microorganisms (typically Saccharomyces cerevisiae) ferment sugars into ethanol or other target products.
Product Recovery: Ethanol is separated from the fermentation broth through distillation and molecular sieving to achieve 99.95% purity [19].
Experimental protocols for biochemical LCA involve meticulous material and energy balancing across all unit operations. For instance, the enzymatic hydrolysis efficiency is typically measured as glucose yield per dry ton of biomass, with commercial enzyme loads ranging from 15-30 mg protein per gram of cellulose [19].
Carbon Footprint and Environmental Performance
Biochemical conversion pathways exhibit variable environmental performance depending on feedstock characteristics and process configuration. For terephthalic acid production from Miscanthus, the biochemical route demonstrated significantly higher environmental impacts in most categories compared to the thermochemical alternative [77]. Enzyme production was identified as a major environmental hotspot, contributing substantially to energy consumption and associated emissions [77].
For bioethanol production, biochemical pathways generally show greenhouse gas (GHG) emissions ranging from 30-80 g CO₂ eq./MJ, influenced by feedstock type and allocation methods [19]. The integration of combined heat and power (CHP) systems utilizing process residues can significantly improve the carbon footprint through displacement of grid electricity.
Thermochemical Conversion Pathway
Process Description and Experimental Protocols
Thermochemical conversion utilizes heat and chemical processes to transform biomass into intermediate energy carriers (syngas, bio-oil) that are upgraded to final products [77] [78]. The NREL thermochemical process for mixed alcohol production involves several key operations [19]:
Gasification: Biomass is converted to syngas (primarily CO and H₂) through indirect gasification at 700-900°C with steam.
Gas Cleaning: Raw syngas undergoes conditioning to remove contaminants (tars, sulfur compounds, particles) that would poison downstream catalysts.
Catalytic Synthesis: Cleaned syngas is converted to mixed alcohols (mainly ethanol and propanol) using molybdenum-based catalysts at elevated pressures (50-100 bar).
Product Separation: Alcohols are separated through distillation and purification sequences.
Advanced thermochemical pathways include hydrothermal liquefaction (HTL) for wet feedstocks like algae, which converts biomass to bio-crude without energy-intensive drying [26]. Experimental protocols monitor critical parameters including syngas composition (H₂/CO ratio), carbon conversion efficiency, and catalyst lifetime [19].
Carbon Footprint and Environmental Performance
Thermochemical pathways generally demonstrate superior environmental performance compared to biochemical routes for most impact categories. For terephthalic acid production, the thermochemical route showed better than 50% improvement in most impact categories [77]. Energy requirements were identified as the primary environmental hotspot rather than catalyst consumption [77].
The improved Sulfur-Iodine (S-I) thermochemical cycle for hydrogen production exhibits a carbon footprint of 1422.71 g CO₂ eq./kg H₂, representing a 46.16% reduction compared to conventional steam methane reforming [79]. Similarly, acidification footprint is reduced by 63.89% compared to the conventional method [79].
Table 2: Comparative Carbon Footprint of Conversion Pathways for Different Products
| Product | Feedstock | Conversion Pathway | Carbon Footprint | Benchmark |
|---|---|---|---|---|
| Terephthalic Acid | Miscanthus | Biochemical | >50% higher than thermochemical | Fossil-based route [77] |
| Terephthalic Acid | Miscanthus | Thermochemical | >50% lower than biochemical | Fossil-based route [77] |
| Hydrogen | Water | Improved S-I Thermochemical | 1422.71 g CO₂ eq./kg H₂ | SMR: 2642.72 g CO₂ eq./kg H₂ [79] |
| Renewable Diesel | Algae (HTL) | Thermochemical | Negative net emissions | Petroleum diesel [26] |
| Renewable Diesel | PFAD | Biochemical | Highest emissions among pathways | Petroleum diesel [26] |
| Ethanol | Various biomass | Thermochemical | Lower TRACI impacts than biochemical | Gasoline [19] |
Comparative Analysis of Conversion Pathways
Environmental Impact Comparison
Direct comparisons between biochemical and thermochemical pathways reveal distinct environmental trade-offs. The thermochemical pathway generally outperforms biochemical conversion in most environmental impact categories, particularly regarding acidification potential, non-renewable energy consumption, and climate change impacts [77] [19]. However, optimal environmental performance depends heavily on specific process configurations, feedstock characteristics, and allocation methods.
For aviation and maritime biofuel production, integrated thermochemical-biochemical pathways can achieve GHG emission reductions of 60-86% compared to conventional fossil fuels [78]. The highest GHG emissions are associated with scenarios where energy-intensive preprocessing is required, contributing approximately 42% to the total climate change impact [78].
Feedstock Considerations and Technological Flexibility
Feedstock selection significantly influences the environmental performance of both pathways. Thermochemical conversion demonstrates greater flexibility, effectively processing diverse feedstocks including high-lignin materials that are unsuitable for biochemical processing [19]. However, thermochemical processes are more sensitive to feedstock moisture content, with high moisture significantly impacting energy efficiency and emissions [19].
Biochemical processes face limitations regarding lignin content, with high lignin materials like loblolly pine resulting in reduced yields and consequently higher environmental impacts per unit product [19]. Additionally, biochemical pathways typically require more uniform feedstock specifications, potentially necessitating larger collection radii to supply commercial-scale facilities [19].
Figure 1: Comparative LCA Workflow for Biochemical vs. Thermochemical Pathways
Advanced LCA Applications and Emerging Pathways
Integrated Biorefinery Concepts and Circular Economy
Advanced biorefinery concepts integrate multiple conversion pathways to maximize resource efficiency and minimize environmental impacts. Third-generation biorefineries utilizing algal biomass demonstrate particularly promising environmental performance, with some pathways achieving negative net emissions [26]. Algae hydrothermal liquefaction (HTL) and combined algae processing (CAP) pathways show significantly lower emissions compared to second-generation pathways utilizing palm fatty acid distillation (PFAD) [26].
The circular economy approach further enhances sustainability through agricultural biomass conversion into biochar and hydrochar, which can improve crop yields by 19.9–36.9% while sequestering carbon [6]. LCA studies confirm notable environmental benefits including greenhouse gas emission reductions of 1.5 to 3.5 tCO₂-eq per ton and production costs as low as $116.0/ton for biochar and $30.0/ton for hydrochar [6].
Waste Valorization through Thermochemical Conversion
Thermochemical conversion of waste streams presents significant opportunities for reducing environmental impacts while addressing waste management challenges. Refuse-derived fuel (RDF) from municipal solid waste can be processed through pyrolysis, gasification, and incineration with cement kilns achieving thermal substitution rates of 50–60% in rotary kilns and 80–100% in calciners [5].
Optimized RDF pyrolysis can yield up to 67.9 wt% liquid oil, while gasification produces syngas with heating values up to 10.9 MJ m⁻³ [5]. These waste valorization pathways demonstrate how thermochemical conversion can support circular economy objectives while providing favorable environmental performance compared to traditional waste disposal methods.
Table 3: Emerging Conversion Pathways and Environmental Performance
| Pathway | Feedstock | Technology | Key Environmental Benefits | Technology Readiness |
|---|---|---|---|---|
| Algae HTL | Microalgae | Thermochemical | Negative net emissions, low water requirement | Pilot scale [26] |
| Combined Algae Processing | Microalgae | Biochemical | Low emissions, CO₂ utilization | Pilot scale [26] |
| Improved S-I Cycle | Water | Thermochemical | 46% lower carbon footprint than SMR | Laboratory scale [79] |
| Waste Valorization | Municipal solid waste | Thermochemical | Waste reduction, fossil fuel displacement | Commercial deployment [5] |
| Biochar Production | Agricultural residues | Thermochemical | Carbon sequestration, soil improvement | Commercial deployment [6] |
Research Reagents and Materials Toolkit
Table 4: Essential Research Reagents and Materials for Conversion Pathway Studies
| Reagent/Material | Function | Application Examples | Environmental Considerations |
|---|---|---|---|
| Cellulase Enzymes | Hydrolyzes cellulose to fermentable sugars | Biochemical conversion | Energy-intensive production [77] |
| Molybdenum Catalysts | Converts syngas to mixed alcohols | Thermochemical synthesis | Catalyst synthesis impacts |
| Potassium Hydroxide (KOH) | Chemical activation | Activated carbon production [80] | Energy-intensive manufacturing [80] |
| Sodium Hydroxide (NaOH) | Chemical activation | Activated carbon production [80] | Lower energy requirement than KOH [80] |
| Dilute Acid (H₂SO₄) | Biomass pretreatment | Biochemical conversion [19] | Corrosivity, neutralization requirements |
| Aspen Plus Software | Process simulation | LCA inventory development [79] | Computational resource requirements |
| GREET Model | LCA modeling | Well-to-wheel analysis [26] | Model assumptions influence results |
This comparison guide has systematically evaluated the environmental impacts and carbon footprint of biochemical and thermochemical conversion pathways through the lens of Life Cycle Assessment. The evidence indicates that thermochemical pathways generally offer superior environmental performance for most impact categories, with demonstrated advantages in climate change impacts, acidification potential, and non-renewable energy consumption [77] [79]. However, biochemical pathways remain competitive for specific feedstocks and applications, particularly when process-specific advantages such as mild operating conditions and high product selectivity are considered.
Future research should focus on integrating these pathways within circular biorefinery systems that maximize resource efficiency while minimizing environmental impacts. The development of standardized LCA methodologies, particularly for emerging pathways like algal biofuel production and waste valorization, will enable more robust comparisons and guide policy decisions. As both biochemical and thermochemical technologies continue to mature, LCA will play an increasingly critical role in identifying environmental hotspots and guiding sustainable process optimization.
A comprehensive techno-economic analysis is critical for selecting the optimal biomass conversion pathway. This guide provides a detailed, data-driven comparison of the financial performance of thermochemical and biochemical technologies, offering researchers a framework for strategic decision-making.
Financial Performance Comparison of Conversion Pathways
The economic viability of biofuel production is highly dependent on the chosen conversion pathway and feedstock. The table below summarizes key financial and environmental metrics for producing ethanol via the National Renewable Energy Laboratory's (NREL) well-established thermochemical and biochemical processes, analyzed across multiple feedstocks [19].
Table 1: Financial and Environmental Performance of NREL Conversion Pathways (Functional Unit: 1 MJ fuel)
| Conversion Pathway | Feedstock | Minimum Ethanol Selling Price (MESP) | Greenhouse Gas (GHG) Emissions (g CO₂-eq/MJ) | TRACI Single Score Impact (points/MJ) | Key Financial Drivers |
|---|---|---|---|---|---|
| Thermochemical | Pine | Lowest MESP | ~50 | Lowest Impact | Feedstock moisture content, catalyst cost [19] |
| Thermochemical | Switchgrass | Higher MESP | Higher | Higher Impact | High ash content lowering yield [19] |
| Biochemical | Sweet Sorghum | Lowest MESP | ~55 | Lowest Impact | Hydrogen feedstock cost, onstream factor [81] [19] |
| Biochemical | Loblolly Pine | Higher MESP | Higher | Higher Impact | High lignin content lowering yield [19] |
Key Insight: The thermochemical process generally results in somewhat lower GHG emissions and lower environmental impacts (TRACI score) per megajoule (MJ) of fuel compared to the biochemical pathway [19]. Financially, the thermochemical process paired with pine and the biochemical process paired with sweet sorghum show the most favorable performance, indicating that feedstock-process compatibility is a primary determinant of economic success [19].
Experimental Protocols for Techno-Economic Analysis (TEA)
The financial data presented in this analysis are derived from rigorous techno-economic models developed by leading research institutions. The methodologies for the key processes are as follows:
NREL Biochemical Conversion Process (Dilute-Acid Pretreatment)
- Objective: To convert lignocellulosic biomass to ethanol via enzymatic hydrolysis and fermentation and determine the minimum ethanol selling price (MESP) [19].
- Workflow:
- Pretreatment: Biomass is subjected to dilute-acid pretreatment at high temperature to break down the hemicellulose and make the cellulose more accessible [19].
- Enzymatic Hydrolysis: Enzymes are added to hydrolyze the cellulose into fermentable sugars (e.g., glucose) [19].
- Fermentation: Microorganisms (e.g., yeast) ferment the sugars into a low-concentration ethanol solution ("beer") [19].
- Product Recovery: The ethanol is concentrated to approximately 99.95% purity through distillation and molecular sieving [19].
- Co-product Handling: The lignin-rich residue is typically burned for combined heat and power (CHP), with excess electricity considered a co-product [19].
- Financial Modeling: The process simulation generates a life cycle inventory, and financial metrics like MESP are calculated considering capital depreciation, equity returns, and operating costs [19].
NREL Thermochemical Conversion Process (Indirect Gasification)
- Objective: To convert biomass into mixed alcohols (primarily ethanol) via gasification and catalytic synthesis and determine the MESP [19].
- Workflow:
- Gasification: Biomass is converted into a raw synthesis gas (syngas), primarily carbon monoxide (CO) and hydrogen (H₂), through indirect gasification [19].
- Syngas Cleaning: Contaminants (e.g., tars, particles) that can foul catalysts are removed from the raw syngas [19].
- Catalytic Synthesis: The clean syngas is passed over a molybdenum-based catalyst to synthesize a mixture of alcohols, including ethanol and propanol [19].
- Product Separation: The mixed alcohols are separated into final products [19].
- Financial Modeling: The process is modeled using software like Aspen Plus to generate mass and energy balances. This data feeds into a financial model to calculate MESP, with higher alcohols converted to ethanol equivalents for accounting [19].
Diagram 1: A simplified workflow comparing the fundamental steps of the thermochemical and biochemical conversion pathways.
Cost Structures and Market-Led ROI Timelines
A granular understanding of cost components and external market forces is essential for projecting Return on Investment (ROI).
Operational Expenditure (OPEX) Drivers
- Hydrogen Feedstock Cost: For advanced biological conversion routes (e.g., converting CO₂ to fuels), hydrogen feedstock cost is the dominant OPEX driver, significantly impacting the minimum selling price of products like methane, acetic acid, and ethanol [81].
- Feedstock Flexibility & Cost: The thermochemical process can handle a wider range of feedstocks, including those with high lignin content, without major process modifications. This flexibility can mitigate biomass supply chain risks and costs [19]. In contrast, the biochemical process is more sensitive to feedstock composition, with high lignin content directly lowering conversion yields and increasing unit costs [19].
- Utilities & Catalyst Consumption: Thermochemical processes, particularly gasification and pyrolysis, operate at very high temperatures (e.g., 700–900°C for gasification), leading to significant energy input requirements [1] [24]. Catalyst consumption, especially for syngas upgrading and synthesis, also constitutes a major recurring cost [24] [19].
Capital Expenditure (CAPEX) Considerations
- Plant Complexity & Scale: Thermochemical plants, especially those incorporating complex gas cleaning and catalytic synthesis systems, often involve higher initial capital costs due to the need for high-temperature, pressure-resistant reactors and auxiliary systems [13] [24].
- Pre-treatment Requirements: Biochemical facilities require dedicated, and often costly, pre-treatment reactors (e.g., for dilute-acid or steam explosion) to break down biomass recalcitrance, adding to CAPEX [19].
Market Context and ROI Trajectory
The ROI timeline for both pathways is accelerating due to strong market and policy support.
- Favorable Government Incentives: In the United States, second-generation biofuel producers are eligible for tax credits of up to $1.01 per gallon, which directly improves project economics and shortens payback periods [82].
- Robust Market Growth: The advanced biofuels market is experiencing phenomenal growth, projected to soar from $116.85 billion in 2024 to $647.25 billion by 2029, a compound annual growth rate (CAGR) of 41.0% [83]. This explosive growth creates a favorable environment for investment and commercial scalability.
- Cost of Carbon Mitigation: While promising, the cost of carbon mitigation through these biofuel pathways, even with subsidies, has been found to be higher than the expected market carbon price. This indicates that from a pure carbon abatement perspective, other methods might currently be more cost-effective [19].
The Scientist's Toolkit: Key Research Reagent Solutions
Table 2: Essential Reagents and Materials for Biofuel Conversion Research
| Reagent/Material | Function in Research | Application in Pathways |
|---|---|---|
| Molybdenum-based Catalysts | Facilitates the catalytic synthesis of mixed alcohols (e.g., ethanol, propanol) from clean syngas. | Thermochemical [19] |
| Lignocellulolytic Enzymes | Cocktail of cellulases and hemicellulases that hydrolyze pretreated biomass into fermentable sugars (e.g., glucose, xylose). | Biochemical [19] |
| Dilute Acid (e.g., H₂SO₄) | Used in pretreatment to break down the hemicellulose fraction of biomass, making cellulose more accessible to enzymes. | Biochemical [19] |
| Fermentative Microorganisms | Engineered yeast or bacteria that convert C5 and C6 sugars into target molecules like ethanol or organic acids. | Biochemical [13] [19] |
| Aspen Plus Simulation Software | Industry-standard process modeling tool used to simulate mass/energy balances and generate life cycle inventory data for TEA. | Thermochemical [19] |
| Ionic Liquids / Organosolv | Advanced solvent systems for biomass pretreatment; can improve sugar yield and minimize insoluble lignin. | Biochemical (Pre-treatment) [82] |
The pursuit of sustainable energy systems necessitates a critical evaluation of the energy return on investment (EROI) for biomass conversion technologies. Within the broader thesis comparing biochemical and thermochemical pathways, understanding their net energy gain—the balance between energy outputs and process energy inputs—is paramount for researchers and industry professionals aiming to optimize biofuel production [84]. Biochemical conversion leverages biological agents like enzymes and microorganisms to break down biomass at low temperatures, typically producing fuels such as ethanol through fermentation [1]. In contrast, thermochemical conversion utilizes heat and chemical catalysts at elevated temperatures to decompose biomass via processes like pyrolysis and gasification, yielding products such as bio-oil, syngas, and biochar [1] [11]. This guide objectively compares the energy performance of these pathways, providing structured experimental data and methodologies to inform research and development decisions in renewable energy.
Fundamental Principles and Energy Flow
The net energy efficiency of a conversion pathway is fundamentally determined by the ratio of usable energy output to the energy required for the entire process, including feedstock pretreatment, primary conversion, and output upgrading. Thermochemical processes generally demand significant external energy to achieve high operating temperatures (e.g., 400-900°C for pyrolysis and gasification), creating a substantial energy debt [11] [24]. However, their high conversion rates and versatile energy-dense outputs (syngas, bio-oil) can offset this initial investment [5]. Biochemical pathways, while operating at ambient or mildly elevated temperatures, are often hindered by intrinsic biomass recalcitrance, requiring energy-intensive pretreatment and long processing times (days to weeks), which impacts their overall energy balance [13] [18].
The following diagram illustrates the logical relationship and comparative energy flow between these two fundamental pathways.
Diagram: Comparative Energy Flow in Biomass Conversion Pathways. Thermochemical routes require high initial energy input but generate high-density outputs, whereas biochemical routes use lower-temperature processes but produce medium-density outputs.
Comparative Energy Performance Data
The following tables synthesize quantitative data on energy inputs, outputs, and net gains for the two primary conversion pathways, providing a basis for objective comparison.
Table 1: Energy Input Requirements for Conversion Pathways
| Process Stage | Biochemical Conversion | Thermochemical Conversion | Key Parameters & Conditions |
|---|---|---|---|
| Pretreatment | 10-30% of total energy input [18] [13] | 15-35% of total energy input [24] [5] | Milling, acid/alkali hydrolysis (Biochemical); Drying to <10-15% moisture (Thermochemical) [24] [13] |
| Primary Conversion | Low temp (20-60°C); Energy for mixing & reactor control [1] [13] | High temp (400-900°C); Major energy for heating [1] [11] | Fermentation (1-7 days), Anaerobic Digestion (weeks) [13]; Fast Pyrolysis (~500°C, 1-2s), Gasification (800-900°C) [11] [24] |
| Output Upgrading | Distillation (high energy for ethanol separation) [18] | Catalytic upgrading of bio-oil, Syngas cleaning [11] [24] | Distillation for ethanol dehydration; Hydrotreating for bio-oil [85] |
Table 2: Energy Output and Net Gain Performance
| Metric | Biochemical Conversion | Thermochemical Conversion | Notes & Experimental Context |
|---|---|---|---|
| Primary Outputs | Ethanol, Biogas (CH₄, CO₂) [13] | Bio-oil, Syngas (CO, H₂), Biochar [11] [24] | Output energy density is highly feedstock-dependent. |
| Output Energy Density | Ethanol: ~26.8 MJ/kg [18] | Bio-oil: 15-25 MJ/kg; Syngas: 10-20 MJ/Nm³ [11] [5] | Syngas LHV increases with H₂ content (e.g., steam gasification) [24]. |
| Reported Net Energy Gain | Can be positive for optimized systems; highly sensitive to feedstock and pretreatment [18] [13] | Pyrolysis: Can yield up to 67.9 wt% liquid oil [5]; Gasification syngas LHV up to 10.9 MJ/m³ [5] | NER >1 indicates net positive energy. Thermochemical often shows higher potential for liquid fuel output. |
| Key Influencing Factor | Feedstock lignin content & sugar yield; fermentation efficiency [13] | Heating rate, temperature, catalyst use, feedstock ash content [11] [24] | Biochemical is more susceptible to feedstock composition. |
Detailed Experimental Protocols for Energy Assessment
Protocol for Thermochemical Gasification Energy Balance
This protocol outlines a standardized method for determining the net energy balance of fluidized-bed gasification, a common thermochemical process.
1. Feedstock Preparation:
- Material: Agricultural residue (e.g., rice husk, wheat straw).
- Procedure: Air-dry feedstock to a consistent moisture content (<15%). Reduce particle size to 0.5-1.0 mm using a mill. Characterize the feedstock via proximate and ultimate analysis to determine moisture, ash, volatile matter, fixed carbon, and CHNSO content [24] [5].
2. Reactor Setup & Calibration:
- Apparatus: A laboratory-scale bubbling fluidized-bed gasifier reactor system. The system includes a feedstock hopper with a screw feeder, a preheated fluidized-bed reactor chamber (using an inert material like silica sand as the bed), a heated gas delivery system for the oxidizing agent (air, O₂, or steam), a temperature control system with multiple thermocouples, and a product collection train [24].
- Calibration: Calibrate the screw feeder to ensure a consistent feed rate (e.g., 1-2 kg/h). Calibrate all thermocouples and gas flow meters. The system's energy input is calculated from the electrical consumption of heaters and the thermal energy contained in the preheated gasifying agent.
3. Gasification Experiment:
- Procedure: Heat the reactor to the target temperature (e.g., 800°C) under an inert N₂ atmosphere. Introduce the fluidizing/gasifying agent (e.g., steam at a S/B ratio of 1.0) [24]. Initiate the feedstock feeding at the predetermined rate. Maintain steady-state conditions for a minimum of 60 minutes.
- Data Collection: Continuously monitor and record reactor temperature, pressure, and feed rate. Collect the produced syngas in gas bags at regular intervals for composition analysis via Gas Chromatography (GC) to determine the concentrations of H₂, CO, CO₂, and CH₄. Collect solid residues (char/ash) for subsequent mass determination and analysis.
4. Energy Balance Calculation:
- Energy Input (E_in): Sum of the electrical energy for reactor heating and the enthalpy of the gasifying agent.
- Energy Output (E_out): Calculated from the higher heating value (HHV) of the produced syngas, based on its composition and total volume.
- Net Energy Gain: Enet = Eout - Ein. The Energy Return on Investment (EROI) is calculated as EROI = Eout / E_in. A value greater than 1 indicates a net energy gain [24] [5].
Protocol for Biochemical Anaerobic Digestion (AD) Energy Balance
This protocol describes the methodology for evaluating the net energy yield from the anaerobic digestion of agricultural waste.
1. Inoculum and Substrate Preparation:
- Substrate: Fresh agricultural waste (e.g., dairy manure, corn stover).
- Procedure: For lignocellulosic biomass like corn stover, a pretreatment step is required. This involves milling and a dilute acid (e.g., 1% H₂SO₄) or alkaline (e.g., 1% NaOH) pretreatment at 121°C for 30-60 minutes to break down lignin and hemicellulose [18] [13]. The substrate is then neutralized.
- Inoculum: Collect active anaerobic sludge from an operating digester.
2. Biochemical Methane Potential (BMP) Assay:
- Apparatus: Multiple serum bottles (e.g., 500 mL) with rubber septa and aluminum seals, placed in a mesophilic (35±2°C) incubator with continuous agitation [13].
- Procedure: Load bottles with a defined ratio of substrate to inoculum (e.g., 1:2 on a volatile solids basis). Include control bottles containing only inoculum to account for background methane production. Flush the headspace of all bottles with an N₂/CO₂ gas mixture to ensure anaerobic conditions.
3. Biogas Monitoring and Analysis:
- Duration: The experiment runs until daily biogas production is negligible (typically 30-50 days).
- Measurement: Periodically measure biogas production volume by water displacement or using a pressure transducer. Analyze the biogas composition (CH₄ and CO₂ content) using GC [13].
4. Energy Balance Calculation:
- Energy Input (E_in): Sum of the electrical energy for: (a) pretreatment (heating and mixing), (b) maintaining digester temperature, and (c) mixing during the digestion process.
- Energy Output (E_out): Calculated from the total volume of methane produced and its HHV (~35.8 MJ/m³).
- Net Energy Gain: Enet = Eout - Ein. The EROI is Eout / E_in. The energy required for post-digestion effluent handling and biogas upgrading (if applicable) should be considered in a full-scale assessment [13].
The Researcher's Toolkit: Essential Reagents and Materials
Table 3: Key Research Reagent Solutions for Conversion Studies
| Reagent/Material | Function in Research | Application Context |
|---|---|---|
| Cellulase & Hemicellulase Enzymes | Catalyze the hydrolysis of cellulose and hemicellulose into fermentable sugars (e.g., glucose, xylose) [18]. | Critical for enzymatic saccharification pretreatment in biochemical ethanol production pathways. |
| Anaerobic Digestion Inoculum | A consortium of microorganisms (bacteria, archaea) that digest organic matter to produce biogas (CH₄/CO₂) [13]. | Sourced from operational anaerobic digesters; used to initiate and maintain fermentation in BMP assays and bioreactors. |
| Zeolite Catalysts (e.g., ZSM-5) | Acidic catalysts used to upgrade pyrolysis vapors, deoxygenating bio-oil and improving its stability and heating value [11] [24]. | Used in catalytic fast pyrolysis (thermochemical) to reduce bio-oil oxygen content and crack large molecules. |
| Nickel-Based Catalysts | Promote tar reforming and water-gas shift reactions during gasification, increasing H₂ yield in the syngas [24]. | Used in catalytic gasification (thermochemical) to improve gas quality and conversion efficiency. |
| Lignocellulosic Model Compounds | Pure compounds (e.g., cellulose, xylan, lignin) used to study reaction mechanisms and kinetics without feedstock complexity [11]. | Used in fundamental research to deconvolute the complex degradation pathways of real biomass. |
Advanced Analysis and Visualization of Energy Pathways
The following diagram synthesizes the experimental workflows for energy balance assessment, highlighting the parallel stages of both pathways and the critical points for energy measurement (Ein and Eout).
Diagram: Experimental Workflow for Energy Balance Assessment. Dashed lines indicate the points of energy input (E_in) measurement during conversion and energy output (E_out) calculation from the final products.
The transition from laboratory-scale innovation to full-scale industrial deployment is a critical juncture for biomass conversion technologies. Within the broader thesis comparing biochemical and thermochemical pathways, assessing scalability and commercial readiness provides a pragmatic framework for technology selection and investment. Thermochemical conversion methods, including pyrolysis, gasification, and combustion, use heat and chemical processes to transform biomass into bio-oil, syngas, and biochar [1] [24]. In contrast, biochemical conversion relies on biological agents like enzymes and microorganisms to break down biomass into products such as ethanol and biogas through processes including anaerobic digestion and fermentation [1] [13]. This guide objectively compares the technological maturity, industrial implementation, and performance data of these pathways to inform researchers, scientists, and development professionals in the field of renewable energy and biofuels.
Technology Readiness Levels (TRLs) and Industrial Status
The following table summarizes the comparative Technology Readiness Levels (TRLs) and current industrial deployment status of major thermochemical and biochemical conversion pathways.
Table 1: Technology Readiness and Commercial Deployment Status
| Conversion Pathway | Technology Readiness Level (TRL) | Industrial Implementation Scale | Key Commercial Products | Notable Commercial Projects/Plants |
|---|---|---|---|---|
| Slow Pyrolysis | TRL 8-9 (Commercial) | Commercial scale worldwide [24] | Biochar (soil amendment, activated carbon precursor) [24] | Multiple commercial plants for biochar production [24] |
| Fast Pyrolysis | TRL 7-8 (Demonstration to Commercial) | Demonstration & early commercial [24] | Bio-oil (fuel, chemical precursor) [11] | Several demonstration plants operational [11] [24] |
| Biomass Gasification | TRL 8-9 (Commercial) | Commercial scale for power/heat [24] | Syngas (power, heat, biofuels) [24] | Integrated gasification-combustion plants (e.g., 30 t/h system for food industrial park [24]) |
| Hydrothermal Liquefaction | TRL 5-7 (Pilot to Demonstration) | Pilot and demonstration scale [18] | Biocrude (upgraded to biofuels) [18] | Limited demonstration facilities [18] |
| Anaerobic Digestion | TRL 9 (Fully Commercial) | Widespread commercial deployment [13] | Biogas (heat, power, upgraded to RNG) [13] | Thousands of operational plants worldwide for agricultural and municipal waste [13] |
| Fermentation (2G Ethanol) | TRL 8 (Early Commercial) | First commercial plants [18] | Cellulosic Ethanol [18] | Several commercial-scale biorefineries (e.g., in EU, US, Brazil) [18] |
Performance Comparison and Experimental Data
Conversion Efficiency and Product Yields
Experimental data from process optimization reveals significant differences in conversion efficiencies and primary product yields between thermochemical and biochemical pathways.
Table 2: Comparative Conversion Performance Metrics
| Conversion Process | Key Operational Parameters | Typical Conversion Time | Primary Product Yield | Product Characteristics/Quality |
|---|---|---|---|---|
| Fast Pyrolysis | ~500°C, short vapor residence time (~1-2 s) [24] | 3-5 seconds [18] | Bio-oil: up to 67.9 wt% from refuse-derived fuel [5] | Bio-oil: requires catalytic upgrading for fuel use [11] [24] |
| Slow Pyrolysis | ~400°C, longer residence time (30 min - several hours) [24] | 30-180 minutes [18] | Biochar: 25-35 wt%; Bio-oil: 30-50 wt% [24] | Biochar: high carbon content, used for soil amendment [24] [6] |
| Gasification | 700-900°C, oxidizing agent (air, O₂, steam) [24] | Seconds to minutes (continuous process) | Syngas with heating values up to 10.9 MJ/m³ [5] | H₂/CO ratio adjustable via steam addition and process parameters [24] |
| Hydrothermal Liquefaction | 280-370°C, 10-25 MPa pressure [18] | ~90 minutes [18] | Biocrude: 30-60 wt% depending on feedstock [18] | Biocrude: lower oxygen content than pyrolysis oil, requires upgrading [18] |
| Anaerobic Digestion | Mesophilic (35-40°C) or thermophilic (50-60°C) [13] | 15-30 days (hydraulic retention time) [13] | Biogas: 0.2-0.5 m³/kg VS; ~50-75% CH₄ [13] | Biogas: requires upgrading to biomethane (>95% CH₄) for pipeline injection [13] |
| Fermentation (Lignocellulosic) | ~30-37°C, pH 4.8-5.0, separate hydrolysis and fermentation or consolidated bioprocessing [18] | 48-96 hours (fermentation time) | Ethanol: 60-80% theoretical yield post-enzymatic hydrolysis [18] | Ethanol: requires distillation and dehydration to fuel grade [18] |
Economic and Environmental Performance Metrics
Techno-economic analysis and life cycle assessment provide critical data for comparing the commercial viability and sustainability of conversion pathways.
Table 3: Economic and Environmental Performance Indicators
| Performance Metric | Thermochemical Pathways | Biochemical Pathways |
|---|---|---|
| Capital Investment | Higher initial investment [24] [13] | Generally lower capital costs [13] |
| Feedstock Flexibility | High - can process diverse feedstocks including mixed wastes [24] [5] | Lower - requires specific substrates; sensitive to contaminants [13] |
| Energy Return on Investment (EROI) | >10 targeted for advanced gasification systems [86] | Variable; generally lower than thermochemical options [1] |
| Process Energy Requirements | High temperatures (400-900°C) demand significant energy input [24] [13] | Moderate temperatures (30-60°C) but long processing times [13] |
| Carbon Emission Reduction | 86% GHG reduction potential for biofuels [18] | Comparable reduction potential with optimized systems [18] |
| Technology Learning Rate | Rapid advancement in catalytic systems and reactor design [11] [24] | Steady improvements in enzyme efficiency and fermentation organisms [18] |
| By-product Valorization | Multiple streams (biochar, syngas, bio-oil) [24] | Limited by-products (digestate, CO₂ streams) [13] |
Experimental Protocols and Methodologies
Thermochemical Conversion Experimental Protocol
4.1.1 Biomass Fast Pyrolysis for Bio-oil Production
Objective: To determine bio-oil yield and quality from lignocellulosic biomass via fast pyrolysis.
Materials and Equipment:
- Feedstock Preparation: Biomass grinder/size reducer (<2 mm particle size)
- Reactor System: Fluidized bed reactor with inert gas (N₂) supply
- Temperature Control: High-precision thermocouples and controllers
- Collection System: Condensation train with ice-cooled condensers
- Analytical Instruments: GC-MS for bio-oil composition, calorimeter for heating value
Methodology:
- Feedstock Preparation: Reduce biomass to 1-2 mm particle size using a laboratory grinder. Dry at 105°C for 24 hours to achieve moisture content <10%.
- Reactor Setup: Heat fluidized bed reactor to 500°C under N₂ atmosphere with flow rate of 5 L/min.
- Feeding System: Introduce biomass at feed rate of 100 g/h using screw feeder.
- Vapor Processing: Maintain vapor residence time of 1-2 seconds using controlled N₂ flow.
- Product Collection: Condense vapors in series of condensers maintained at 0-4°C. Collect non-condensable gases in gas bags for analysis.
- Product Analysis:
- Weigh condensed bio-oil and solid char residues
- Analyze bio-oil composition by GC-MS
- Determine higher heating value using bomb calorimeter
- Quantify gas composition by GC-TCD
Data Analysis: Calculate mass balances and product yields based on feedstock input. Optimize parameters (temperature, residence time) to maximize bio-oil yield (target: >60 wt%) [11] [24].
Biochemical Conversion Experimental Protocol
4.2.1 Anaerobic Digestion of Agricultural Waste
Objective: To evaluate biogas production potential from agricultural residues.
Materials and Equipment:
- Inoculum: Anaerobic sludge from operational digester
- Substrates: Agricultural residues (e.g., wheat straw, corn stover)
- Reactor Systems: Serum bottles (500 mL) or bench-scale bioreactors
- Anaerobic Chamber: For oxygen-free environment maintenance
- Gas Collection: Gas bags or inverted water-displacement systems
- Analytical Instruments: HPLC for VFA analysis, GC-TCD for biogas composition
Methodology:
- Substrate Preparation: Mill substrates to 1-2 mm size. Determine total solids (TS) and volatile solids (VS) content.
- Inoculum Acclimation: Acclimate anaerobic inoculum to substrate over 2-3 feeding cycles.
- Experimental Setup: Add substrate and inoculum to reactors at substrate-to-inoculum ratio of 1-2 (based on VS). Maintain total volume of 400 mL in 500 mL reactors.
- Process Conditions: Flush headspace with N₂/CO₂ mixture (70:30) to ensure anaerobic conditions. Incubate at 35±1°C (mesophilic) with continuous mixing.
- Monitoring:
- Measure daily biogas production by water displacement method
- Sample biogas periodically for CH₄ and CO₂ composition via GC-TCD
- Monitor pH and volatile fatty acids (VFAs) weekly via HPLC
- Termination: Continue operation until daily biogas production falls below 1% of cumulative production.
Data Analysis: Calculate cumulative biogas and methane yields normalized to VS added. Determine kinetic parameters using modified Gompertz equation. Target methane yield: 0.25-0.45 L CH₄/g VS added depending on substrate [13].
Process Visualization and Workflows
Diagram 1: Comparative biomass conversion pathways.
Research Reagent Solutions and Essential Materials
Table 4: Essential Research Reagents and Materials for Conversion Studies
| Reagent/Material | Function/Application | Specification Notes |
|---|---|---|
| Zeolite Catalysts (ZSM-5) | Bio-oil catalytic upgrading during pyrolysis [11] | SiO₂/Al₂O₃ ratio: 23-80; enhances deoxygenation |
| Nickel-Based Catalysts | Tar reforming in gasification; methanation [24] | 15-20% Ni on Al₂O₃ support; promotes C-C bond cleavage |
| Cellulase Enzymes | Hydrolysis of cellulose to glucose in biochemical conversion [18] | Trichoderma reesei derived; activity: ≥100 U/mg |
| Methanogenic Inoculum | Anaerobic digestion startup and optimization [13] | Acclimated anaerobic sludge; volatile solids: 3-5% |
| Lignocellulosic Model Compounds | Process mechanism studies [24] | Cellulose (Avicel), xylan (hemicellulose), organosolv lignin |
| Fluidizable Bed Material | Heat transfer medium in fluidized bed reactors [24] | Silica sand; particle size: 200-500 μm |
| Anaerobic Culture Media | Nutrient supply for fermentation/anaerobic digestion [13] | Defined media with macro/micronutrients, vitamins, buffers |
The comparative analysis of scalability and commercial deployment reveals distinct trajectories for thermochemical and biochemical conversion pathways. Thermochemical processes generally demonstrate higher technology readiness levels for power and heat applications, with pyrolysis and gasification reaching TRL 7-9 and offering greater feedstock flexibility and faster conversion times [24]. These processes are advancing through innovations in catalytic systems and reactor designs, with emerging technologies like chemical looping gasification showing potential for >35% decrease in levelized cost of energy [86]. Conversely, biochemical conversion pathways, particularly anaerobic digestion, have achieved full commercial maturity (TRL 9) for waste treatment and biogas production, while advanced fermentation for cellulosic ethanol remains at early commercial stages (TRL 8) [18] [13]. The ongoing integration of artificial intelligence for process optimization and the development of multifunctional catalysts represent critical frontiers for both pathways to enhance efficiency, reduce costs, and improve product yields in commercial-scale operations [11] [6].
Conclusion
The comparative analysis reveals that biochemical and thermochemical conversion pathways offer complementary rather than competing approaches to biomass valorization, with selection criteria heavily dependent on feedstock properties, desired products, and sustainability goals. Thermochemical methods generally provide faster processing speeds and higher energy density products, while biochemical routes often achieve superior specificity for chemical production and lower energy input requirements. Future advancements will depend on integrated biorefinery approaches that synergistically combine both pathways, alongside innovations in catalyst design, genetic engineering of microbial systems, and AI-driven process optimization. The successful scale-up of these technologies will be crucial for achieving carbon neutrality targets and establishing a sustainable circular bioeconomy, with ongoing research needed to address persistent challenges in feedstock preprocessing, process intensification, and economic viability at commercial scales.
References
- 1. What Is the Difference between Biochemical and ... [https://energy.sustainability-directory.com/learn/what-is-the-difference-between-biochemical-and-thermochemical-biofuel-conversion-pathways/]
- 2. Biorefinery Market Size to Worth USD 468.51 Billion by 2034 [https://www.globenewswire.com/news-release/2025/09/26/3156859/0/en/Biorefinery-Market-Size-to-Worth-USD-468-51-Billion-by-2034.html]
- 3. A $116.6 Billion Market by 2030 - Biomass Conversion ... [https://www.businesswire.com/news/home/20251121409427/en/Biomass-Power-Generation-Strategic-Business-Report-2025-A-%24116.6-Billion-Market-by-2030---Biomass-Conversion-Innovations-Expedite-Transition-towards-Greener-Future---ResearchAndMarkets.com]
- 4. Thermochemical conversion of lignocellulosic biomass for ... [http://ui.adsabs.harvard.edu/abs/2025BioCB..1518187T/abstract]
- 5. Thermochemical conversion of waste into energy: a review [https://link.springer.com/article/10.1007/s10311-025-01889-6]
- 6. Enhancing the agricultural circular system through ... [https://www.the-innovation.org/article/doi/10.59717/j.xinn-energy.2025.100121]
- 7. An Economic and Environmental Comparison of a ... [https://research-hub.nrel.gov/en/publications/economic-and-environmental-comparison-of-a-biochemical-and-a-ther]
- 8. Bio-Chemicals 2025 [https://www.spglobal.com/commodity-insights/en/news-research/special-reports/chemicals/bio-chemicals-2025]
- 9. Exploring Sustainable energy: An overview of biochemical ... [https://www.sciencedirect.com/science/article/pii/S2950305124000147]
- 10. Microbial Biotechnology as a Catalyst for a Better and More ... [https://pmc.ncbi.nlm.nih.gov/articles/PMC12256685/]
- 11. Recent advances in biomass valorization through ... [https://pubs.rsc.org/en/content/articlehtml/2025/ra/d5ra05770a?page=search]
- 12. Architecture, catalysis and regulation of methylthio-alkane ... [https://www.nature.com/articles/s41929-025-01425-3]
- 13. Thermochemical and biochemical conversion of ... [https://link.springer.com/article/10.1007/s44274-024-00171-w]
- 14. Catalytic and biological degradation of poly- and ... [https://link.springer.com/article/10.1007/s44344-025-00020-9]
- 15. Thermocatalytic pyrolysis of low-value waste biomass [https://www.sciencedirect.com/science/article/pii/S2590123025002968]
- 16. Catalytic mechanism and differential alarmone regulation ... [https://www.sciencedirect.com/science/article/abs/pii/S0969212625003995]
- 17. Impact of feedstock quality and variation on biochemical ... [https://www.sciencedirect.com/science/article/abs/pii/S1364032116302945]
- 18. A comprehensive review on thermochemical, and ... [https://www.sciencedirect.com/science/article/abs/pii/S0016236123004039]
- 19. The NREL biochemical and thermochemical ethanol ... [https://bioresources.cnr.ncsu.edu/resources/the-nrel-biochemical-and-thermochemical-ethanol-conversion-processes-financial-and-environmental-analysis-comparison/]
- 20. Comparative life cycle assessment of lignocellulosic ... [https://asu.elsevierpure.com/en/publications/comparative-life-cycle-assessment-of-lignocellulosic-ethanol-prod]
- 21. A review on waste biomass-to-energy - RSC Publishing [https://pubs.rsc.org/en/content/articlehtml/2024/va/d4va00109e]
- 22. Bio-Feedstock Market Outlook (2025 to 2035) [https://advancedbiofuelsusa.info/bio-feedstock-market-outlook-2025-to-2035]
- 23. Bio-Feedstock Market Share and Industry Statistics - 2035 [https://www.factmr.com/report/bio-feedstock-market]
- 24. Advances and challenges in biomass thermochemical ... [https://www.sciencedirect.com/science/article/abs/pii/S1364032125010585]
- 25. Comparative study of thermochemical versus biological ... [https://eureka.patsnap.com/report-comparative-study-of-thermochemical-versus-biological-biomass-upgrading]
- 26. Life-cycle assessment of three biorefinery pathways across ... [https://www.nature.com/articles/s41598-025-96474-w]
- 27. Recent technological advancements in biomass ... [https://www.sciencedirect.com/science/article/abs/pii/S0960148125003763]
- 28. Higher anaerobic digester performance by the strategical ... [https://journals.plos.org/plosone/article?id=10.1371/journal.pone.0332972]
- 29. Syngas-Driven Valorisation of Anaerobic-Digestion ... [https://pmc.ncbi.nlm.nih.gov/articles/PMC12383186/]
- 30. Exploring the Potential of Syngas Fermentation for ... [https://link.springer.com/article/10.1007/s40726-024-00337-3]
- 31. Effect of different parameters on biogas production during ... [https://www.sciencedirect.com/science/article/abs/pii/S0960148125002824]
- 32. Comparative analysis of syngas production from 11 ... [https://www.sciencedirect.com/science/article/abs/pii/S036031992501688X]
- 33. Fermenter Market Projected to Reach $980.63 Million ... [https://www.wkinformation.com/market-reports/fermenter-market/]
- 34. Bioprocess Fermentation Monitoring Market [https://www.futuremarketinsights.com/reports/bioprocess-fermentation-monitoring-market]
- 35. Assessment of waste-to-energy conversion technologies ... [https://www.sciencedirect.com/science/article/pii/S3050745625000203]
- 36. Experimental investigation on hydrothermal liquefaction of ... [https://www.sciencedirect.com/science/article/abs/pii/S2451904925003944]
- 37. Promising products based on hydrothermal liquefaction of ... [https://link.springer.com/article/10.1007/s42452-025-06898-2]
- 38. Hydrothermal liquefaction: A promising technology for ... [https://www.sciencedirect.com/science/article/pii/S0961953425005628]
- 39. Exploring biomass pyrolysis for sustainable hydrogen-rich ... [https://www.sciencedirect.com/science/article/abs/pii/S0961953425005732]
- 40. Utilizing machine learning in predicting yields of products in ... [https://bioresourcesbioprocessing.springeropen.com/articles/10.1186/s40643-025-00956-8]
- 41. Biomass for thermochemical conversion: targets and ... [https://pmc.ncbi.nlm.nih.gov/articles/PMC3697057/]
- 42. New AI Framework Boosts Renewable Syngas Production ... [https://www.newswise.com/articles/new-ai-framework-boosts-renewable-syngas-production-efficiency]
- 43. Comprehensive study of thermochemical conversion ... [https://www.sciencedirect.com/science/article/abs/pii/S0165237024002493]
- 44. Review on Biochar Upgrading Methods for Its Application ... [https://www.mdpi.com/2071-1050/17/22/10194]
- 45. Conversion of methane into value-added products in ... [https://www.sciencedirect.com/science/article/abs/pii/S0378775325019196]
- 46. Integrated Biorefineries Mission [https://mission-innovation.net/missions/integrated-biorefineries-mission/]
- 47. sciencedirect.com/topics/engineering/ biochemical - conversion [https://www.sciencedirect.com/topics/engineering/biochemical-conversion]
- 48. Advancement of thermochemical conversion and the ... [https://www.sciencedirect.com/science/article/abs/pii/S1364032124007421]
- 49. The Biochemistry Behind Biofuels [https://www.numberanalytics.com/blog/biochemistry-behind-biofuels]
- 50. A novel integrated biorefinery for enhancing municipal ... [https://www.sciencedirect.com/science/article/pii/S2589914725000726]
- 51. Biorefinery 2025-2033 Analysis: Trends, Competitor ... [https://www.archivemarketresearch.com/reports/biorefinery-71251]
- 52. Pretreatment technologies for lignocellulosic biomass [https://bioresources.cnr.ncsu.edu/resources/pretreatment-technologies-for-lignocellulosic-biomass-research-progress-mechanisms-and-prospects/]
- 53. Pretreatment technologies for valorisation of lignocellulosic ... [https://www.sciencedirect.com/science/article/abs/pii/S2589014X25003196]
- 54. Lignin's complex role in lignocellulosic biomass ... [https://www.sciencedirect.com/science/article/abs/pii/S1385894724029097]
- 55. Harnessing carbon potential of lignocellulosic biomass ... [https://bioresourcesbioprocessing.springeropen.com/articles/10.1186/s40643-025-00935-z]
- 56. Advances in various pretreatment strategies of ... [https://link.springer.com/article/10.1007/s42452-025-06748-1]
- 57. Advancements in ammonia-based pretreatment: key benefits ... [https://pubs.rsc.org/en/content/articlehtml/2025/su/d5su00070j]
- 58. Evaluating the industrial potential of emerging biomass ... [https://pubs.rsc.org/en/content/articlehtml/2025/se/d5se00519a]
- 59. Unlocking catalytic longevity: a critical review of catalyst ... [https://pubs.rsc.org/en/content/articlehtml/2025/ya/d5ya00015g]
- 60. Recent progress in the catalytic thermochemical ... [https://www.sciencedirect.com/science/article/abs/pii/S1385894722029898]
- 61. Concentrated-solar catalytic methane dry reforming with ... [https://pubmed.ncbi.nlm.nih.gov/41168202/]
- 62. Reversible Thermochemical Routes for Carbon Neutrality [https://www.mdpi.com/2673-7167/5/3/29]
- 63. Method for evaluating the performance of catalytic ... [https://www.nature.com/articles/s41598-022-14789-4]
- 64. Understanding deactivation and reactivation of oxidation ... [https://www.sciencedirect.com/science/article/pii/S0360319925031180]
- 65. CatTestHub: A benchmarking database of experimental ... [https://www.sciencedirect.com/science/article/abs/pii/S0021951724006158]
- 66. Microbial Fermentation Processes of Lactic Acid [https://pmc.ncbi.nlm.nih.gov/articles/PMC10297653/]
- 67. Recent advances in biomass valorization through ... [https://pubs.rsc.org/en/content/articlelanding/2025/ra/d5ra05770a]
- 68. Science of Biological Energy Conversion Research [https://www.nrel.gov/bioenergy/science-of-biological-energy-conversion-research]
- 69. Microbial Process Control in Traditional Fermented Foods [https://www.mdpi.com/2311-5637/11/6/323]
- 70. Editorial: From biomass to bio-energy and bio-chemicals [https://pmc.ncbi.nlm.nih.gov/articles/PMC9650448/]
- 71. Integrated Approach for Biomass Conversion Using ... [https://www.preprints.org/manuscript/202503.1614]
- 72. Preprocessing and Hybrid Biochemical/Thermochemical ... [https://www.frontiersin.org/journals/energy-research/articles/10.3389/fenrg.2018.00074/full]
- 73. Machine learning predictions of thermochemical properties ... [https://www.sciencedirect.com/science/article/pii/S0016236124031491?dgcid=rss_sd_all]
- 74. Critical review of biochemical pathways to transformation ... [https://www.sciencedirect.com/science/article/abs/pii/S0960852423001050]
- 75. Biochemical Processes of Lignocellulosic Biomass ... [https://www.mdpi.com/1996-1073/18/13/3353]
- 76. How enzymatic technology is reinventing materials ... [https://www.weforum.org/stories/2025/07/enzymatic-technology-materials-production-manufacturing/]
- 77. Comparative life cycle assessment of the biochemical and ... [https://www.sciencedirect.com/science/article/pii/S2666789422000162]
- 78. biochemical biomass-to-liquid pathways for sustainable ... [https://www.sciencedirect.com/science/article/abs/pii/S0960852423015432]
- 79. Life cycle assessment of a newly designed thermochemical ... [https://www.sciencedirect.com/science/article/pii/S0360319925031027]
- 80. Life cycle assessment of high value activated carbon ... [https://www.nature.com/articles/s41598-025-16300-1]
- 81. Biological Conversion Pathway | Economic Feasibility for ... [https://www.nrel.gov/bioenergy/co2-utilization-economics/biological-conversion-pathway]
- 82. Second-Generation Biofuels Market Size & Share, Forecast ... [https://www.researchnester.com/reports/second-generation-biofuels-market/4879]
- 83. Advanced Biofuels Market is Anticipated to Expand upto ... [https://www.openpr.com/news/4283647/advanced-biofuels-market-is-anticipated-to-expand-upto-647-25]
- 84. Biomass-to-biohydrogen conversion [https://www.sciencedirect.com/science/article/abs/pii/S096195342500354X]
- 85. Renewable Diesel - Alternative Fuels Data Center [https://afdc.energy.gov/fuels/renewable-diesel]
- 86. The Digest's 2025 Multi-Slide Guide to Renewable Natural ... [https://advancedbiofuelsusa.info/the-digest-s-2025-multi-slide-guide-to-renewable-natural-gas-production-via-chemical-looping-gasification]