BECCS vs Direct Air Capture: A Comparative Analysis of Technological Potential and Scaling Challenges
This article provides a comprehensive comparative analysis of Bioenergy with Carbon Capture and Storage (BECCS) and Direct Air Capture (DAC) as critical negative emission technologies (NETs).
BECCS vs Direct Air Capture: A Comparative Analysis of Technological Potential and Scaling Challenges
Abstract
This article provides a comprehensive comparative analysis of Bioenergy with Carbon Capture and Storage (BECCS) and Direct Air Capture (DAC) as critical negative emission technologies (NETs). Targeting researchers, scientists, and policy analysts, it explores the foundational principles, current methodologies, key challenges, and relative validation of both approaches. The scope includes technological readiness, energy and land requirements, cost trajectories, integration potential, and their respective roles in achieving net-zero targets, offering a data-driven framework for evaluating their deployment potential in climate mitigation portfolios.
Understanding the Core: Foundational Principles of BECCS and Direct Air Capture
Defining Negative Emission Technologies (NETs) and the Net-Zero Imperative
Within the global effort to limit warming to 1.5°C, Net-Zero emissions is an imperative. This necessitates neutralizing residual anthropogenic emissions through the deliberate removal of CO₂ from the atmosphere, achieved via Negative Emission Technologies (NETs). This whitepaper provides a technical overview of NETs, framing the critical comparison between two leading candidates: Bioenergy with Carbon Capture and Storage (BECCS) and Direct Air Capture and Storage (DACS). The evaluation of their comparative potential—encompassing technical maturity, scalability, cost, and lifecycle impacts—forms the core of the referenced thesis.
Core NETs: Technical Mechanisms
Bioenergy with Carbon Capture and Storage (BECCS)
Mechanism: BECCS integrates two sequential processes: (1) the cultivation of biomass, which photosynthetically absorbs atmospheric CO₂, and (2) the conversion of this biomass to energy (e.g., via combustion, gasification, or fermentation) coupled with capture of the resulting concentrated CO₂ stream, followed by geological storage. Key Pathways: The biochemical (e.g., fermentation to bioethanol) and thermochemical (e.g, gasification) pathways are predominant.
Direct Air Capture and Storage (DACS)
Mechanism: DACS employs engineered chemical systems to adsorb or absorb CO₂ directly from ambient air (~415 ppm). Two primary approaches exist: (1) Solid Sorbent (Temperature-Swing) Systems using amine-functionalized materials, and (2) Liquid Solvent (pH-Swing) Systems using aqueous alkaline solutions or amino acids. Captured CO₂ is then released via application of heat or vacuum, purified, and compressed for storage.
Other NETs
Additional NETs include enhanced weathering, ocean alkalinity enhancement, and afforestation/reforestation, though they are not the primary focus of this comparative analysis.
Table 1: Comparative Technical and Economic Parameters for BECCS and DACS (Current Estimates)
| Parameter | BECCS (Bioethanol w/CCS) | DACS (Liquid Solvent) | DACS (Solid Sorbent) | Source/Notes |
|---|---|---|---|---|
| Technology Readiness Level (TRL) | 7-9 (Commercial in some sectors) | 6-8 (First commercial plants) | 6-8 (First commercial plants) | IEA, 2023 |
| Theoretical Global Potential (GtCO₂/yr) | ~5 - 11 | 5 - 40+ | 5 - 40+ | IPCC AR6, 2022 |
| Current Cost (USD/tCO₂ removed) | $50 - $200 | $250 - $600 | $150 - $400 | NASEM, 2022; Industry Reports 2024 |
| Energy Requirement (GJ/tCO₂) | 2 - 6 (for capture) | 5 - 12 (thermal & electrical) | 4 - 10 (primarily thermal) | Smith et al., 2023 |
| Land Use (m²/yr/tCO₂) | 1,000 - 10,000 | ~0.1 - 1 | ~0.1 - 1 | Fuss et al., 2018; Updated 2023 |
| Water Use (tH₂O/tCO₂) | 1 - 100 (for biomass) | 1 - 10 (for solvent/sorbent) | 0.5 - 5 | Recent LCAs 2023-2024 |
| Primary Challenges | Land competition, sustainability of biomass, leakage | High energy/cost, plant siting & integration | Sorbent degradation, cost, integration | Literature Synthesis |
Experimental Protocols for Core Analyses
Protocol: Life Cycle Assessment (LCA) for NETs
A standardized LCA (ISO 14040/44) is critical for comparing net removal efficiency.
- Goal & Scope Definition: Define functional unit (e.g., 1 tonne of CO₂ removed from atmosphere and durably stored). Establish system boundaries (cradle-to-grave).
- Inventory Analysis (LCI):
- BECCS: Collect data on biomass cultivation (fertilizer, fuel, land-use change), transport, conversion process efficiency, capture rate (typically 90-95%), compression, transport, and injection.
- DACS: Collect data on sorbent/solvent production, DAC plant construction, operational energy (source matters: renewable vs. grid), CO₂ desorption energy, compression, transport, and injection.
- Impact Assessment (LCIA): Calculate net CO₂ removal: Gross Removal – Lifecycle Emissions. Assess other impacts (eutrophication, acidification, energy demand).
- Interpretation: Conduct sensitivity analysis on key parameters (biomass yield, energy source, capture rate).
Protocol: Sorbent/Solvent Performance Testing (DACS)
This protocol evaluates candidate materials for DACS.
- Material Synthesis: Prepare solid sorbent (e.g., amine-grafted silica) or liquid solvent (e.g., 5M KOH or amino acid solution).
- Adsorption/Aborption Test:
- Use a controlled atmospheric chamber or gas flow system with 410-420 ppm CO₂ in air.
- For solids, use a fixed-bed reactor. Monitor breakthrough curve via NDIR CO₂ analyzer.
- For liquids, use a bubble column or packed tower. Measure CO₂ uptake via pH change, titration, or weight gain.
- Record conditions: temperature (20-30°C), relative humidity (40-80%), gas flow rate.
- Desorption/Regeneration Test:
- Apply temperature swing (80-120°C for solids, 80-100°C for liquids) or pressure/vacuum swing.
- Measure CO₂ purity and concentration in output stream.
- Record energy input (J/g CO₂) precisely via calorimetry.
- Cycling Stability Test: Repeat adsorption-desorption cycles (1000+ cycles). Measure capacity degradation over time.
Protocol: BECCS System Integration Pilot
A protocol for pilot-scale evaluation of integrated BECCS.
- Feedstock Preparation: Use a standardized biomass (e.g., Miscanthus, forestry residues). Characterize moisture, ash, and energy content.
- Conversion & Capture:
- For biochemical route: Ferment biomass to ethanol, recover CO₂ from fermentation off-gas (nearly pure), purify and compress.
- For thermochemical route: Gasify biomass, condition syngas, use amine scrubbing (e.g., 30 wt% MEA) to capture CO₂ from shifted syngas (~20-40% CO₂ concentration).
- Measurement & Monitoring: Continuously measure:
- Inputs: Biomass mass flow, energy inputs.
- Outputs: Bioenergy product (e.g., ethanol, electricity), captured CO₂ mass flow and purity.
- Key Metrics: Capture rate (%), net energy balance, net carbon balance via real-time carbon accounting.
Research Reagent Solutions Toolkit
Table 2: Essential Research Materials for NETs Experiments
| Item / Reagent | Function / Application | Example / Specification |
|---|---|---|
| Amine-functionalized Sorbent | Solid adsorbent for DAC; selectively binds CO₂ from air. | PEI-impregnated mesoporous silica (e.g., SBA-15); Class 3 aminosilica. |
| Aqueous Alkaline Solvent | Liquid absorbent for DAC; chemically reacts with CO₂. | Potassium hydroxide (KOH, 3-5M) or sodium hydroxide (NaOH) solutions. |
| Calcium Oxide (CaO) | Sorbent for high-temperature loops or mineralization studies. | High-purity (>95%) for enhanced weathering or calcium looping experiments. |
| Monoethanolamine (MEA) Solution | Benchmark solvent for post-combustion CO₂ capture (relevant to BECCS). | 30 wt% aqueous MEA for absorption column tests. |
| NDIR CO₂ Analyzer | Critical for real-time, precise measurement of CO₂ concentration in gas streams. | Must have low-range capability (0-2000 ppm) and high-range (0-100%) for different process points. |
| Gas Chromatograph (GC) | For analyzing gas composition (e.g., syngas from gasification, purity of captured CO₂). | Equipped with TCD and FID detectors, Hayesep and Molsieve columns. |
| pH/Conductivity Meter | For monitoring liquid solvent state during absorption/desorption cycles. | High-precision, temperature-compensated probe for corrosive solutions. |
| TGA-DSC (Thermogravimetric Analyzer) | For measuring sorbent CO₂ capacity, regeneration energy, and cycling stability. | Controlled atmosphere (N₂, air, CO₂), temperature ramp capabilities. |
| Certified Gas Standards | For calibrating analyzers and creating synthetic atmospheres. | 410 ppm CO₂ in air (for DAC simulation), 10-30% CO₂ in N₂ (for BECCS simulation). |
| LCA Software & Databases | For performing lifecycle inventory and impact assessment. | SimaPro, GaBi, or openLCA with updated databases (Ecoinvent, USLCI). |
Within the comparative assessment of negative emissions technologies (NETs), Bioenergy with Carbon Capture and Storage (BECCS) presents a unique dual-function engine. It integrates the natural, short-term carbon cycle of biomass growth with engineered, permanent carbon sequestration. This positions BECCS distinctly from Direct Air Capture (DAC), which interacts directly with the well-mixed, dilute atmospheric CO₂ reservoir. The thesis of a comparative potential research must evaluate BECCS not merely as a carbon removal tool, but as a biomass-carbon cycle engine where biomass acts as the concentrating agent, fundamentally altering the thermodynamic and economic boundaries compared to DAC.
The Core Technical Principle: The Two-Stage Engine
The BECCS process functions as a two-stage engine:
- Biomass-Driven Concentration (Biological Stage): Photosynthesis captures diffuse atmospheric CO₂ (~420 ppm) and concentrates carbon into solid or liquid biomass feedstock.
- Point-Source Capture & Sequestration (Engineering Stage): The biomass is processed (combusted, gasified, fermented), releasing a high-concentration CO₂ stream (>10%) suitable for efficient capture and subsequent geological storage.
This contrasts with DAC, which must energetically process the entire atmospheric volume to isolate CO₂, facing a significantly lower initial partial pressure.
Quantitative System Performance Data
Table 1: Comparative Performance Metrics of BECCS Pathways vs. Baseline DAC
| Metric | Biomass Combustion + Post-Combustion Capture | Biomass Gasification + Pre-Combustion Capture | Biochemical Conversion (e.g., Ethanol) + Capture | Solid Sorbent DAC (for reference) |
|---|---|---|---|---|
| CO₂ Concentration in Flue Gas | 8-15% | ~40% (in syngas, pre-shift) | ~99% (fermentation off-gas) | 0.04% (ambient air) |
| Typical Capture Efficiency | 85-95% | >95% | >99% | 75-90% |
| Net Removal Efficiency (Lifecycle)* | 70-90% | 75-95% | 60-85%* | 85-95% |
| Energy Penalty (% of plant output) | 15-25% | 10-20% | 5-15% | 200-400% (of thermal eq.) |
| Estimated Cost per tonne CO₂ removed (current) | $100-$200 | $80-$180 | $120-$250 | $250-$600 |
| Key Technology Readiness Level (TRL) | 7-9 (commercial) | 6-8 (demonstration) | 6-8 (demonstration) | 5-7 (pilot/demo) |
*Net Removal Efficiency accounts for supply chain emissions. For biochemical pathways, it is highly sensitive to feedstock and process design.
Experimental Protocol: Quantifying Carbon Balance in a BECCS Value Chain
Title: Protocol for Lifecycle Carbon Balance Analysis of a Dedicated Energy Crop BECCS System.
Objective: To empirically determine the net carbon removal of a BECCS system using Miscanthus via combustion with amine-based capture.
Methodology:
- Field Trial & Carbon Uptake Measurement:
- Establish a 1-hectare plot of Miscanthus x giganteus.
- Annually, at harvest, measure above-ground biomass dry matter yield via destructive sampling in five 4m² subplots.
- Determine carbon content (default ~48%) using a CHNS elemental analyzer (e.g., EuroVector EA3000). Calculate total carbon captured: C_biomass = Biomass Yield × Carbon Fraction.
Supply Chain Emission Audit (Inputs):
- Quantify all fossil fuel inputs for cultivation (diesel), harvesting, and transport (distance to conversion facility).
- Quantify fertilizer (N, P, K) application; model N₂O emissions using IPCC Tier 1 or Tier 2 methodology.
- Convert all inputs to CO₂-equivalent emissions (C_supply_chain) using relevant emission factors.
Conversion & Capture Efficiency Experiment:
- Process a representative biomass sample in a pilot-scale fluidized bed combustor coupled with a 0.1 MWth amine scrubbing unit (e.g., 30 wt% MEA solution).
- Continuously monitor inlet and outlet flue gas CO₂ concentrations (using NDIR analyzer) for >100 operational hours.
- Calculate capture efficiency (ηcapture) = (CO₂in - CO₂out) / CO₂in.
- Measure parasitic energy load of the capture process.
Carbon Storage Assurance:
- Model the fate of captured, compressed CO₂ using geological simulation software (e.g., TOUGH2) for a target saline aquifer.
- Assume a conservative storage permanence of >99% over 1,000 years based on engineered and natural trapping mechanisms.
Net Carbon Calculation:
- Net CO₂ Removed = (C_biomass - C_supply_chain) × η_capture × η_storage.
- Express result in tonnes CO₂e per hectare per year.
Visualization of System Pathways
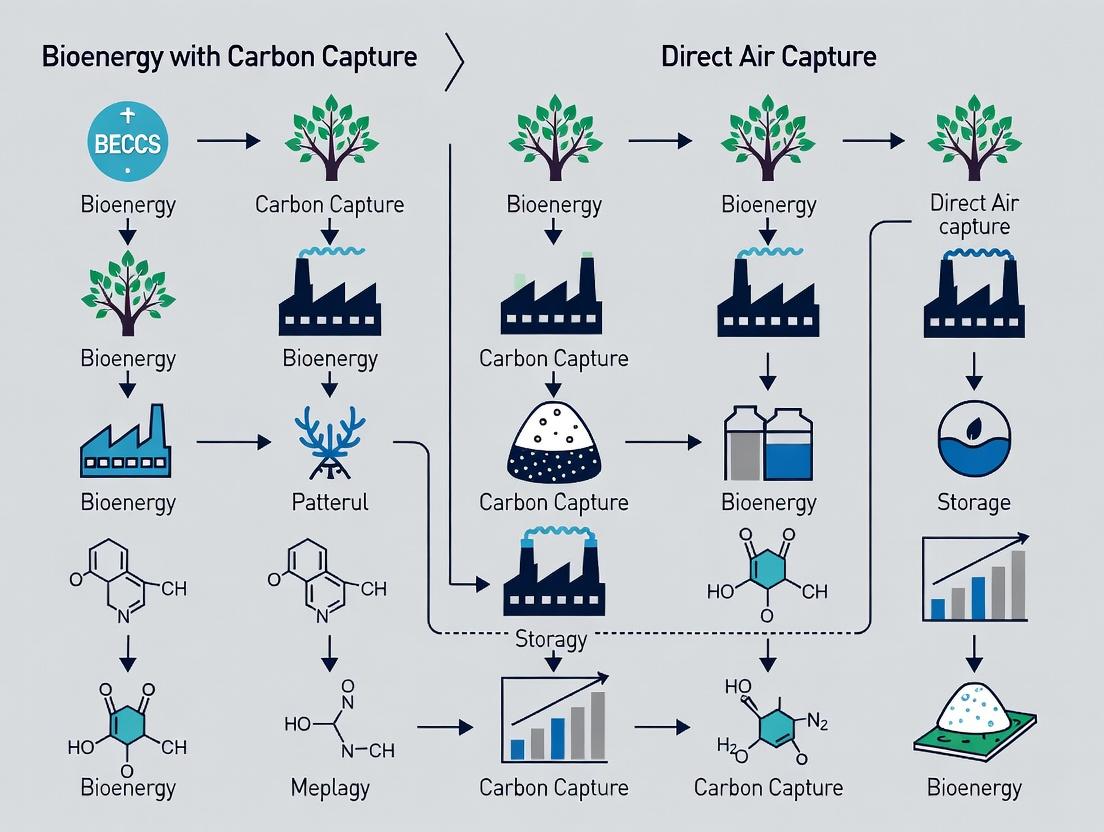
Diagram 1: BECCS vs. DAC: Fundamental Carbon Pathways
Diagram 2: Detailed BECCS Experimental Workflow
The Scientist's Toolkit: Key Research Reagent Solutions
Table 2: Essential Materials for BECCS Laboratory-Scale Research
| Research Reagent / Material | Primary Function in BECCS Research | Technical Notes |
|---|---|---|
| Amine-Based Solvents (e.g., MEA, MDEA, PZ) | Liquid absorbent for post-combustion CO₂ capture from flue gas. | 30 wt% MEA is a benchmark. Research focuses on novel blends/ionic liquids for lower regeneration energy & degradation resistance. |
| Solid Sorbents (e.g., Zeolite 13X, MOFs, Amine-Functionalized Silica) | Solid adsorbent for pressure/temperature swing adsorption (PSA/TSA) processes. | Key parameters: CO₂ capacity, selectivity (over N₂, H₂O), isotherm shape, and cycling stability under realistic conditions. |
| Gas Calibration Standards | Calibration of NDIR, GC, or MS for precise CO₂, CH₄, N₂O, CO, O₂ measurement. | Critical for mass balance closure. Requires certified standards at concentrations matching flue gas (e.g., 10% CO₂ in N₂) and ambient air. |
| Stable Isotope Tracers (¹³CO₂) | Tracing carbon flow through biological (plant uptake) and engineered (capture) systems. | Used in chamber studies to validate photosynthetic incorporation and in capture experiments to track solvent carbon inventory. |
| Lignocellulosic Biomass Reference Materials | Standardized feedstock for comparative conversion and capture experiments. | NIST or other standard reference materials ensure reproducibility in gasification kinetics, ash behavior, and slagging studies. |
| Bench-Scale Fluidized Bed Reactor | Simulating biomass combustion/gasification under controlled conditions. | Enables study of reaction kinetics, ash chemistry, and the production of a representative syngas/flue gas for capture experiments. |
| High-Pressure/Temperature Autoclave | Simulating geological reservoir conditions for CO₂-brine-rock interaction studies. | Used to assess mineral trapping rates and caprock integrity for storage assurance research. |
This whitepaper provides an in-depth technical guide to Direct Air Capture (DAC), a critical negative emissions technology. The analysis is framed within a broader comparative research thesis examining the potential of DAC versus Bioenergy with Carbon Capture and Storage (BECCS). While BECCS leverages the photosynthetic efficiency of biomass, DAC offers a land-sparing, high-purity CO₂ stream suitable for diverse utilization or sequestration pathways. This document details the core principles, current technological state, and experimental protocols for researchers.
Core Principles & Sorbent/Solvent Chemistries
DAC systems extract CO₂ from ambient air (~420 ppm) using cyclic chemical processes. The two dominant approaches are liquid solvent and solid sorbent systems.
Liquid Solvent (Aqueous Alkali) Systems: Employ a concentrated basic solution (e.g., KOH) to absorb CO₂, forming a carbonate. The carbonate is then precipitated (e.g., using calcium) and thermally decomposed to release a pure CO₂ stream, regenerating the solvent. Solid Sorbent (Amino-Functionalized) Systems: Utilize porous solid materials functionalized with amines. CO₂ chemisorbs at ambient conditions. The sorbent is regenerated using temperature-vacuum swing (TVS) processes, releasing concentrated CO₂.
Comparative Performance Data (2023-2024):
Table 1: Performance Metrics of Leading DAC Technologies
| Parameter | Liquid Solvent (e.g., Carbon Engineering) | Solid Sorbent (e.g., Climeworks, Global Thermostat) | Notes |
|---|---|---|---|
| Typical CO₂ Purity | >99% dry | >99% dry | Suitable for geological storage or e-fuels. |
| Energy Requirement (GJ/t CO₂) | 5-8 (Thermal, at ~900°C) | 5-10 (Electrical/Low-grade heat, at 80-120°C) | Highly dependent on heat source & design. |
| Water Consumption (t H₂O / t CO₂) | 1-5 (for cooling & solution management) | 0.5-2 (primarily for humidity management) | Liquid systems generally more water-intensive. |
| Reported Cost (USD/t CO₂) | $250 - $600 (current) | $300 - $800 (current) | Projected to fall to $100-$300 at scale. |
| Major Energy Input | High-grade heat for calcination | Low-grade heat for sorbent regeneration | Integration with renewables/waste heat is key. |
| Technology Readiness Level (TRL) | 8-9 (First commercial plants deployed) | 7-8 (Pilot/early commercial deployment) |
Experimental Protocol: CO₂ Adsorption Capacity of a Novel Solid Sorbent
This protocol details a standard laboratory-scale method for evaluating amine-functionalized mesoporous silica sorbents, a common DAC research focus.
Title: Determination of Equilibrium CO₂ Adsorption Capacity Under DAC-Relevant Conditions.
Objective: To measure the CO₂ adsorption capacity (mmol CO₂/g sorbent) of a candidate solid sorbent at 25°C, 1 atm, and 400 ppm CO₂ in N₂.
Materials & Apparatus:
- Fixed-Bed Reactor: Stainless steel or quartz tube (6 mm ID) equipped with heating jacket.
- Mass Flow Controllers (MFCs): For precise blending of 10% CO₂/N₂ and pure N₂ to simulate air.
- Gas Analyzer: Non-dispersive infrared (NDIR) CO₂ sensor for breakthrough detection.
- Data Acquisition System: To record temperature, pressure, and CO₂ concentration.
- Vacuum Pump: For sorbent pre-treatment.
- Analytical Balance.
Procedure:
- Sorbent Preparation: Precisely weigh ~100 mg of sorbent into the reactor. Secure with quartz wool plugs.
- Pre-treatment: Heat the reactor to 105°C under a continuous N₂ flow (50 mL/min) for 12 hours to remove physisorbed H₂O and CO₂. Cool to 25°C under N₂.
- Adsorption Phase: Switch the inlet gas to the simulated air mixture (400 ppm CO₂ in N₂) at a total flow of 100 mL/min. Maintain 25°C. Monitor effluent CO₂ concentration until breakthrough (C/C₀ = 0.95).
- Desorption/Regeneration: Switch back to pure N₂ flow and initiate a temperature-vacuum swing (e.g., heat to 90-100°C under mild vacuum, ~0.1 bar) for 60 minutes.
- Data Analysis: Integrate the area above the breakthrough curve. Calculate the dynamic adsorption capacity using the formula:
q = (F * ∫(C_in - C_out)dt) / m_sorbentwhere q=capacity (mmol/g), F=total molar flow rate, C=CO₂ concentration, t=time, m=mass.
Diagram 1: Solid Sorbent DAC Experimental Workflow
The Scientist's Toolkit: Key DAC Research Reagents & Materials
Table 2: Essential Research Reagents for DAC Sorbent Development
| Reagent/Material | Function & Rationale |
|---|---|
| 3-Aminopropyltriethoxysilane (APTES) | Common aminosilane used for grafting primary amines onto silica supports via silanization. Provides active sites for CO₂ chemisorption. |
| Polyethylenimine (PEI), branched | High-density amine polymer for impregnating porous supports. Increases CO₂ capacity per gram of sorbent but can affect kinetics. |
| Mesoporous Silica (e.g., SBA-15, MCM-41) | High-surface-area, tunable-pore support material. Provides structure for amine functionalization and minimizes diffusion resistance. |
| Potassium Hydroxide (KOH) pellets | Strong base for liquid solvent systems. Forms K₂CO₃ upon CO₂ absorption. Requires careful handling and corrosion-resistant equipment. |
| Calcium Oxide (CaO) | Used in liquid solvent systems to precipitate carbonate as CaCO₃, which is then calcined to release CO₂ and regenerate CaO. |
| Zeolites (e.g., 13X) | Physical adsorbents for pre-drying air or for selective CO₂ capture in hybrid systems. Useful for studying competitive H₂O adsorption. |
| Simulated Air Mixture | Certified gas cylinder containing 400-420 ppm CO₂ in N₂ or synthetic air. Essential for controlled, reproducible adsorption experiments. |
Diagram 2: Primary CO₂ Chemisorption Pathways on Amines
Comparative Context: DAC vs. BECCS in Research
Within the thesis comparing BECCS and DAC, key differentiators emerge. DAC's primary advantage is its small land footprint and location flexibility, avoiding BECCS's land-use competition. DAC provides a pure, concentrated CO₂ product, whereas BECCS yield is tied to biomass combustion flue gas (3-15% CO₂). However, DAC's significant energy penalty (see Table 1) and current high costs are major research hurdles. The optimal pathway may involve hybrid systems, using biomass-derived energy to power DAC units, potentially improving overall system efficiency and carbon yield per hectare.
Historical Context and Technological Evolution of Both Approaches
This whitepaper provides a technical examination of the historical development and technological evolution of Bioenergy with Carbon Capture and Storage (BECCS) and Direct Air Capture (DAC). Framed within a broader thesis comparing their mitigation potential, this guide details the core engineering principles, key experiments, and material requirements essential for researchers and scientists evaluating these negative emissions technologies.
Historical Context
Bioenergy with Carbon Capture and Storage (BECCS)
The conceptual foundation of BECCS emerged in the early 1990s, combining established technologies from three separate fields: biomass energy conversion (19th century), carbon capture (originally developed for natural gas processing in the 1930s), and geological storage (pioneered in the 1970s for enhanced oil recovery). The first integrated proposal for BECCS as a climate solution was presented by the IPCC in 2005. Its evolution has been driven by the scaling of biomass power generation and adaptations of post-combustion capture systems.
Direct Air Capture (DAC)
The fundamental concept of extracting CO₂ directly from ambient air was first proposed in 1946, with serious technical exploration beginning in the 1990s by researchers like Klaus Lackner. Technological evolution diverged into two main pathways: solid sorbent (temperature-vacuum swing adsorption) and liquid solvent (aqueous hydroxide solution) systems. Significant acceleration in development occurred post-2010, driven by private-sector investment and recognition of the scale of carbon removal required.
Technological Evolution & Core Principles
BECCS Technological Pathways
BECCS integrates biomass supply chains with carbon capture units. Primary technological pathways include:
- Post-combustion capture: Amine-based solvents (e.g., MEA) scrub CO₂ from flue gases after biomass combustion.
- Oxy-fuel combustion: Biomass is burned in pure oxygen, resulting in a flue gas predominantly of CO₂ and water vapor.
- Pre-combustion gasification: Biomass is gasified to produce syngas (H₂ + CO), which is shifted to produce a CO₂ stream before combustion.
DAC Technological Pathways
DAC systems are categorized by their capture media regeneration method:
- Liquid Solvent Systems (Low-Temperature): Use aqueous alkaline solutions (e.g., KOH) to chemically absorb CO₂, requiring a high-temperature (900°C) calcination step to release pure CO₂ and regenerate the solvent.
- Solid Sorbent Systems (High-Temperature): Use amine-functionalized porous materials to adsorb CO₂, regenerated using heat (80-120°C) under vacuum.
Quantitative Data Comparison
Table 1: Historical Development Milestones
| Technology | Decade | Key Milestone | Primary Developer/Proponent |
|---|---|---|---|
| BECCS | 1990s | Conceptual integration of biomass energy with CCS | IPCC, Academic Literature |
| 2000s | First pilot-scale demonstrations (e.g., Illinois) | U.S. Department of Energy | |
| 2010s | First commercial-scale plant (Drax pilot, UK) | Drax Group, Mitsubishi Heavy Industries | |
| 2020s | Focus on sustainable biomass sourcing & system efficiency | Various (Bioenergy Europe, IEA) | |
| DAC | 1990s | Fundamental research on air contactors & sorbents | Klaus Lackner, Columbia University |
| 2000s | First prototype mechanical capture units | Carbon Engineering, Climeworks | |
| 2010s | Commercial deployment of pilot plants (Switzerland, Canada) | Climeworks, Carbon Engineering | |
| 2020s | Scale-up to megaton-capacity projects (e.g., Project Bison, Stratos) | 1PointFive, Occidental Petroleum |
Table 2: Current Technical Performance Parameters (2024)
| Parameter | BECCS (Post-Combustion) | DAC (Liquid Solvent) | DAC (Solid Sorbent) |
|---|---|---|---|
| Typical Plant Capacity (tCO₂/yr) | 1,000,000+ (attached to power) | Designed for 1,000,000+ | 1,000 - 4,000 (modular units) |
| Energy Requirement (GJ/tCO₂) | 1.2 - 2.5 (for capture only) | 5.0 - 8.0 (thermal, low-T DAC) | 5.5 - 9.0 (electrical, high-T DAC) |
| Water Usage (t/tCO₂) | 1 - 3 (for capture & cooling) | 1 - 10 (vapor loss & process) | < 1.5 (primarily for cooling) |
| Estimated Current Cost (USD/tCO₂) | 80 - 200 | 250 - 600 | 500 - 1000 |
| Land Footprint (m²/tCO₂/yr) | Dominated by biomass cultivation | ~0.5 - 1.0 | ~0.1 - 0.3 |
| Technology Readiness Level (TRL) | 8-9 (Commercial demonstration) | 7-8 (First-of-a-kind commercial) | 6-7 (Early commercial deployment) |
Experimental Protocols for Key Evaluations
Protocol: Life Cycle Assessment (LCA) for BECCS
Objective: Quantify net carbon removal and environmental impacts of a BECCS value chain. Methodology:
- System Boundary Definition: Define cradle-to-grave boundary: biomass cultivation/harvest, transport, conversion, CO₂ capture, compression, transport, and permanent geological storage.
- Inventory Analysis: Collect data for all material/energy inputs and emissions (CH₄, N₂O) for each unit process. Use primary data from pilot plants or robust literature.
- Attributional Modeling: Apply allocation methods (e.g., energy-based) for co-products (e.g., electricity).
- Impact Assessment: Calculate Global Warming Potential (GWP) using IPCC factors. Net removal = (Biogenic CO₂ stored) - (Total lifecycle GHG emissions).
- Sensitivity Analysis: Test sensitivity to biomass type, supply distance, capture rate (85-95%), and grid electricity carbon intensity.
Protocol: Sorbent/Solvent Performance & Durability Testing for DAC
Objective: Measure CO₂ capture capacity, kinetics, and degradation over multiple cycles. Methodology:
- Material Characterization: Analyze fresh sorbent/solvent (e.g., amine-supported sorbent, KOH) for surface area, amine loading, and composition.
- Breakthrough Curve Analysis: a. Pack a fixed-bed reactor with sorbent. b. Expose to a simulated air stream (410 ppm CO₂, balance N₂/O₂) at defined T, P, and flow rate. c. Measure CO₂ concentration at outlet via NDIR sensor until saturation. d. Calculate dynamic capacity from integration of the breakthrough curve.
- Cyclic Stability Test: a. Perform repeated adsorption/desorption cycles (e.g., 1000+). b. Adsorption: Expose to humidified 410 ppm CO₂ at 25°C. c. Desorption: Apply temperature/vacuum swing (e.g., 80-120°C, 0.1 bar) for solid sorbents; or heat to 900°C for liquid solvent calcination. d. Monitor capacity retention and material properties (FTIR, TGA) every 100 cycles.
- Degradation Analysis: Quantify losses from oxidation, thermal degradation, or evaporation.
Visualization of Core Processes
The Scientist's Toolkit: Key Research Reagent Solutions
Table 3: Essential Materials for BECCS & DAC Research
| Item | Function/Application | Example/Notes |
|---|---|---|
| Monoethanolamine (MEA) Solution | Benchmark solvent for post-combustion CO₂ capture in BECCS research. Used to establish baseline capture efficiency (85-90%) and energy penalty. | Typically used as 30% w/w aqueous solution. Research focuses on degradation inhibitors and novel amine blends. |
| Potassium Hydroxide (KOH) / Calcium Hydroxide (Ca(OH)₂) | Core chemicals for liquid solvent DAC. KOH captures CO₂ to form K₂CO₃; Ca(OH)₂ recovers KOH and precipitates CaCO₃ for calcination. | High purity required. Handling requires care due to strong corrosivity. Key cost and energy drivers. |
| Amine-Functionalized Solid Sorbents | Porous supports (e.g., silica, alumina, MOFs) grafted with amines (e.g., PEI) for adsorption in solid DAC systems. | Research parameters include pore size, amine loading, and stability under humid, oxidative conditions. |
| NDIR CO₂ Sensor | Critical for measuring low-concentration CO₂ in inlet/outlet streams during breakthrough experiments and process monitoring. | Requires calibration for range (0-2000 ppm) and high sensitivity at atmospheric levels (400 ppm). |
| Thermogravimetric Analyzer (TGA) | Measures sorbent weight change during adsorption/desorption cycles to determine CO₂ capacity and kinetics. | Can be coupled with a mass spectrometer (TGA-MS) to analyze degradation products. |
| Life Cycle Inventory (LCI) Database | Software and datasets (e.g., Ecoinvent, GREET) for modeling environmental impacts of full technology systems. | Essential for calculating net carbon removal and avoiding burden shifting in comparative research. |
Key Players and Current State of Global Demonstration Projects
Within the broader research thesis comparing the potential of Bioenergy with Carbon Capture and Storage (BECCS) and Direct Air Capture (DAC), demonstration projects serve as critical, real-world laboratories. These initiatives, led by a consortium of public entities, private corporations, and research institutes, validate technological viability, inform scale-up protocols, and generate essential techno-economic data. This guide provides a technical dissection of the current global landscape, key methodologies, and research tools essential for professionals evaluating these carbon dioxide removal (CDR) pathways.
Live search data identifies the following leading entities and their flagship demonstration projects as of early 2025.
Table 1: Key Players in BECCS Demonstration
| Organization/Consortium | Project Name & Location | Core Technology Focus | Scale (tCO₂/yr) | Operational Phase |
|---|---|---|---|---|
| Drax / Bioenergy Energy Carbon Capture and Storage (BECCS) | BECCS Pilot, North Yorkshire, UK | Post-combustion capture (amine-based) on biomass power flue gas | 12,000 (target for full-scale) | Pilot operational; Full-scale FEED* |
| Stockholm Exergi | BECCS at Värtan, Stockholm, Sweden | Capture of biogenic CO₂ from CHP plant | Up to 800,000 (planned) | Final Investment Decision 2024 |
| Illinois Sustainable Technology Center (ISTC) | BECCS Field Demo, Illinois, USA | Biomass gasification + CCS | N/A (Research-scale) | R&D / Field Testing |
FEED: Front-End Engineering Design. *CHP: Combined Heat and Power.
Table 2: Key Players in DAC Demonstration
| Organization | Project Name & Location | Core Technology Focus | Scale (tCO₂/yr) | Operational Phase |
|---|---|---|---|---|
| Climeworks / Carbfix | Orca & Mammoth, Hellisheidi, Iceland | Solid Sorbent DAC + subsurface mineralization | 4,000 (Orca); 36,000 (Mammoth target) | Orca operational; Mammoth commissioning |
| Carbon Engineering / 1PointFive | STRATOS, Texas, USA | Liquid Solvent DAC (KOH/CaO loop) | 500,000 (planned) | Under construction |
| Global Thermostat | Multiple Pilot Sites, USA | Solid Sorbent DAC (amine-functionalized monoliths) | 1,000 - 10,000 (pilot range) | Pilot Deployment |
| Heirloom / CarbonCure | Heirloom DAC, Louisiana, USA | Accelerated weathering of calcium oxide | 1,000 (initial module) | Initial module operational |
Experimental Protocols for Technology Validation
Key experiments cited from these projects focus on core process validation and integration.
Protocol 3.1: Solid Sorbent DAC Adsorption-Desorption Cycling Test (Laboratory Scale)
- Objective: To determine the cyclic capacity, kinetics, and degradation profile of a novel amine-impregnated sorbent.
- Materials: Fixed-bed reactor, moisture-controlled flue gas simulator (400 ppm CO₂ in N₂), steam generator, gas analyzers (NDIR for CO₂), thermogravimetric analyzer (TGA).
- Procedure:
- Conditioning: 10g of sorbent is loaded into the fixed-bed reactor and pre-heated to 40°C under N₂ flow.
- Adsorption: A simulated air stream (400 ppm CO₂, 60% RH) is passed through the bed at 2 L/min for 60 minutes. Outlet CO₂ concentration is continuously logged.
- Desorption: The bed is heated to 100-120°C under a low-flow N₂ purge or exposed to low-pressure steam for 30 minutes. Desorbed CO₂ is captured and quantified.
- Cycling: Steps 2-3 are repeated for >1000 cycles.
- Analysis: Sorbent samples are extracted at cycle intervals for TGA (to measure amine loss) and porosity analysis (BET).
Protocol 3.2: BECCS Integration and Stack Emission Lifecycle Analysis (Pilot Plant)
- Objective: To measure net carbon negativity and characterize non-CO₂ emissions from a biomass-fired boiler with integrated capture.
- Materials: Pilot-scale biomass gasifier or boiler, post-combustion capture unit (e.g., amine scrubber), continuous emission monitoring system (CEMS), biomass feedstock of known origin and composition.
- Procedure:
- Baseline: Operate the biomass boiler without capture, measuring flue gas composition (CO₂, CO, NOx, SOx, particulates) and fuel input for 48 hours.
- Integrated Operation: Integrate the capture unit. Operate the full BECCS system at steady state for 72 hours.
- Sampling: Continuously measure: a) Biogenic CO₂ concentration pre- and post-capture; b) Amine solvent emissions (e.g., NH₃, nitrosamines) post-capture; c) All other stack emissions.
- Carbon Accounting: Mass balance is performed using fuel analysis, ash content, and captured CO₂ mass. Net CO₂ removal is calculated as: (Biogenic CO₂ captured) - (Fossil CO₂ emitted from process energy + Supply chain emissions from feedstock).
Visualization of System Workflows
The Scientist's Toolkit: Research Reagent Solutions
Table 3: Essential Materials for CDR Laboratory Research
| Item | Function & Relevance to BECCS/DAC | Example/Supplier |
|---|---|---|
| Amine-based Solvents (e.g., MEA, PZ) | Benchmark liquid absorbents for post-combustion capture; used to establish baseline performance for novel solvents in BECCS flue gas conditions. | Sigma-Aldrich (Monoethanolamine) |
| Functionalized Solid Sorbents | Amine-grafted silica or MOFs for DAC adsorption kinetics and cyclic capacity studies. Critical for evaluating degradation under realistic T/RH cycling. | Immobilized amines on porous silica (e.g., TRI-PE-MCM-41) |
| Gas Calibration Standards | Certified mixtures of CO₂ in N₂ or air (e.g., 400 ppm, 10%) for accurate calibration of NDIR analyzers and GC systems used in capture efficiency calculations. | NIST-traceable standards from Linde or Air Liquide |
| Isotopically Labeled CO₂ (¹³CO₂) | Tracer for studying carbonation kinetics in mineralization storage pathways or for detailed fate analysis in complex process streams. | Cambridge Isotope Laboratories |
| Accelerated Weathering Materials | High-purity, finely ground minerals (e.g., olivine, wollastonite) for testing enhanced weathering as a CO₂ sequestration endpoint linked to DAC or BECCS. | Ward's Science (Geological specimens) |
| Solvent Degradation Analysis Kits | HPLC/MS kits for quantifying amine degradation products (e.g., nitrosamines, heat-stable salts) which impact solvent longevity and environmental emissions. | Custom analytical protocols from NETL/DTI publications |
From Lab to Landscape: Methodologies, Systems, and Real-World Applications
1. Introduction: A Thesis Context Within the comparative assessment of carbon dioxide removal (CDR) technologies, Bioenergy with Carbon Capture and Storage (BECCS) and Direct Air Capture (DAC) represent two high-potential, yet fundamentally divergent pathways. This whitepaper provides a technical deep-dive into BECCS methodologies, serving as a foundational resource for evaluating its system complexities against the more direct, but energy-intensive, DAC approach. The core thesis hinges on comparing BECCS's reliance on biogenic carbon cycles and energy co-production with DAC's point-source capture of atmospheric CO2, with significant implications for scalability, cost, and integration into existing industrial frameworks.
2. Biomass Supply Chain Components & Quantitative Metrics A robust biomass supply chain is the foundational subsystem of BECCS, determining feedstock availability, carbon neutrality, and overall system efficiency. Key components include cultivation, harvesting, preprocessing, and transportation.
Table 1: Comparative Analysis of Primary BECCS Feedstocks
| Feedstock Type | Avg. Dry Yield (ton/ha/yr) | Avg. Energy Content (GJ/ton) | Avg. Biogenic Carbon Content (% dry weight) | Key Preprocessing Requirement |
|---|---|---|---|---|
| Miscanthus | 12-18 | 17-19 | ~48% | Size reduction, drying |
| Switchgrass | 10-15 | 17-18 | ~47% | Size reduction, densification |
| Short-Rotation Coppice (Willow) | 8-12 (odt) | 19-20 | ~49% | Chipping, drying |
| Forest Residues | N/A (byproduct) | 15-18 | ~50% | Sorting, grinding, drying |
| Agricultural Residues (e.g., straw) | 2-5 (byproduct) | 14-16 | ~45% | Collection, baling, drying |
3. Biomass Conversion Technologies with Integrated Capture The conversion stage transforms biomass into energy while producing a separable CO2 stream. Post-combustion capture is the most readily integrable technology.
Table 2: Comparison of Biomass Conversion Technologies for BECCS Integration
| Conversion Technology | Typical Scale | Primary Product | Capture Integration Point | Estimated Capture Rate (%) |
|---|---|---|---|---|
| Pulverized Coal/Biomass Co-firing | 100-1000 MWe | Electricity | Flue gas (Post-combustion) | 85-90% |
| Biomass-Fired Boiler (Bubbling/Circulating Fluidized Bed) | 20-150 MWe | Electricity/Heat | Flue gas (Post-combustion) | 85-95% |
| Biomass Gasification + Combined Cycle (BIGCC) | 10-100 MWe | Electricity | Syngas stream (Pre-combustion) | >90% |
| Biomass-to-Ethanol Fermentation | 50-500 ML/yr | Liquid Fuel | Fermentation off-gas (~99% CO2) | ~100% |
4. Experimental Protocol: Determining Biomass Carbon Fraction A standard method for quantifying the biogenic carbon content of a feedstock, critical for carbon accounting.
Title: Ultimate Analysis for Biomass Carbon Content Objective: To determine the carbon mass fraction in a dry biomass sample. Materials: Analytical balance, elemental analyzer (CHNS/O), tin capsules, crucibles, oven, desiccator. Procedure:
- Sample Preparation: Mill biomass to <0.2 mm. Dry at 105°C for 24 hours. Store in desiccator.
- Weighing: Precisely weigh 2-3 mg of homogenized dry sample into a tin capsule.
- Combustion: Load capsule into the elemental analyzer autosampler. The sample is combusted at ~1800°C in a pure oxygen environment.
- Separation & Detection: Resultant gases (CO2, N2, H2O, SO2) are separated via gas chromatography. CO2 is detected by a thermal conductivity detector (TCD).
- Calculation: The analyzer software calculates the mass percentage of carbon based on the detected CO2 relative to the sample weight, using calibration curves from standard compounds.
5. Storage Integration: Transport and Geological Sequestration Captured CO2 must be compressed, transported (typically via pipeline), and injected into suitable geological formations.
Table 3: Geological Storage Site Characterization Criteria
| Formation Type | Example Reservoirs | Estimated Global Capacity (Gt CO2) | Key Monitoring Parameter |
|---|---|---|---|
| Deep Saline Aquifers | Saline-filled porous rock | 1000 - 100,000 | Pressure plume migration, induced seismicity |
| Depleted Oil/Gas Fields | North Sea, Permian Basin | 100 - 1000 | Reservoir integrity, seal performance |
| Unmineable Coal Seams | Deep anthracite seams | 10 - 100 | Methane displacement, adsorption stability |
6. Visualization: BECCS End-to-End System Workflow
Diagram Title: BECCS Full-System Process Flow Diagram
7. Visualization: BECCS vs DAC Core Pathways Comparison
Diagram Title: BECCS vs DAC Carbon Pathways
8. The Scientist's Toolkit: Key Research Reagent Solutions
Table 4: Essential Reagents & Materials for BECCS Laboratory Research
| Item Name | Function/Application | Key Characteristic |
|---|---|---|
| Monoethanolamine (MEA) Solution | Benchmark solvent for post-combustion CO2 capture experiments. | High reactivity, establishes baseline for absorption efficiency & degradation studies. |
| Advanced Amino-Silica Sorbents | Solid sorbents for CO2 capture from flue gas or air. | Lower regeneration energy than liquid amines, tested for cyclic capacity. |
| Stable Isotope 13C-Labeled Biomass | Tracing biogenic vs. fossil carbon in conversion processes and emissions. | Enables precise mass spectrometry analysis of carbon flows. |
| Porous ZIF/MOF Materials | Novel adsorbents for gas separation (CO2/N2). | High surface area & tunable selectivity for pre-combustion capture research. |
| Reservoir Brine Analogue Solutions | Geochemical studies on CO2-brine-rock interactions. | Simulates in-situ conditions for mineralization and seal integrity experiments. |
| Lignocellulolytic Enzyme Cocktails | Hydrolysis of biomass for biochemical conversion pathways. | Contains cellulases, hemicellulases for yield optimization studies. |
This whitepaper, framed within a broader thesis on BECCS (Bioenergy with Carbon Capture and Storage) versus Direct Air Capture (DAC) comparative potential, provides a technical analysis of the two primary technological pathways for DAC. The focus is a comparative examination of Liquid Solvent and Solid Sorbent systems, detailing their chemical principles, performance metrics, experimental protocols, and material requirements for a research and development audience.
BECCS and DAC are leading negative emission technologies (NETs). BECCS captures CO₂ from point-source bioenergy production, while DAC captures from ambient air anywhere. The choice between liquid solvent and solid sorbent DAC systems is critical for scaling, as it dictates energy demand, cost, and integration potential—key comparative factors against BECCS.
Core Chemical Principles & Pathways
Liquid Solvent Systems
Typically employs aqueous alkaline solutions (e.g., potassium hydroxide, KOH). CO₂ is absorbed and converted into a stable carbonate. Primary Chemical Pathway:
- Absorption: CO₂(aq) + OH⁻ → HCO₃⁻
- Carbonate Formation: HCO₃⁻ + OH⁻ → CO₃²⁻ + H₂O
- Regeneration: The carbonate solution is reacted with calcium hydroxide (slaked lime) to precipitate calcium carbonate (CaCO₃).
- Calcination: CaCO₃ is heated in a calciner (900-950°C) to release pure CO₂ and regenerate CaO.
Diagram Title: Liquid Solvent DAC Chemical Process Flow
Solid Sorbent Systems
Uses porous solid materials functionalized with amine groups (e.g., on silica, alumina, or MOFs) that adsorb CO₂. Regeneration is typically achieved via Temperature-Vacuum Swing Adsorption (TVSA). Primary Chemical Pathway:
- Adsorption: Amine (sorbent) + CO₂ + H₂O ⇄ AmineH⁺ + HCO₃⁻ (adsorbed)
- Saturation: Sorbent reaches capacity.
- Desorption: Application of heat (80-120°C) and/or vacuum releases pure CO₂ and regenerates the amine sorbent.
Diagram Title: Solid Sorbent DAC TVSA Cycle
Performance Data & Comparative Analysis
Table 1: Comparative Performance Metrics of DAC Pathways
| Metric | Liquid Solvent (KOH/CaO) | Solid Sorbent (Amine-functionalized) |
|---|---|---|
| Capture Efficiency (%) | > 90% (highly dependent on contactor design) | 70-90% (dependent on humidity & cycle time) |
| Typical Regeneration Temp. | High: 800-950°C (calcination) | Low-Medium: 80-120°C (desorption) |
| Primary Energy Demand (GJ/tCO₂) | 7-12 (mainly thermal for calcination) | 5-9 (balanced thermal & electrical for vacuum) |
| Current Cost Estimate (USD/tCO₂) | $250 - $600 (high capex, energy-intensive) | $200 - $400 (potential for cost reduction) |
| Water Consumption (t/tCO₂) | High: 1-10 (evaporation losses) | Low: < 1 (some for humidity control) |
| Technology Readiness Level | 6-7 (first commercial plants) | 5-6 (pilot and demonstration) |
| Key Advantage | Proven, continuous process | Lower regeneration temperature, modularity |
| Key Challenge | High-grade heat requirement, sorbent loss | Sorbent degradation, air pretreatment needs |
Detailed Experimental Protocols
Protocol: Testing Solid Sorbent Adsorption Kinetics
Objective: To measure the CO₂ adsorption capacity and rate of a novel amine-impregnated sorbent under controlled humidity. Methodology:
- Sorbent Preparation: Impregnate 5g of mesoporous silica support with 50% w/w aqueous polyethyleneimine (PEI) solution. Dry at 80°C for 12 hours under vacuum.
- Setup: Load 1.0g of prepared sorbent into a fixed-bed quartz reactor (ID = 1 cm) placed inside a temperature-controlled furnace.
- Conditioning: Flush reactor with N₂ (100 mL/min) at 105°C for 1 hour to remove impurities.
- Adsorption: Cool reactor to 25°C. Introduce a humidified gas stream (400 ppm CO₂, balance N₂, 60% RH) at a total flow of 200 mL/min.
- Measurement: Monitor CO₂ concentration at outlet via Non-Dispersive Infrared (NDIR) sensor until breakthrough (C/C₀ = 0.05). Integrate breakthrough curve to calculate dynamic capacity.
- Regeneration: Switch to pure N₂ flow and heat to 90°C for 30 minutes to desorb CO₂. Monitor outlet CO₂ with NDIR.
Protocol: Liquid Solvent Carbonation & Precipitation Efficiency
Objective: To determine the yield of CaCO₃ from a potassium carbonate solution using slaked lime. Methodology:
- Solution Preparation: Create a 1M K₂CO₃ solution using deionized water.
- Carbonation Reaction: In a 500 mL stirred batch reactor, add 250 mL of 1M K₂CO₃. Slowly add a slurry of 10g Ca(OH)₂ in 50 mL DI water while maintaining temperature at 40°C and constant stirring (500 rpm).
- Sampling & Analysis: At 10-minute intervals over 1 hour, extract 5 mL aliquots. Filter immediately (0.45 μm syringe filter). Titrate filtrate with 0.1M HCl to determine remaining carbonate concentration.
- Precipitate Analysis: Filter the final mixture, wash precipitate with DI water and ethanol, dry at 80°C overnight. Weigh final solid product (CaCO₃). Analyze purity via X-ray Diffraction (XRD).
The Scientist's Toolkit: Key Research Reagent Solutions
Table 2: Essential Materials for DAC Laboratory Research
| Item | Function | Example/Notes |
|---|---|---|
| Amine Solutions | Functionalizing solid supports for sorbents. | Polyethyleneimine (PEI), Tetraethylenepentamine (TEPA). High nitrogen content for CO₂ chemisorption. |
| Porous Supports | High-surface-area scaffold for amine loading. | Silica gel, γ-Alumina, Metal-Organic Frameworks (MOFs) like MIL-101 or SBA-15. |
| Alkaline Solvents | Active capture medium for liquid systems. | Potassium Hydroxide (KOH), Sodium Hydroxide (NaOH). Corrosive, requires careful handling. |
| Calcium Precursors | For carbonate precipitation and solvent regeneration. | Calcium Hydroxide (Ca(OH)₂, slaked lime), Calcium Oxide (CaO, quicklime). |
| Standard Gas Mixtures | Calibration and controlled adsorption experiments. | 400-500 ppm CO₂ in N₂ or air, with/without humidity standards. |
| Non-Dispersive Infrared (NDIR) Sensor | Real-time, low-concentration CO₂ measurement. | Critical for breakthrough curve analysis. |
| Thermogravimetric Analyzer (TGA) | Measuring sorbent adsorption capacity & degradation. | Coupled with mass spectrometry (TGA-MS) for evolved gas analysis. |
| Fixed-Bed Reactor System | Bench-scale testing of adsorption/desorption cycles. | Includes temperature control, gas blending, and real-time analytics. |
Diagram Title: Solid Sorbent Lab Test Workflow
The liquid solvent pathway offers robustness and continuous operation but faces significant energy and water hurdles. The solid sorbent pathway promises lower energy penalties and modular design but must overcome sorbent stability and scaling challenges. For researchers comparing the potential of BECCS and DAC, the critical development trajectories are clear: liquid systems require integration with low-cost, low-carbon high-grade heat, while solid systems demand advances in sorbent longevity and structured contactor design. The choice between them will hinge on geographic context (energy/water availability) and the pace of innovation in materials science and process engineering.
Within the comparative analysis of Bioenergy with Carbon Capture and Storage (BECCS) and Direct Air Capture (DAC), the profile of energy and utility inputs is a primary determinant of technical feasibility, cost, and scalability. This whitepaper provides a critical, data-driven analysis of these requirements, serving researchers and process development professionals engaged in evaluating carbon dioxide removal (CDR) pathways. The analysis underscores that while BECCS is a energy-producing process with significant ancillary resource demands, DAC is a energy-consuming process where the source and form of energy dictate its viability.
The core thesis differentiating BECCS and DAC posits that BECCS offers a co-product (energy) but is constrained by biomass sustainability and geographic factors, whereas DAC is energy-intensive but offers siting flexibility. The magnitude, type (heat vs. electricity), temperature grade, and continuity of energy inputs directly govern the efficiency, operational cost, and net carbon removal efficacy of each technology.
Quantitative Analysis of Energy & Utility Demands
The following tables synthesize current data on energy and utility consumption for leading DAC and BECCS configurations.
Table 1: Direct Air Capture (DAC) Process Energy Requirements
| DAC Technology | Thermal Energy Demand (GJ/tCO₂) | Electrical Energy Demand (GJ/tCO₂) | Temperature Requirement (°C) | Primary Utility Inputs |
|---|---|---|---|---|
| Solid Sorbent (Low-Temp) | 5 - 8 | 1.5 - 2.5 | 80 - 120 | Low-grade heat (e.g., industrial waste, geothermal), Electricity |
| Liquid Solvent (High-Temp) | 8 - 12 | 0.2 - 0.5 | 800 - 900 | High-grade heat (natural gas combustion, advanced nuclear), Electricity |
Sources: Data consolidated from recent operational analyses of Orca (Climeworks) and Carbon Engineering plants, and peer-reviewed system modeling (2023-2024).
Table 2: BECCS Pathway Energy & Resource Balance
| BECCS Configuration | Feedstock | Gross Energy Output (GJ/t Biomass) | CCS Energy Penalty (% of output) | Net Energy Output (GJ/tCO₂ removed) | Key Ancillary Utilities |
|---|---|---|---|---|---|
| Biomass Power + Amine CCS | Wood Chips | 10-12 | 20-30% | 2 - 4 | Process Water, Solvent (MEA), Compression Power |
| Bioethanol + Sequestration | Corn/ Sugarcane | 6-8 (as ethanol) | 15-25% | 1.5 - 3 | Irrigation Water, Fertilizer, Fermentation Nutrients |
Sources: Integrated assessment models (IAMs) and life-cycle inventory data from facilities like the Illinois Industrial CCS Project (2023-2024).
Experimental Protocols for System Analysis
Protocol 1: Measuring Specific Energy Consumption in Solid Sorbent DAC Systems
- Objective: Quantify the thermal and electrical energy required per metric ton of CO₂ captured in a temperature-vacuum swing adsorption (TVSA) cycle.
- Materials: Bench-scale packed-bed reactor with solid amine sorbent, mass flow controllers for simulated air, programmable temperature oven, vacuum pump, CO₂ analyzer (NDIR), precision power meters (thermal & electrical).
- Procedure:
- Adsorption Phase: Condition the sorbent bed. Pass a defined flow of humidified, 420 ppm CO₂ air at 25°C over the sorbent until breakthrough is detected by the NDIR analyzer. Record electrical energy for fans/blowers.
- Desorption Phase: Isolate the reactor. Initiate the desorption cycle by applying controlled thermal energy to the bed (recorded via power meter) while pulling a vacuum. Capture the released, concentrated CO₂ stream.
- Calculation: Integrate total thermal (Joules from heater) and electrical (Joules from pump/blowers) input over a complete cycle. Divide by the mass of CO₂ captured (measured via NDIR integration) to obtain GJ/tCO₂.
Protocol 2: Life-Cycle Inventory for BECCS Utility Footprint
- Objective: Develop a cradle-to-gate inventory of direct and indirect energy/utility inputs for a biomass power plant with post-combustion capture.
- Materials: Process simulation software (e.g., Aspen Plus), agricultural input data (fertilizer, diesel for harvesting), transportation models, power plant performance specifications, amine scrubbing unit models.
- Procedure:
- Feedstock Cultivation Module: Collect data on diesel, electricity, and fertilizer inputs per hectare of biomass cultivation. Allocate proportionally to biomass yield.
- Conversion & Capture Module: Model the power plant and attached stripper unit. Using simulation, determine the parasitic load (in MW) for solvent circulation, pump work, and CO₂ compression.
- Allocation: Sum all direct and embodied energy inputs across the chain. Allocate net CO₂ captured between energy output and the removal service. Report total process water, chemicals, and net energy output per tCO₂ sequestered.
System Visualization: Energy Flows and Comparative Pathways
DOT script for generating the "DAC Energy Input & Process Flow" diagram.
DOT script for generating the "BECCS Energy & Utility Flow Diagram".
The Scientist's Toolkit: Research Reagent Solutions
Table 3: Essential Research Materials for Energy Analysis Experiments
| Material / Solution | Function in Analysis | Typical Specification / Example |
|---|---|---|
| Solid Aminosilica Sorbents | DAC model system for measuring adsorption capacity and regeneration energy. | PEI-impregnated SBA-15, Classified particle size (150-250 µm). |
| Aqueous Amine Solvents (e.g., MEA, KOH) | Benchmark liquid absorbent for comparative energy studies in both DAC and BECCS contexts. | 30 wt% Monoethanolamine (MEA) solution, ACS grade. |
| NDIR CO₂ Analyzer | Precise, real-time measurement of CO₂ concentration for calculating capture rates and system efficiency. | Multi-gas analyzer with 0-5000 ppm range, ±2% accuracy. |
| Calorimetry System | Measures enthalpy of absorption/desorption, a critical parameter for thermal energy demand calculations. | Differential scanning calorimeter (DSC) or custom flow calorimeter. |
| Process Modeling Software License | Enables thermodynamic modeling of energy and mass balances for full-scale system extrapolation. | Aspen Plus, gPROMS, or open-source equivalent (DWSIM). |
| Precision Power & Flow Meters | Quantifies electrical and thermal energy inputs (kWh) and fluid flow rates in bench-scale setups. | Clamp-on power meters, Coriolis mass flow meters, thermal energy meters. |
Within the broader research context comparing the potential of Bioenergy with Carbon Capture and Storage (BECCS) and Direct Air Capture (DAC), defining their optimal application niches is critical. This technical guide provides a framework for researchers and drug development professionals to evaluate these negative emission technologies (NETs) based on geographic, sectoral, and technical parameters. The efficacy of each technology is not uniform but is governed by localized resource availability, infrastructure, and economic drivers.
BECCS and DAC operate on fundamentally different principles, leading to distinct input requirements and output profiles.
- BECCS: Integrates energy production from biomass with post-combustion, pre-combustion, or oxy-fuel combustion carbon capture, followed by geological storage. It is a co-product system yielding carbon-negative energy.
- DAC: Uses chemical sorbents or solvents (typically liquid hydroxides or solid amines) to absorb CO₂ directly from the ambient atmosphere, followed by a energy-intensive regeneration cycle to release a pure CO₂ stream for storage or utilization.
Geographic Niches Analysis
Optimal deployment is highly sensitive to regional characteristics. Key determining factors include biomass sustainability, low-carbon energy availability, and suitable geology.
Table 1: Geographic Suitability Analysis for BECCS and DAC Deployment
| Geographic Factor | High Suitability for BECCS | High Suitability for DAC | Rationale & Key Constraints |
|---|---|---|---|
| Biomass Availability | Regions with sustainable, large-scale biomass production (e.g., forestry residues, energy crops on marginal land). Examples: Southeastern USA, Northern Europe, Brazil. | Not a direct requirement. | BECCS scalability is bounded by sustainable biomass supply, land-use competition, and water availability. |
| Low-Carbon Energy Density | Moderate requirement for process heat/power, which can be self-supplied. | Regions with abundant, cheap, low-carbon electricity (geothermal, hydro, solar, wind) or waste heat. Examples: Iceland, Norway, SW USA, Middle East (with solar). | DAC's energy intensity (6-10 GJ/tCO₂ for liquid systems; 8-16 GJ/tCO₂ for solid sorbent) makes renewable energy cost critical. |
| Geological Storage Proximity | High suitability near sedimentary basins with proven storage capacity (e.g., North Sea, Gulf Coast, Alberta Basin). | Same high requirement as BECCS. | Transporting CO₂ over long distances via pipeline is economically and politically challenging. Proximity to storage is a major cost driver for both. |
| Land Footprint | High land-use due to biomass cultivation; suitable for lower-population density areas. | Compact industrial plants; suitable for arid, non-arable land or industrial zones. | DAC's small land footprint allows siting flexibility, avoiding land-use conflicts. |
| Atmospheric CO₂ Concentration | Insensitive to ambient CO₂ levels (~420 ppm). | Technically insensitive, but economic efficiency is constant regardless of location. | Unlike point-source capture, DAC performance does not vary with local air composition, allowing global uniformity. |
Sectoral Application Niches
Different industrial sectors present unique opportunities and challenges for integration with BECCS or DAC.
Table 2: Sectoral Integration Potential for BECCS and DAC
| Sector | BECCS Applicability | DAC Applicability | Key Considerations & Experimental Protocols |
|---|---|---|---|
| Power Generation | High. Can retrofit existing biomass/co-firing power plants or build new bioenergy plants with CCS. | Low. DAC is not coupled to power generation. | BECCS Protocol (Post-Combustion): 1. Flue gas from biomass combustion is cooled and scrubbed. 2. CO₂ is absorbed using a solvent (e.g., 30 wt% Monoethanolamine - MEA). 3. Rich solvent is regenerated in a stripper at 100-120°C, releasing high-purity CO₂. 4. Capture efficiency is measured via continuous gas analyzers pre- and post-absorption column. |
| Pulp, Paper & Forestry | Very High. Large, centralized sources of biogenic CO₂ from recovery boilers and biomass residues on-site. | Low. Typically a point-source, making DAC less efficient. | BECCS Protocol (Oxy-fuel): 1. Biomass is combusted in >95% O₂ (from an ASU), producing a flue gas primarily of CO₂ and H₂O. 2. After dehydration and purification, a >95% pure CO₂ stream is achieved. 3. Key measurement: Continuous O₂ concentration monitoring to ensure combustion stability and purity. |
| Waste-to-Energy | High. Municipal solid waste contains significant biogenic fraction. Capturing emissions can yield negative emissions. | Low. | Experimental Protocol for Biogenic Fraction Determination: Use the 14C Radiocarbon Method. 1. Sample flue gas CO₂ onto a molecular sieve. 2. Convert sampled CO₂ to benzene or graphite. 3. Analyze via Accelerator Mass Spectrometry (AMS) to determine 14C/12C ratio. 4. Calculate biogenic fraction by comparing to modern carbon reference. |
| Chemical & Fuel Synthesis | Medium. Biogenic CO₂ can be a feedstock, but BECCS prioritizes storage. | Very High. DAC provides pure, atmospheric CO₂ for electrochemical or thermochemical synthesis of e-fuels (e.g., methanol, synthetic hydrocarbons). | DAC Integration Protocol (for e-Methanol): 1. CO₂ captured via solid sorbent DAC unit. 2. H₂ produced via electrolysis using renewable power. 3. Catalytic synthesis (Cu/ZnO/Al₂O₃ catalyst) at 50-100 bar, 200-300°C: CO₂ + 3H₂ → CH₃OH + H₂O. 4. Purity is assessed via Gas Chromatography (GC). |
| Pharmaceutical & Biotechnology R&D | Low. Not typically a sectoral application. | Medium/High. For carbon labeling in drug development. Atmospheric CO₂ captured via DAC provides a uniform, traceable carbon source for synthesizing 14C-labeled compounds for ADME (Absorption, Distribution, Metabolism, Excretion) studies. | Protocol for 14C-Labeling Precursor Synthesis using DAC: 1. Operate a specialized DAC unit to concentrate atmospheric CO₂. 2. Catalytically convert CO₂ to a foundational precursor (e.g., CH₄, CH₃OH) using renewable H₂. 3. Use biosynthetic or chemosynthetic pathways to incorporate the uniform 14C into target molecular scaffolds (e.g., APIs). 4. Radio-HPLC is used to verify specific activity and purity. |
Visualization of Technology Pathways & Decision Logic
Decision Logic for Technology Siting
DAC Chemical Process Pathways
The Scientist's Toolkit: Research Reagent Solutions
Table 3: Key Research Reagents and Materials for NETs Experiments
| Item Name | Supplier Examples (for Reference) | Function in BECCS/DAC Research | Typical Application Protocol |
|---|---|---|---|
| Monoethanolamine (MEA) Solution | Sigma-Aldrich, Fisher Scientific | Benchmark solvent for post-combustion CO₂ capture kinetics and degradation studies. | Prepared as 30 wt% aqueous solution for lab-scale absorption column experiments to establish baseline efficiency. |
| Amine-Functionalized Silica Sorbents | Material Vendors (e.g., SRI) / Lab-synthesized | Model solid sorbents for DAC adsorption isotherm and cycling stability tests. | Packed into a fixed-bed reactor; exposed to simulated air/CO₂ mix; cycled with temperature/pressure swings. |
| Potassium Hydroxide (KOH) pellets | Common chemical suppliers | Used in liquid DAC pathway simulations and solvent characterization. | Dissolved in water to create concentrated solutions for air contactor mock-up experiments. |
| 14C-Labeled Sodium Bicarbonate (NaH14CO₃) | American Radiolabeled Chemicals, Inc. | Critical tracer for quantifying biogenic carbon fraction (BECCS) and tracing carbon in utilization pathways. | Used in lab-scale bioreactors or chemical synthesis to track carbon flow via scintillation counting or AMS. |
| Gas Chromatography System with TCD & FID | Agilent, Shimadzu | Essential for analyzing gas composition (CO₂, CH₄, CO, N₂, O₂) in process streams from capture experiments. | Regular calibration with certified standard gas mixtures is required before sampling experimental output streams. |
| Accelerator Mass Spectrometry (AMS) Service | Commercial AMS labs (e.g., Beta Analytic) | Gold-standard for distinguishing fossil vs. biogenic carbon via 14C measurement. | Samples (e.g., captured CO₂, biomass) are converted to graphite and analyzed for 14C/12C ratio. |
| Cu/ZnO/Al₂O₃ Catalyst pellets | Alfa Aesar, lab-prepared | Standard catalyst for studying CO₂ hydrogenation to methanol, a key DAC utilization pathway. | Loaded into a high-pressure continuous-flow reactor system under controlled temperature and syngas (CO₂/H₂) feed. |
Within the comparative analysis of Bioenergy with Carbon Capture and Storage (BECCS) and Direct Air Capture (DAC), operational facilities provide critical, real-world data on technological pathways for achieving negative emissions. This whitepaper examines two leading BECCS projects and two commercial DAC plants, focusing on their core technologies, performance metrics, and operational protocols. The analysis is structured to inform researchers, including those in related fields like drug development who require rigorous data evaluation, on the current state of technological readiness and scalability.
Operational BECCS Case Study: Illinois Industrial Carbon Capture and Storage (ICCS)
The Illinois ICCS project at the Archer Daniels Midland (ADM) ethanol bio-refinery in Decatur is one of the world's first large-scale BECCS operations. It captures CO₂ from bio-ethanol fermentation—a nearly pure stream—for geological sequestration.
Core Technology & Protocol
The facility employs a post-combustion capture system using an amine-based solvent (primarily monoethanolamine - MEA). The standard protocol for carbon capture in this context involves:
- Gas Conditioning: The fermentation-derived CO₂ is cooled and scrubbed to remove impurities.
- Absorption: The gas contacts the MEA solution in an absorber column, where CO₂ is chemically bound.
- Regeneration: The CO₂-rich solvent is pumped to a stripper column and heated (typically to 100-120°C) to break the chemical bond, releasing high-purity CO₂.
- Compression & Dehydration: The captured CO₂ is compressed to a supercritical state and dehydrated for pipeline transport.
- Injection & Monitoring: The CO₂ is injected via a dedicated well into the Mount Simon Sandstone reservoir at ~2,100 meters depth. A comprehensive monitoring, verification, and accounting (MVA) protocol is implemented, including downhole pressure monitoring, time-lapse vertical seismic profiling, and fluid sampling.
Quantitative Data: Illinois ICCS
| Metric | Value | Notes |
|---|---|---|
| Annual Capture Capacity | ~1.0 million tonnes CO₂ | As of Phase 2 expansion (operative 2017) |
| Capture Rate (%) | >90% | From fermentation process |
| Cumulative Stored CO₂ | >3.5 million tonnes | Since operations began (2011-2017 for Phase 1, 2017-present for Phase 2) |
| Injection Depth | ~2,100 m | Into the Mount Simon Sandstone |
| Storage Reservoir | Saline Aquifer | Deep, porous sandstone formation |
| Primary Capture Solvent | Amine-based (MEA) | Industry-standard for high-purity streams |
Operational DAC Case Studies: Orca and STRATOS
Direct Air Capture technology extracts CO₂ directly from the ambient atmosphere using chemical sorbents. Two leading operational plants are Climeworks' Orca in Iceland and Occidental's STRATOS (Direct Air Capture 1 plant) in Texas, USA.
Core Technology & Protocol: Solid Sorbent DAC (Orca)
Climeworks' Orca plant uses a modular, solid sorbent filter system. The experimental cycle is as follows:
- Air Intake: Fans draw ambient air through a series of collectors.
- Adsorption: CO₂ in the air is chemically bound to the surface of amine-functionalized solid sorbent filters.
- Separation & Desorption: Once saturated, the collector is closed and heated to ~100°C using low-grade or geothermal energy. This releases the purified CO₂.
- Product Delivery & Storage: The released CO₂ is mixed with water and pumped underground by Carbfix's partner system, where it mineralizes in basalt formations. A key protocol involves the verification of mineralization via tracer tests and groundwater sampling.
Core Technology & Protocol: Liquid Solvent DAC (STRATOS)
The STRATOS plant (DAC 1) uses a potassium hydroxide (KOH) based liquid solvent system, adapted from legacy gas treating processes.
- Air Contact: A large air contactor (fan system) exposes a potassium hydroxide solution to ambient air. CO₂ reacts with KOH to form potassium carbonate (K₂CO₃).
- Pellet Reactor: The K₂CO₃ solution is transferred to a pellet reactor where it reacts with calcium hydroxide (Ca(OH)₂) to precipitate calcium carbonate (CaCO₃) pellets.
- Calcination (Regeneration): The CaCO₃ pellets are heated in a high-temperature (≈900°C) calciner powered by natural gas (with plans for transition to renewables/capture), releasing a pure CO₂ stream and regenerating calcium oxide (CaO).
- Slaking & Recycle: The CaO is slaked with water to reform Ca(OH)₂ for reuse.
- Compression & Utilization: The pure CO₂ stream is compressed for use in enhanced oil recovery (EOR) or dedicated storage.
Quantitative Data: Orca vs. STRATOS
| Metric | Orca (Climeworks) | STRATOS (Occidental/1PointFive) |
|---|---|---|
| Annual Capture Capacity (Design) | 4,000 tonnes CO₂ | Up to 500,000 tonnes CO₂ (at full capacity) |
| Technology | Solid Amine Sorbent | Liquid Hydroxide Solvent (KOH) |
| Energy Source | Geothermal (Renewable) | Natural Gas (with plans for transition) |
| Heat Requirement | Low-grade (~100°C) | High-grade (~900°C for calcination) |
| CO₂ Fate | Mineral Storage (Carbfix) | Mainly EOR / Dedicated Geologic Storage |
| Status | Operational (2021) | Commissioning / Early Operation (2024) |
Comparative Analysis: Critical Methodologies for Evaluation
Researchers evaluating these technologies must consider standardized protocols for life-cycle assessment (LCA) and techno-economic analysis (TEA).
Protocol 1: Net Negative Emissions Calculation
For a comparative thesis, the core calculation for net removal must account for the full lifecycle.
- For BECCS (e.g., Illinois ICCS):
Net CO₂ Removed = (Biogenic CO₂ Captured & Stored) - (Emissions from Cultivation + Processing + Capture Process Energy + Transport & Injection)Methodology: Requires detailed attributional LCA of biomass supply chain and plant operations. The Decatur project uses site-specific emissions data for operations and literature values for sustainable corn cultivation. - For DAC (e.g., Orca/STRATOS):
Net CO₂ Removed = (CO₂ Captured from Air) - (Emissions from Sorbent/Solvent Production + Plant Construction + Operational Energy)Methodology: Requires rigorous energy system modeling. Orca's use of geothermal energy minimizes the operational penalty. STRATOS's current reliance on natural gas necessitates careful accounting of associated emissions, which are partially mitigated by using captured CO₂ in secure storage via EOR.
Protocol 2: Sorbent/Solvent Performance Testing
A key experimental protocol in both fields involves testing the durability and capacity of capture media.
- Cycling Test: The sorbent (solid amine) or solvent (KOH/MEA) is subjected to repeated adsorption/desorption cycles in a lab-scale reactor.
- Degradation Measurement: Samples are analyzed periodically via techniques like Fourier-Transform Infrared Spectroscopy (FTIR) or titration to quantify loss of active sites due to oxidation, thermal degradation, or impurity poisoning.
- Capacity Measurement: The CO₂ adsorption/absorption capacity (e.g., mol CO₂/kg sorbent) is measured before and after defined cycle numbers (e.g., 1, 10, 100, 1000 cycles) to establish a degradation curve.
The Scientist's Toolkit: Research Reagent Solutions & Essential Materials
For researchers conducting lab-scale simulations or analyses related to BECCS and DAC technologies, the following reagents and materials are fundamental.
| Item | Function in Research | Example Application |
|---|---|---|
| Monoethanolamine (MEA) | Benchmark amine solvent for CO₂ absorption. | Simulating post-combustion or fermentation-based capture in batch reactors; kinetic studies. |
| Potassium Hydroxide (KOH) | Strong liquid alkali solvent for CO₂ chemisorption. | Modeling liquid DAC processes; studying carbonate precipitation kinetics. |
| Amine-Functionalized Solid Sorbents | Porous supports (e.g., silica, alumina) with grafted amines for CO₂ adsorption. | Testing cyclic capacity and degradation in fixed-bed reactors for solid sorbent DAC. |
| Calcium Hydroxide (Ca(OH)₂) | Reagent for converting carbonate solutions into solid precipitates. | Studying the pelletization and calcination steps in liquid solvent DAC cycles. |
| Gas Chromatograph (GC) with TCD | Analytical instrument for quantifying gas composition (CO₂, N₂, O₂). | Measuring capture efficiency, solvent degradation byproducts, and gas purity. |
| Benchtop Parr Reactor | Pressurized, temperature-controlled reaction vessel. | Conducting solvent performance tests under realistic temperature/pressure conditions. |
| Titration Setup | For quantifying amine concentration or carbonate loading in solutions. | Measuring solvent degradation (amine loss) and CO₂ absorption capacity. |
Visualizations
Title: Solid Sorbent DAC Process Flow (e.g., Orca)
Title: BECCS Process at Illinois ICCS Facility
Title: BECCS vs DAC Comparative Overview
Navigating Hurdles: Critical Challenges, Costs, and Optimization Strategies
Within the comparative assessment of Bioenergy with Carbon Capture and Storage (BECCS) and Direct Air Capture (DAC) as negative emission technologies (NETs), significant bottlenecks threaten the scalability and sustainability of BECCS. This whitepaper details the core constraints of land-use change, water resource demand, and systemic sustainability, which are less pronounced in engineered DAC systems. The viability of BECCS as a large-scale climate solution hinges on addressing these interrelated challenges.
Quantitative Analysis of Bottlenecks
Table 1: Land-Use and Water Demand Estimates for BECCS Scalability
| Parameter | Low Estimate | Median/Common Estimate | High Estimate | Notes & Source (2023-2024) |
|---|---|---|---|---|
| Land Required per Gt CO₂/yr | 300 Mha | 380 - 700 Mha | Up to 1,200 Mha | Highly crop & region dependent. High end assumes lower yields. |
| Water Consumption (km³/yr per Gt CO₂) | 1,500 | ~3,000 | 8,000 - 10,000 | Irrigated biomass significantly increases demand. |
| Potential Global Sequestration (Gt CO₂/yr) | 5 | 3 - 7 (theoretical) | 11 - 12 | Constrained by sustainable land/water limits, not technical potential. |
| Comparative Water Use: BECCS vs. DAC (m³/tCO₂) | ~100 - 1,000+ | BECCS: 50-600; DAC: 1-10 | BECCS >> DAC | DAC water use primarily for cooling, often in closed loops. |
| Fertilizer Demand (Mt N/yr per Gt CO₂) | 20 | 30 - 100 | 150 | Key for non-leguminous crops; source of indirect emissions. |
Table 2: Sustainability and Impact Indicators
| Indicator | Impact Range | Primary Concerns | Mitigation Strategy Relevance |
|---|---|---|---|
| Biodiversity Loss | Moderate to Severe | Monoculture plantations, ILUC, habitat fragmentation. | Use of marginal/degraded lands, polycultures. |
| Food Security Displacement | High Risk at Scale | Direct & indirect land competition with agriculture. | Strict governance, use of residual & waste biomass. |
| Soil Carbon Debt | Net loss in short-term (5-50 yrs) | Land conversion releases soil carbon, offsetting CCS benefits. | Perennial crops, no-till practices, protect existing stocks. |
| Net Energy Return (NER) | Wide range (2:1 to 10:1) | Low NER reduces net carbon removal efficacy. | Optimize supply chain, use high-yield feedstocks. |
| Social Acceptance | Highly Variable | Land rights, water access, local community impacts. | Early and inclusive stakeholder engagement. |
Experimental Protocols for Key Assessments
Protocol 1: Life Cycle Assessment (LCA) for BECCS Sustainability
Objective: Quantify the net carbon removal and environmental impacts of a BECCS value chain. Methodology:
- Goal & Scope: Define functional unit (e.g., 1 MWh electricity + 1 tCO₂ sequestered), system boundaries (cradle-to-grave), and impact categories (GWP, land use, water consumption, eutrophication).
- Inventory Analysis (LCI):
- Biomass Cultivation: Collect data on feedstock yield, land-use history, inputs (fertilizer, pesticides, irrigation), farm machinery use, and direct N₂O emissions from soil.
- Biomass Logistics: Model transport emissions (distance, mode) and preprocessing energy (drying, pelletizing).
- Conversion & CCS: Obtain plant data on efficiency, fuel use, capture solvent (e.g., MEA) consumption and degradation rates, and CO₂ capture rate (e.g., 90%). Include CO₂ compression, transport (pipeline), and geological injection.
- Impact Assessment (LCIA): Apply characterization factors (e.g., IPCC AR6 for GWP) to inventory flows. Critical Step: Account for direct and indirect land-use change (d/iLUC) emissions using models like ECAM or GLOBIOM.
- Interpretation: Calculate net carbon balance:
Net CO₂e = (CO₂ sequestered) - (Supply Chain Emissions + iLUC Emissions + CCS Energy Penalty Emissions). Perform sensitivity analysis on key parameters.
Protocol 2: Assessing Water Footprint of BECCS Feedstocks
Objective: Determine the green (rainwater) and blue (irrigation) water consumption of candidate biomass crops. Methodology:
- Site Selection: Identify representative plots for target feedstocks (e.g., switchgrass, miscanthus, poplar, eucalyptus).
- Soil Water Measurement: Install time-domain reflectometry (TDR) or capacitance probes at multiple soil depths (e.g., 0-30cm, 30-60cm, 60-90cm) to monitor volumetric water content.
- Evapotranspiration (ET) Calculation: Use the soil water balance method:
ET = I + P - R - D - ΔS, where I=Irrigation, P=Precipitation, R=Runoff, D=Drainage, ΔS=change in soil water storage. Runoff and drainage are measured with collection systems or estimated via models. - Crop Yield Measurement: Harvest biomass from defined areas at maturity, dry to constant weight, and record dry matter yield (t/ha).
- Analysis: Compute water footprint:
WF (m³/t) = (ET * Area) / Yield. Differentiate blue/green components based on irrigation source. Compare against local water availability stress indices.
Visualizations
Diagram 1: BECCS Bottlenecks and Impacts (760px)
Diagram 2: LCA Protocol for BECCS (760px)
The Scientist's Toolkit: Key Research Reagent Solutions
Table 3: Essential Materials for BECCS Sustainability Research
| Item/Category | Function in Research | Example & Specifications |
|---|---|---|
| Eddy Covariance Flux Tower | Measures net ecosystem exchange (NEE) of CO₂, H₂O, and energy fluxes to directly assess carbon balance of biomass plots. | Systems include infrared gas analyzer (IRGA) for CO₂/H₂O and 3D sonic anemometer for wind. |
| Soil Carbon/Nitrogen Analyzer | Quantifies soil organic carbon (SOC) and total nitrogen before/after land conversion to calculate soil carbon debt. | Dry combustion method (e.g., Elementar vario MAX cube). |
| Stable Isotope Mass Spectrometer | Traces fertilizer fate (¹⁵N), partitions evapotranspiration sources, and verifies biogenic origin of captured CO₂. | Requires peripherals for soil gas, water, and plant matter preparation. |
| Process-Based Crop Model | Simulates biomass yield, water, and nutrient demands under future climate scenarios. | Models: APSIM, DAYCENT, or LPJmL for large-scale analyses. |
| Land-Use Change Modeling Suite | Estimates indirect land-use change (iLUC) emissions and economic impacts. | GLOBIOM (IIASA) or GCAM (PNNL) integrated with LCA databases like ecoinvent. |
| Life Cycle Assessment (LCA) Software | Structures inventory data and calculates environmental impacts per ISO 14040/44 standards. | SimaPro, openLCA, or GaBi. Must include biogenic carbon and iLUC modules. |
| Geographic Information System (GIS) | Analyzes spatial constraints: land availability, water stress, biodiversity hotspots, and infrastructure proximity. | ArcGIS Pro or QGIS with global datasets (e.g., EarthStat, Aqueduct). |
This whitepaper examines the scalability constraints of Direct Air Capture (DAC) technology within the comparative framework of Bioenergy with Carbon Capture and Storage (BECCS). A central thesis in carbon dioxide removal (CDR) research posits that while BECCS leverages established biomass conversion processes, its land-use implications and lower capture concentration pose significant challenges. In contrast, DAC offers geographic flexibility and a high-purity CO₂ stream but faces profound scalability hurdles rooted in its immense energy demand and the logistical complexities of integration with non-dispatchable renewable power. This document provides a technical guide to these core challenges, targeting researchers and scientific professionals engaged in developing scalable climate solutions.
Energy Intensity: The Fundamental Scalability Barrier
The energy requirement for DAC is dictated by the thermodynamics of capturing CO₂ from a dilute source (~420 ppm). Energy is consumed primarily in two operations: air contactor fan power and sorbent regeneration.
Quantitative Energy Breakdown
Recent pilot-scale data and process modeling reveal the following energy intensities for leading DAC approaches:
Table 1: Comparative Energy Intensity of DAC Technologies
| DAC Technology | Thermal Energy (GJ/t CO₂) | Electrical Energy (GJ/t CO₂) | Total Energy (GJ/t CO₂) | Primary Energy Source for Regeneration |
|---|---|---|---|---|
| High-Temp Liquid Solvent (e.g., KOH) | 5.0 - 8.5 | 1.1 - 1.7 | 6.1 - 10.2 | Natural Gas, Renewable Heat, Geothermal |
| Low-Temp Solid Sorbent (e.g., Amine-Functionalized) | 1.5 - 2.5 | 1.6 - 2.5 | 3.1 - 5.0 | Industrial Waste Heat, Electric Heating |
| Electro-Swing Adsorption | ~0 | 3.0 - 4.5 | 3.0 - 4.5 | Intermittent Renewable Electricity |
Source: Compiled from 2023-2024 operational data from Climeworks, Carbon Engineering, and Global Thermostat facilities, and peer-reviewed LCA studies.
Experimental Protocol: Measuring Sorbent Regeneration Energy
A standardized laboratory protocol for determining the regeneration enthalpy of a solid sorbent is critical for benchmarking.
Title: Protocol: Calorimetric Measurement of Sorbent Regeneration Energy
Objective: To quantify the specific thermal energy requirement (J/g CO₂) for desorbing CO₂ from a loaded amine-functionalized solid sorbent.
Materials & Method:
- Sorbent Loading: Place a known mass (e.g., 10.0 g) of dry sorbent in a fixed-bed reactor. Flush with a simulated air stream (410 ppm CO₂, balance N₂/O₂) at a controlled humidity (e.g., 60% RH) and temperature (25°C) until breakthrough (outlet CO₂ = inlet CO₂). Monitor via inline NDIR CO₂ sensor.
- Calorimeter Setup: Transfer the loaded sorbent chamber to a calibrated differential scanning calorimeter (DSC) coupled with a mass spectrometer (MS) for evolved gas analysis.
- Temperature-Programmed Desorption (TPD): In the DSC, initiate a linear temperature ramp (e.g., 5°C/min) from 25°C to 120°C under a pure N₂ purge. The DSC measures the heat flow required to maintain the ramp.
- Data Analysis: The MS quantifies the CO₂ desorbed over time. Integrate the DSC heat flow curve over the time period corresponding to the major CO₂ evolution peak. The integrated heat (J) divided by the total mass of CO₂ desorbed (g), as measured by the MS, yields the specific regeneration energy.
Diagram 1: Sorbent Regeneration Energy Measurement
Renewable Integration: Intermittency & Ramping Challenges
Coupling DAC with variable renewable energy (VRE) like solar PV and wind is essential for net-negative carbon removal but introduces operational complexity.
Dynamic Operation & Sorbent State Management
A DAC plant operating on intermittent power must transition between active capture, idle standby, and regeneration modes. The chemical state of the sorbent during unpredictable idle periods is critical.
Table 2: Operational Modes for Renewably-Powered DAC
| Mode | Power State | Primary Process | Key Challenge | Potential Sorbent Impact |
|---|---|---|---|---|
| Active Capture | High | CO₂ adsorption from air | Maximize throughput during high renewable output | Steady loading. Heat/moisture management. |
| Regeneration | Medium-High | CO₂ desorption & compression | Requires sustained, high-quality energy (heat/power) | Cycle fatigue. Thermal degradation over time. |
| Idle Standby | Low/Zero | System hibernation | Maintain sorbent capacity & integrity without energy input | CO₂ leaching, moisture uptake, oxidation. |
| Ramp-Up/Down | Changing | Transition between modes | Minimize energy penalty and time delay | Stress from rapid T/P changes. Partial loading state. |
Experimental Protocol: Testing Sorbent Stability Under Cyclic Intermittent Loading
This protocol assesses sorbent performance under simulated renewable intermittency.
Title: Protocol: Cyclic Intermittent Loading-Stability Test
Objective: To evaluate the CO₂ working capacity and degradation rate of a DAC sorbent subjected to repeated, variable-duration adsorption and idle periods.
Materials & Method:
- Reactor Setup: A fixed-bed reactor containing a precise mass of sorbent is equipped with upstream mass flow controllers (for air/CO₂ mix) and a humidity generator. Downstream, an NDIR CO₂ analyzer measures breakthrough.
- Intermittency Profile: A 72-hour test cycle is programmed:
- Adsorption (6h): Simulated air flow at standard conditions.
- Idle (2h): Flow stops, reactor vents to ambient pressure, temperature held.
- Adsorption (12h): Standard conditions.
- Long Idle (10h): Flow stops.
- Regeneration (4h): Apply standard regeneration conditions (e.g., 90°C vacuum).
- Repeat for 50 cycles.
- Metrics: The CO₂ captured in each adsorption phase is measured via integration of the breakthrough curve. Working capacity is plotted vs. cycle number. Post-experiment, sorbent is analyzed via TGA and FTIR for chemical changes.
Diagram 2: Intermittent Cycling Test Protocol
The Scientist's Toolkit: DAC Research Reagent Solutions
Table 3: Key Research Reagents & Materials for DAC Experimentation
| Item | Function in DAC Research | Key Consideration |
|---|---|---|
| Amine-Functionalized Mesoporous Silica (e.g., SBA-15 with APTES) | Model solid chemisorbent. High surface area and tunable pore structure for studying amine loading effects on capacity and kinetics. | Pore size distribution critically impacts CO₂ diffusion and amine efficiency. |
| Potassium Hydroxide (KOH) Solution | Benchmark liquid hydroxide solvent for high-throughput capture. Used in pilot-scale DAC. | Highly corrosive. Requires careful handling and energy-intensive regeneration. Captures CO₂ as carbonate. |
| Metal-Organic Framework (MOF) with Open Metal Sites (e.g., Mg-MOF-74) | Leading physisorbent material. Excellent for studying the role of humidity and low-temperature regeneration. | Stability under real-air conditions (humidity, trace gases) is a key research challenge. |
| Electro-Swing Sorbent (e.g., Polyanthraquinone-Carbon Nanotube Composite) | Material for electrochemical DAC. Applying a potential swing releases CO₂, enabling purely electrical operation. | Research focuses on stability over redox cycles and coulombic efficiency. |
| Simulated Ambient Air Gas Cylinder | Standardized feed gas for bench experiments (e.g., 420 ppm CO₂, 21% O₂, balance N₂, with optional SO₂/NOx). | Essential for reproducible testing under realistic, controlled conditions. |
| Quartz Wool & Ceramic Beads | Used for packing and supporting sorbent in fixed-bed reactor tubes to ensure even gas flow and prevent channeling. | Inert at test temperatures to avoid catalytic reactions. |
Integrated Analysis: Implications for the BECCS vs. DAC Thesis
The data and protocols presented highlight DAC's unique scalability vectors. BECCS energy input is largely front-loaded in biomass cultivation and processing, with a relatively consistent capture process at ~10-15% CO₂ concentration. DAC's energy is dominated by the separation process itself from ultra-dilute flow, making its quality (heat vs. electricity) and timing (intermittent vs. baseload) paramount.
A scalable DAC system must be designed as a flexible electrochemical/thermochemical asset on the future grid, capable of acting as a demand-response resource. This requires sorbents and processes fundamentally different from those optimized for steady-state, fossil-fuel-powered operation. The comparative potential of DAC versus BECCS will therefore be determined not by nominal cost projections, but by the success of interdisciplinary research in materials science (stable, low-energy sorbents), process engineering (dynamic operation), and grid integration (renewable coupling).
Within the comparative analysis of Bioenergy with Carbon Capture and Storage (BECCS) and Direct Air Capture (DAC), the Levelized Cost of Carbon (LCOC) is a critical metric for evaluating economic viability. This whitepaper provides a technical dissection of the primary cost drivers for each technology and delineates research pathways for cost reduction, contextualized for researchers and process development professionals.
Current LCOC Estimates: A Comparative Baseline
The following table summarizes recent (2023-2024) LCOC estimates for prominent DAC and BECCS configurations, derived from peer-reviewed literature and industry reports. Costs are in USD per metric ton of CO₂ captured and stored.
Table 1: Current LCOC Estimates for DAC and BECCS Pathways
| Technology Pathway | Current Estimated LCOC Range (USD/t CO₂) | Primary Configuration Notes | Key Cost Driver References |
|---|---|---|---|
| DAC - Solid Sorbent (Low-Temp) | $450 - $900 | Modular, low-T (80-100°C) regeneration, grid-powered. | Energy consumption, sorbent lifetime & cost, capital costs. |
| DAC - Liquid Solvent (High-Temp) | $250 - $600 | Centralized, high-T (800-900°C) calcination, natural gas with CCS. | Heat source cost, plant scale, solvent degradation. |
| BECCS - Power Generation | $100 - $250 | Pulverized coal or biomass IGCC plant with post-combustion capture (amine). | Biomass feedstock cost & logistics, capture unit capital cost, penalty on plant efficiency. |
| BECCS - Ethanol Production | $50 - $150 | Bioethanol fermentation with CO₂ purification and compression. | Biomass cost, scale of biorefinery, compression energy. |
Deconstruction of Core Cost Drivers
Direct Air Capture Cost Drivers
- Energy Consumption: The single largest operational expense. DAC requires ~5-12 GJ/tonne CO₂, primarily for sorbent regeneration (thermal) and air contactor operation (electrical).
- Materials & Sorbent Lifetime: Solid sorbent performance degradation over adsorption-desorption cycles necessitates replacement, impacting both Capex and Opex. Liquid solvent corrosivity demands expensive materials of construction.
- Capital Intensity: The need for vast air contactor structures and specialized regeneration systems results in high upfront capital expenditure.
- Economic of Scale: Current pilot plants are small (<10 ktCO₂/yr). Scaling to megatonne capacity is unproven and carries significant financial risk.
BECCS Cost Drivers
- Biomass Feedstock: Cost, sustainability, and supply-chain logistics of biomass account for ~30-50% of total cost. Competition with other uses (feed, materials) creates price volatility.
- Integration Penalty: The energy penalty for CO₂ capture (10-25 percentage points of plant efficiency) reduces net output and revenue from electricity or biofuel sales.
- Capture Technology: While post-combustion capture (e.g., amine scrubbing) is mature, its application to biomass-derived flue gases may require customization, adding cost.
- Geological Storage Logistics: Pipeline networks from dispersed biomass facilities to storage sites incur significant additional capital and permitting costs.
Experimental Protocols for Key Cost-Reduction Research
Protocol: Accelerated Sorbent Lifetime Testing for DAC
Objective: Quantify degradation kinetics of novel solid sorbents under cyclic DAC conditions to project replacement costs. Materials: Test sorbent, simulated ambient air (410 ppm CO₂, 50% RH), regeneration gas (N₂ or steam), fixed-bed reactor system, mass spectrometer. Methodology:
- Conditioning: Load sorbent into reactor. Flush with dry N₂ at 25°C for 1 hour.
- Adsorption Cycle: Expose sorbent to simulated air at 25°C, 1 atm, 1 L/min. Monitor outlet CO₂ via MS until breakthrough (>400 ppm).
- Desorption Cycle: Switch to regeneration gas flow (1 L/min). Ramp temperature to target regeneration T (80-120°C). Hold until outlet CO₂ concentration returns to baseline.
- Acceleration: Repeat steps 2-3 for >10,000 cycles. Introduce periodic "stress" cycles with elevated humidity or temperature.
- Analysis: Every 500 cycles, perform a detailed adsorption isotherm. Measure total CO₂ capacity, kinetics, and structural changes (via BET, XRD).
Protocol: Techno-Economic Analysis (TEA) of Novel BECCS Integration
Objective: Model the LCOC impact of integrating a novel, lower-energy capture solvent into an existing biomass power plant. Materials: Process simulation software (Aspen Plus, ChemCAD), TEA software, performance data for novel solvent (loading capacity, heat of desorption, degradation rate). Methodology:
- Baseline Model: Develop a validated process model of a 100 MWe biomass plant with standard amine-based capture (MEA).
- Integration: Replace the MEA system block with the novel solvent's property package and unit operation models (absorber, stripper, heat exchangers).
- Parameter Variation: Run simulations across key variables: solvent circulation rate, stripper pressure/temperature, heat integration configurations.
- Cost Calculation: Using TEA software, calculate capital costs (equipment sizing) and operating costs (energy, solvent make-up) for each scenario.
- Sensitivity Analysis: Perform Monte Carlo simulations on critical input parameters (biomass cost, discount rate, solvent lifetime) to determine LCOC distribution and key cost drivers.
Visualizing Cost Reduction Pathways
Diagram 1: Cost reduction pathways for DAC and BECCS
The Scientist's Toolkit: Key Research Reagent Solutions
Table 2: Essential Materials for Carbon Capture Technology Research
| Reagent / Material | Function in Research | Key Considerations for Selection |
|---|---|---|
| Amino-Based Solvents (e.g., MEA, PZ, Novel Blends) | Benchmark liquid absorbent for CO₂ capture. Used in kinetic, degradation, and corrosion studies. | Purity, viscosity, vapor pressure, and thermal/oxidative stability under process conditions. |
| Metal-Organic Frameworks (MOFs) / Solid Amines | High-surface-area solid sorbents for DAC and post-combustion capture. Studied for capacity, selectivity, and stability. | Tunable pore chemistry, CO₂ adsorption isotherm shape, hydrothermal stability, and regeneration energy. |
| Carbon Anhydrase Mimics | Enzymatic catalysts to accelerate CO₂ hydration in liquid films, potentially reducing absorber size. | Catalytic activity in non-aqueous media, longevity under process conditions, and immobilization method. |
| Ionic Liquids | Low-vapor-pressure solvents for absorption. Research focuses on tailoring anions for physisorption or chemisorption. | CO₂ capacity, enthalpy of absorption, viscosity, cost, and compatibility with materials. |
| High-Temperature Alloys (e.g., Inconel, Hastelloy) | Materials for constructing test rigs and reactors, especially for high-T liquid DAC or advanced power cycles. | Resistance to chloride stress corrosion, amine corrosion, and carburization at high temperatures. |
| Isotopically Labeled CO₂ (¹³CO₂) | Tracer for studying carbon pathways in biological systems (BECCS) or verifying capture efficiency in complex gas streams. | Isotopic purity, delivery system compatibility (gas cylinders), and cost for large-scale experiments. |
Future Projections and Research Frontiers
Table 3: Projected LCOC Ranges and Key Innovation Needs
| Timeframe | DAC (Solid Sorbent) | DAC (Liquid Solvent) | BECCS (Power) | Primary Innovation Driver |
|---|---|---|---|---|
| 2030 | $200 - $400 | $150 - $300 | $80 - $180 | Scaling to first megatonne facilities; improved sorbent/solvent longevity. |
| 2040 | $100 - $200 | $80 - $150 | $40 - $100 | Full integration with low-cost renewable energy; advanced biomass logistics & gasification. |
| 2050 | <$100 | <$80 | <$60 | Widespread deployment, mature supply chains, and potential material breakthroughs. |
Critical research frontiers include:
- Materials Discovery: High-throughput screening of sorbents using machine learning models trained on crystal structure databases.
- Process Intensification: Development of novel reactor designs (e.g., rotating bed contactors, membrane contactors) to reduce capital cost and energy penalty.
- System Integration: Holistic optimization of BECCS within the biosphere and DAC within the energy system, including optimal use of waste heat and renewable electricity.
Lifecycle Analysis (LCA) and Addressing the Permanence of Carbon Storage
Within the critical evaluation of Bioenergy with Carbon Capture and Storage (BECCS) and Direct Air Capture (DAC), Lifecycle Analysis (LCA) is the foundational methodology for quantifying net carbon removal. A central and contentious parameter in these LCAs is the assumed permanence of carbon storage—the duration for which captured CO₂ remains isolated from the atmosphere. This whitepaper provides a technical guide to integrating storage permanence into LCAs for carbon dioxide removal (CDR) technologies, detailing quantification methods, experimental validation protocols, and essential research tools.
Quantifying Permanence: Key Metrics and Data
Permanence is not binary but a continuum, assessed through probabilistic models of storage reservoir integrity. Key quantitative metrics are summarized in Table 1.
Table 1: Comparative Permanence Metrics for BECCS and DAC Storage Pathways
| Storage Reservoir | Typical Scale (GtCO₂ potential) | Estimated Mean Retention Time (Years) | Primary Risk Mechanisms | Relevant to Technology |
|---|---|---|---|---|
| Deep Saline Formations | 1,000 - 20,000 | >10,000 | Caprock failure, fault reactivation, brine displacement | BECCS & DAC (Geological) |
| Depleted Oil/Gas Reservoirs | 100 - 1,000 | 1,000 - 10,000 | Wellbore leakage, seal integrity | BECCS & DAC (Geological) |
| Basalt Mineralization | Global potential vast | >100,000 | Limited; conversion to stable carbonate minerals | DAC (often co-located) |
| Terrestrial Biosphere (via BECCS) | 1 - 100 | 10 - 100 | Wildfire, pest outbreak, land-use change, saturation | BECCS-specific |
| Ocean Storage | Theoretical >10,000 | 100 - 1,000+ | Ocean circulation, acidification, ecological impact | Proposed for both |
Experimental & Modeling Protocols for Permanence Assessment
Protocol for Geological Storage Integrity Monitoring (Tracer Test)
Objective: To experimentally validate the containment of injected CO₂ and detect potential leakage in geological formations. Methodology:
- Co-Injection: Introduce a suite of geochemical and isotopic tracers (e.g., SF₆, perfluorocarbons, noble gas isotopes) with the CO₂ stream during injection.
- Monitoring Well Network: Establish a concentric network of shallow and deep monitoring wells equipped with pressure sensors, fluid samplers, and geophones.
- Time-Lapse Data Collection:
- Seismic: Conduct 4D seismic surveys pre-, during, and post-injection to map plume migration.
- Fluid Sampling: Periodically sample formation fluids from monitoring wells. Analyze for tracer presence and concentration using gas chromatography-mass spectrometry (GC-MS).
- Atmospheric Monitoring: Deploy tunable diode laser absorption spectrometers (TDLAS) or eddy covariance towers above the reservoir to detect surface fluxes of CO₂ and tracers.
- Data Analysis: Use inverse modeling to reconcile tracer detection data with reservoir simulation models, quantifying leakage rates (if any) and updating risk profiles.
Protocol for Terrestrial Carbon Stock Stability (Chronosequence & Perturbation Study)
Objective: To assess the vulnerability of biogenic carbon stocks (central to BECCS feedstock) to disturbances. Methodology:
- Chronosequence Establishment: Identify sites with BECCS-relevant biomass (e.g., fast-rotation forestry, perennial grasses) of varying stand ages (1, 5, 10, 20+ years).
- Baseline Stock Quantification: Measure above-ground biomass (allometric equations), below-ground biomass (soil coring), and soil organic carbon (SOC) via dry combustion.
- Controlled Perturbation: Implement standardized disturbance treatments on replicated plots:
- Fire Simulation: Apply controlled low-intensity burns.
- Drought Stress: Install rainfall exclusion shelters.
- Pest/Disease Inoculation: Introduce controlled biotic stressors.
- Post-Disturbance Monitoring: Track carbon flux (via chamber measurements or eddy covariance), litterfall, and soil respiration over multiple growing seasons. Re-quantify carbon stocks at study end.
- Model Calibration: Use data to parameterize and validate ecosystem models (e.g., DAYCENT, LPJ-GUESS) for projecting long-term stock stability under climate scenarios.
Visualization of LCA Integration and Risk Pathways
Diagram 1: LCA Framework Integrating Storage Permanence
Diagram 2: Permanence Risk Pathways for Storage Options
The Scientist's Toolkit: Key Research Reagent Solutions
Table 2: Essential Materials for Permanence Research Experiments
| Item / Reagent | Function / Application | Key Considerations |
|---|---|---|
| Perfluorocarbon Tracers (PFTs) | Chemical tracers co-injected with CO₂ for leak detection. Highly stable, detectable at ultra-low concentrations. | Selection based on background levels, multiple PFTs can be used for fingerprinting. |
| Stable Isotopes (¹³C, ¹⁸O in CO₂) | Isotopic labeling of injected CO₂ to distinguish it from natural background carbon sources. | Requires isotope ratio mass spectrometry (IRMS) for precise measurement. |
| Soil Organic Carbon (SOC) Standard (NIST SRM 2711) | Certified reference material for calibrating SOC quantification via dry combustion or spectroscopic methods. | Essential for ensuring data comparability across terrestrial carbon studies. |
| Gas Mixture Standards (CO₂ in N₂) | Calibration gases for sensors (TDLAS, GC) used in atmospheric and sub-surface monitoring. | Requires certified concentrations traceable to national standards. |
| Resazurin Dye Tablets | Microbial activity assay in soil cores. Indicates biogeochemical activity that could affect storage integrity. | Simple field test; correlates with CO₂ production potential. |
| Reservoir Brine Simulants | Synthetic formation fluids for laboratory-scale geochemical reactivity experiments (e.g., mineralization rates). | Must match target reservoir ion composition (Na⁺, K⁺, Ca²⁺, Mg²⁺, Cl⁻). |
| Allometric Equations (Species-Specific) | Mathematical models to convert non-destructive tree measurements (DBH, height) into biomass carbon stocks. | Must be validated for the specific species and ecoregion of study. |
Policy, Infrastructure, and Supply Chain Barriers to Mass Deployment
This whitepaper examines the systemic barriers to the mass deployment of two critical negative emissions technologies: Bioenergy with Carbon Capture and Storage (BECCS) and Direct Air Capture (DAC). Within the broader thesis comparing their potential, it is imperative to understand that their relative scalability and cost are not solely functions of technological maturity, but are fundamentally constrained by policy frameworks, infrastructure gaps, and supply chain vulnerabilities. This guide provides a technical and systemic analysis of these barriers for researchers and professionals evaluating pathways to gigaton-scale carbon removal.
Policy Barriers: A Comparative Framework
Policy mechanisms directly influence the economic viability and investment landscape for BECCS and DAC. Current frameworks are often misaligned with the long-term, capital-intensive nature of these technologies.
Table 1: Key Policy Barriers for BECCS vs. DAC
| Barrier Category | Impact on BECCS | Impact on DAC | Current Policy Gap (as of 2023) |
|---|---|---|---|
| Carbon Pricing & Credits | Requires robust price on avoided emissions from energy + removal; dual revenue stream uncertainty. | Reliant solely on high-value carbon removal credits; lacks parity with cheaper avoidance credits. | Average global carbon price ~$6/ton; 45Q tax credit (US) at $85/ton (DAC), $60/ton (BECCS) is insufficient for scale. |
| Sustainability Governance | Subject to complex land-use policies, biofuel mandates, and sustainability certification (e.g., EU RED II). | Less direct land-use impact, but faces regulations on energy sourcing, water use, and waste disposal. | No universal standard for "high-quality" carbon removal. Risk of bioresource competition and ILUC (Indirect Land Use Change) for BECCS. |
| Infrastructure Permitting | Requires permitting for CO2 pipeline networks and geological storage sites (Class VI wells in US). | Often colocated with storage, facing same sequestration permitting delays; additional air permits. | Class VI well permit approval takes >2 years; limited "zone" permitting for storage hubs. |
| Technology-Neutral Incentives | Often categorized as "energy" or "biofuel" technology, not purely CDR. | May benefit from R&D grants but lacks production-based incentives comparable to renewables. | Incentives are fragmented. BECCS may access renewable energy subsidies; DAC lacks analogous feed-in tariffs. |
Experimental Protocol 1: Policy Impact Simulation
- Objective: To model the effect of varying policy levers on the Levelized Cost of Carbon Removal (LCCR) for BECCS and DAC.
- Methodology:
- Baseline Model: Establish a techno-economic model for a representative BECCS (biomass power + capture) and DAC (solid sorbent) facility.
- Policy Variable Inputs: Define key variables: Carbon credit price ($/tCO₂), investment tax credit (%), 45Q-style subsidy ($/t), cost of capital (influenced by loan guarantees).
- Sensitivity Analysis: Run Monte Carlo simulations varying each policy lever independently and in combination.
- Output Metric: Calculate the reduction in LCCR required to reach a target $100/tCO₂ threshold for each technology under each policy scenario.
- Required Data: Capital Expenditure (CapEx), Operational Expenditure (OpEx), energy demand profiles, fuel costs, capacity factor, project lifetime.
Infrastructure & Supply Chain Analysis
Mass deployment at the gigaton-scale necessitates a radical build-out of supportive infrastructure and resilient supply chains.
Table 2: Infrastructure & Supply Chain Requirements and Barriers
| Component | BECCS Critical Needs | DAC Critical Needs | Current Bottlenecks & Risks |
|---|---|---|---|
| Feedstock | Sustainable biomass at scale (~1 Gt/yr for 1 GtCO₂ removed). | Atmospheric air (ubiquitous). | BECCS: Land competition, logistics, seasonal variability, pre-processing (drying, pelletizing). |
| Energy Supply | Moderate internal energy for capture; external energy for biomass processing. | Very high-quality heat (80-200°C) and electricity for sorbent regeneration. | DAC: Need for dedicated low-carbon, high-temperature heat sources (geothermal, nuclear, renewables+storage). Grid decarbonization is a prerequisite. |
| CO2 Transport | Extensive pipeline networks from distributed biomass facilities to sequestration sites. | Pipeline networks, potentially more centralized. | Critical Barrier: Lack of trunkline infrastructure. Need for ~60,000 miles of new CO2 pipeline in US by 2050 (NETL estimate). Right-of-way and public acceptance issues. |
| CO2 Sequestration | Access to verified geological storage basins (saline aquifers, depleted reservoirs). | Identical need for geological storage. | Limited characterization of saline aquifers; slow permitting (Class VI); pore space ownership legalities. |
| Material Supply Chain | Standard power plant and amine-based capture materials. | Specialized sorbents (e.g., amine-functionalized) or solvents; large fans/contactors. | DAC: Scale-up of sorbent manufacturing (KOH, amines); competition for critical minerals (for system construction). |
Experimental Protocol 2: Supply Chain Resilience Stress Test
- Objective: To assess the vulnerability of BECCS and DAC scale-up plans to disruptions in critical material supply.
- Methodology:
- Bill of Materials (BOM): Develop a detailed BOM for a 1 MtCO₂/yr DAC plant (solid sorbent system) and a 100 MW BECCS plant.
- Identify Critical Path Items: Flag components with single-source suppliers, geopolitical concentration (e.g., China for KOH), or long lead times (e.g., large-scale compressors).
- Disruption Modeling: Apply a discrete event simulation model. Introduce shocks: 50% price increase for amines, 6-month delay in compressor delivery, export restriction on a key material.
- Impact Analysis: Measure the effect on project timeline (delay in months) and capital cost overrun (%).
- Required Data: Detailed equipment lists, supplier geographic data, material price volatility history, global trade flow data for chemicals.
The Scientist's Toolkit: Research Reagent Solutions for CDR Systems Testing
Table 3: Key Research Reagents & Materials for BECCS/DAC Experimental Research
| Item | Function in Research | Example Application |
|---|---|---|
| Amine-functionalized Sorbents (e.g., PEI-silica, AMS sorbents) | Solid chemisorbent for capturing CO₂ from low-concentration streams. | Lab-scale DAC contactor testing; measuring adsorption isotherms and kinetics. |
| Potassium Hydroxide (KOH) Solution | Strong liquid alkali sorbent for CO₂ capture via carbonate formation. | DAC research using liquid sorbent pathways; studying corrosion and regeneration energy. |
| 13C-Labeled CO₂ | Isotopically labeled tracer gas for tracking carbon flow and fate. | Verifying carbon capture efficiency and detecting leaks in integrated capture-storage experiments. |
| Model Flue Gas Mixtures | Custom gas blends simulating biomass combustion exhaust (CO₂, N₂, O₂, H₂O, impurities). | Testing BECCS capture solvents (e.g., MEA) under realistic conditions. |
| Brønsted Acid-Base Indicators (e.g., phenolphthalein) | pH-sensitive dyes for visualizing CO₂ absorption and sorbent saturation. | Qualitative demonstration of CO₂ capture in liquid solvents or on wet sorbents. |
| Porous Support Materials (e.g., γ-Alumina, activated carbon, MOFs) | High-surface-area substrates for supporting active capture materials. | Researching next-generation sorbents with improved capacity and stability. |
| Simulated Brine Formulations | Synthetic groundwater matching the ionic composition of deep saline aquifers. | Geochemical experiments on CO₂-brine-rock interactions for storage integrity. |
Visualizations of Systemic Barriers and Workflows
Diagram 1: CDR Deployment System Feedback Loops
Diagram 2: BECCS and DAC Process Chains Compared
Head-to-Head Validation: Comparing Potential, Readiness, and Role in Climate Scenarios
Within the broader thesis comparing the potential of Bioenergy with Carbon Capture and Storage (BECCS) and Direct Air Capture (DAC), this technical guide provides a detailed analysis of their respective Technological Readiness Levels (TRLs) and projected scalability timelines. This assessment is critical for researchers, scientists, and policy analysts to understand the pathways and constraints for deploying these critical carbon dioxide removal (CDR) technologies at climate-relevant scales.
BECCS (Bioenergy with Carbon Capture and Storage)
BECCS integrates biomass energy conversion (e.g., combustion, gasification) with post-combustion, pre-combustion, or oxy-fuel carbon capture systems. The captured CO₂ is then compressed, transported, and sequestered in geological formations. It is considered a "negative emissions technology" because the biomass absorbs CO₂ from the atmosphere during growth.
DAC (Direct Air Capture)
DAC technologies actively separate CO₂ from ambient air using chemical or physical processes. Two primary approaches dominate:
- Liquid-DAC (L-DAC): Uses an aqueous basic solution (e.g., potassium hydroxide) to absorb CO₂, followed by a series of regeneration steps to produce pure CO₂.
- Solid-DAC (S-DAC): Uses solid amine-functionalized or metal-organic framework (MOF) sorbents that bind CO₂ at ambient conditions and release it under applied heat and/or vacuum.
TRL Assessment and Comparative Data
The table below summarizes the current TRL, key technology variants, and associated challenges based on recent pilot and demonstration projects (2022-2024).
Table 1: Comparative TRL Assessment for BECCS and DAC
| Parameter | BECCS | DAC (Solid Sorbent) | DAC (Liquid Solvent) |
|---|---|---|---|
| Representative TRL | TRL 7-9 (System proven in operational environment to full-scale commercial). | TRL 6-7 (Technology demonstrated in relevant environment). | TRL 6-8 (Technology demonstrated to pilot in operational environment). |
| Key Variants | Post-combustion capture on biomass power plant; Biomass gasification with pre-combustion capture. | Vacuum-Temperature Swing Adsorption (VTSA) with amine-functionalized sorbents. | KOH/K2CO3 solution with pellet reactor for CaCO3 precipitation and calciner. |
| Leading Projects | Drax BECCS Pilot (UK), Illinois Industrial CCS (USA). | Climeworks 'Orca' & 'Mammoth' (Iceland), CarbonCapture Inc. 'Project Bison' (USA). | Carbon Engineering 'STRATUS' (USA, under construction). |
| Primary Challenge | Sustainable biomass feedstock supply & logistics; high capital cost for integrated systems. | Sorbent degradation over cycles; managing heat for regeneration efficiently. | High thermal energy demand for calcination (~900°C); solvent management. |
| Integration Status | Highly integrated with existing bioenergy/industrial infrastructure. | Modular, scalable units suitable for colocation with low-cost heat/renewable energy. | Large-scale plant design requiring significant heat and power integration. |
Scalability Timelines and Projections
Scalability is defined by the potential rate of deployment and the ultimate capacity, constrained by engineering, resource availability, and economic factors.
Table 2: Scalability Timelines and Projections to 2050
| Metric | BECCS | DAC (Aggregate) | Notes & Key Dependencies |
|---|---|---|---|
| Current Deployed Capacity | ~2 MtCO₂/yr (captured and stored, primarily in bioethanol) | ~0.01 MtCO₂/yr (operational plants) | IEA 2023 data. BECCS lead is due to retrofits in bioprocessing. |
| 2030 Projection (IEA NZE) | ~250 MtCO₂/yr | ~85 MtCO₂/yr | Requires dramatic policy support and investment acceleration. |
| 2050 Projection (IEA NZE) | ~1.8 GtCO₂/yr | ~1.2 GtCO₂/yr | Represents a substantial portion of total CDR in modeled pathways. |
| Key Scalability Bottlenecks | 1. Biomass supply sustainability. 2. CO₂ transport & storage (T&S) network development. 3. Public acceptance of storage. | 1. Energy/heat demand (8-12 GJ/tCO₂). 2. Rate of manufacturing for modular units or plant construction. 3. CO₂ T&S network development. | DAC energy needs must be met by zero-carbon sources to ensure net negativity. |
| Critical Path Items | • Certification of sustainable biomass. • Final investment decisions (FID) on full-chain, power-generation BECCS. | • FID on first >1Mt/yr facilities. • Demonstration of sorbent/solvent lifetime (>100,000 cycles). • Securing low-cost, clean heat. | Next 5-10 years are critical for demonstration and learning-by-doing. |
Experimental Protocols for Key Performance Validation
Protocol: Solid-DAC Sorbent Cycling Stability Test
Objective: Determine the adsorption capacity degradation of an amine-impregnated sorbent over repeated Vacuum-Temperature Swing Adsorption (VTSA) cycles.
Methodology:
- Sorbent Preparation: Impregnate mesoporous silica support with 50 wt% polyethylenimine (PEI). Dry at 80°C under vacuum for 12 hours.
- Fixed-Bed Reactor Setup: Load 10 g of sorbent into a stainless-steel tubular reactor. Instrument with thermocouples at inlet, bed, and outlet.
- Adsorption Cycle: At 25°C, expose sorbent to a simulated air stream (400 ppm CO₂, balance N₂) at a flow rate of 1 L/min. Monitor outlet CO₂ concentration via NDIR analyzer until breakthrough (>400 ppm).
- Desorption Cycle: Isolate feed. Apply vacuum (<0.1 bar) and increase bed temperature to 80-100°C using external heater. Maintain for 30 minutes, collecting desorbed CO₂ in a calibrated volume.
- Measurement: Calculate CO₂ adsorbed (mmol/g) from integration of breakthrough curve or from mass of CO₂ collected during desorption.
- Repetition: Repeat steps 3-5 for a target of 10,000 cycles. Sample sorbent at 0, 100, 1000, 5000, and 10,000 cycles for thermogravimetric analysis (TGA) and Fourier-transform infrared spectroscopy (FTIR) to analyze chemical degradation.
Protocol: BECCS Integration Lifecycle Assessment (LCA)
Objective: Quantify the net carbon removal and environmental impacts of a BECCS value chain.
Methodology:
- System Boundaries: Define "cradle-to-grave" scope: biomass cultivation/harvesting, transport, conversion (power plant), CO₂ capture, compression, transport (pipeline), and geological storage.
- Inventory Analysis (LCI): For 1 kWh of net electricity output and associated captured CO₂:
- Feedstock: Collect data on fertilizer use, diesel for machinery, land-use change emissions for biomass.
- Conversion & Capture: Use plant operational data (natural gas backup, chemicals like amine for capture, electricity parasitism) from a pilot facility (e.g., Drax).
- Transport & Storage: Include emissions from pipeline construction and operation, and energy for injection site monitoring.
- Impact Assessment (LCIA): Calculate using software (e.g., openLCA) with databases (ecoinvent):
- Key Metric: Net CO₂ Removal = (Biogenic CO₂ captured and stored) - (Total lifecycle fossil CO₂-eq emissions from the value chain).
- Other Impacts: Assess land use, water consumption, and eutrophication potential.
- Sensitivity Analysis: Model scenarios varying biomass type (switchgrass vs. forestry residues), transport distance, and capture efficiency (85% vs. 95%).
Technology Development Pathways Visualization
Diagram Title: TRL Progression Pathways for BECCS and DAC Technologies
The Scientist's Toolkit: Key Research Reagent Solutions
Table 3: Essential Materials for BECCS and DAC Laboratory Research
| Item | Function/Application | Example Product/Composition |
|---|---|---|
| Amine-Functionalized Sorbents | Solid adsorbent for DAC (S-DAC) and post-combustion capture. High CO₂ selectivity and capacity at low partial pressure. | PEI-impregnated SBA-15, Class 1 MOFs (e.g., Mg-MOF-74), Amine-grafted silica. |
| Aqueous Basic Solvents | Absorbent for Liquid-DAC (L-DAC) and post-combustion capture. Chemically reacts with CO₂. | Potassium Hydroxide (KOH), Sodium Hydroxide (NaOH), promoted Potassium Carbonate (K₂CO₃). |
| Biomass Model Compounds | Representative substances for studying gasification/pyrolysis kinetics and tar formation in BECCS. | Cellulose, Xylan, Lignin (Kraft, organosolv). |
| Supported Amine Catalysts | For catalytic CO₂ desorption or solvent regeneration, lowering energy penalty. | Cs-P/Al₂O₃, DEA/TiO₂. |
| Corrosion Inhibitors | Added to capture solvents (especially amine-based) to mitigate degradation of industrial plant materials. | Sodium metavanadate, Copper carbonate. |
| Tracer Gases | Used in breakthrough curve experiments to characterize sorbent kinetics and pore structure. | N₂, He, SF₆. |
| NDIR CO₂ Analyzer | Critical analytical instrument for real-time, precise measurement of CO₂ concentration in gas streams. | Vaisala CARBOCAP, LI-COR LI-850. |
| Thermogravimetric Analyzer (TGA) | Measures sorbent weight change during adsorption/desorption cycles to determine capacity and degradation. | Netzsch STA, TA Instruments Discovery. |
This whitepaper provides a comparative technical analysis of the resource footprints of Bioenergy with Carbon Capture and Storage (BECCS) and Direct Air Capture (DAC) as critical negative emissions technologies (NETs). The analysis is framed within a broader research thesis evaluating the comparative potential, scalability, and sustainability of these two pathways for achieving gigaton-scale carbon dioxide removal (CDR). The assessment focuses on three critical resource dimensions: energy consumption (GJ/tCO₂), land use (m²/tCO₂), and water withdrawal/consumption (m³/tCO₂), which are pivotal for strategic R&D and policy decisions.
Table 1: Comparative Resource Footprints for BECCS and DAC Technologies
| Technology Pathway | Energy Demand (GJ/tCO₂) | Land Use (m²/tCO₂) | Water Footprint (m³/tCO₂) | Technology Readiness Level (TRL) | Reported CO2 Removal Cost (USD/tCO₂) |
|---|---|---|---|---|---|
| BECCS (Biomass Power) | 2.5 - 5.5 (for capture & compression; biomass growth energy not included) | 1,000 - 10,000 (Highly variable with biomass yield) | 1 - 100 (Withdrawal); 0.5 - 50 (Consumption) | 6-8 (First commercial plants) | 50 - 200 |
| BECCS (Bioethanol Refinery) | 1.8 - 3.0 | 500 - 5,000 | 50 - 300 (Withdrawal) | 8-9 (Operational at scale) | 30 - 120 |
| DAC (Solid Sorbent - Low Temp) | 5.0 - 12.0 (Thermal: 3-8 GJ; Electrical: 0.5-2 GJ) | 0.5 - 5 (Facility footprint only) | 0.5 - 5 (Mostly for humidity control) | 6-7 (Pilot scale) | 200 - 600 |
| DAC (Liquid Solvent - High Temp) | 7.0 - 15.0 (Thermal: 5-10 GJ @ >800°C) | 0.5 - 5 | 1 - 10 (Evaporative losses) | 5-6 (Lab/Pilot) | 300 - 800 |
Data synthesized from recent (2023-2024) peer-reviewed LCAs, industry reports (e.g., IEA, IPCC SR1.5), and operator disclosures (e.g., Climeworks, Carbon Engineering). Ranges reflect variance in process design, feedstock, and geographic context.
Key Inferences: BECCS exhibits orders-of-magnitude higher land and water footprints, intrinsically linked to biomass cultivation. DAC minimizes land/water use but demands concentrated, high-grade energy, primarily for sorbent regeneration. The "energy penalty" per tonne CO₂ removed is currently higher for DAC but is projected to decrease with innovation.
Experimental Protocols for Resource Footprint Analysis
Protocol: Life Cycle Assessment (LCA) for BECCS Resource Accounting
Objective: Quantify cradle-to-grave energy, land, and water footprints per net tonne of CO₂ removed and stored. Methodology:
- Goal & Scope Definition: Define functional unit (e.g., 1 net tonne CO₂ sequestered), system boundaries (includes biomass cultivation, transport, conversion, CCS, indirect land use change (iLUC)).
- Inventory Analysis (LCI):
- Energy: Collect data on fossil/procured electricity & heat for biorefinery/plant operation and CCS unit. For biomass growth, account for fertilizer production, farm machinery fuel.
- Land: Map biomass cultivation area (hectares). Model iLUC using economic equilibrium models (e.g., GTAP).
- Water: Measure irrigation water (blue water) from hydro-geological models, process water for biorefinery.
- Impact Assessment (LCIA): Use metrics: Cumulative Energy Demand (CED) (GJ), Land Occupation (annual m²), and Water Scarcity-Weighted Withdrawal (m³ world eq.).
- Interpretation: Calculate net footprint by subtracting credits for displaced products (e.g., electricity). Sensitivity analysis on biomass yield, transport distance, and soil carbon changes is critical.
Protocol: Bench-Scale DAC Sorbent Cycling & Energy Measurement
Objective: Empirically determine the thermal and electrical energy requirement per cycle for a novel solid sorbent under controlled conditions. Methodology:
- Apparatus: Fixed-bed reactor, mass flow controllers for simulated air (400 ppm CO₂), humidity generator, thermocouples, downstream NDIR CO₂ analyzer, calorimeter.
- Adsorption Phase: Expose a known mass (e.g., 10g) of sorbent to a humidified 400 ppm CO₂ stream at 25°C. Monitor CO₂ breakthrough via NDIR. Conclude at saturation (outlet ≈ inlet concentration).
- Desorption & Measurement: Isolate reactor. Initiate temperature-programmed desorption (TPD) to 80-120°C (low-T sorbent) using an electric furnace. Capture eluted, concentrated CO₂.
- Electrical Energy: Record integrated power (kWh) to heaters and blowers.
- Thermal Energy: Use calorimetry to measure total heat (Q) input to achieve complete regeneration.
- Calculation: Energy per tonne CO₂ = (Total Energy Measured per Cycle [GJ]) / (Mass CO₂ Captured per Cycle [t]).
Visualizations: System Dynamics & Workflows
Diagram 1: BECCS and DAC System Boundaries for LCA
Diagram 2: DAC Sorbent Energy Measurement Workflow
The Scientist's Toolkit: Key Research Reagent Solutions
Table 2: Essential Research Materials for NETs Resource Analysis
| Reagent / Material | Supplier Examples | Function in Research |
|---|---|---|
| Amino-Functionalized MOF Sorbent (e.g., MOF-808-CHI) | Sigma-Aldrich, ProfMOF | High-capacity, selective solid adsorbent for bench-scale DAC energy and cycling studies. |
| Potassium Hydroxide (KOH) / Calcium Hydroxide (Ca(OH)2) | Fisher Scientific, VWR | Liquid solvent components for wet-scrubbing DAC; used in equilibrium and kinetic studies. |
| 13C-Labeled CO2 Gas Cylinder | Cambridge Isotopes | Tracer for precise measurement of carbon flows in BECCS soil-carbon or DAC system studies. |
| LI-COR LI-850 NDIR CO2/H2O Analyzer | LI-COR Biosciences | High-precision, real-time measurement of CO2 concentrations in gas streams (e.g., breakthrough curves). |
| Miscanthus x giganteus Rhizomes | Commercial nurseries | Standardized, high-yield perennial biomass crop for controlled BECCS agronomy trials. |
| Life Cycle Inventory Database (e.g., ecoinvent v4) | ecoinvent Centre | Primary source of background energy, material, and agronomic data for LCA modeling. |
| Soil Carbon Analysis Kit (Dry Combustion) | Elementar, Costech | Quantifies soil organic carbon changes associated with BECCS feedstock cultivation. |
| Water Scarcity Characterization Factors (WAVE model) | WULCA group | Converts water inventory data into scarcity-weighted impacts for LCIA. |
This whitepaper provides a technical analysis of the economic drivers and commercial viability of Bioenergy with Carbon Capture and Storage (BECCS) and Direct Air Capture (DAC). Framed within a broader comparative thesis, the analysis focuses on cost structures, the influence of credit markets, and pathways to scalability for researchers and applied scientists in climate technology development.
Cost Curve Analysis: BECCS vs. DAC
The levelized cost of carbon abatement is the primary metric for comparing technologies. Current data (2023-2024) reveals distinct cost profiles, driven by capital intensity, energy requirements, and feedstock logistics.
Table 1: Comparative Cost Structure Analysis (2024 Estimates)
| Cost Component | BECCS (Biomass Power) | DAC (Liquid Sorbent) | DAC (Solid Sorbent) |
|---|---|---|---|
| Capital Expenditure (CAPEX) | $2,800 - $4,500 / tCO₂/yr | $600 - $1,000 / tCO₂/yr | $800 - $1,200 / tCO₂/yr |
| Operating Expenditure (OPEX) | $40 - $120 / tCO₂ | $250 - $600 / tCO₂ | $150 - $400 / tCO₂ |
| Energy Consumption | 3-5 GJ/tCO₂ (for capture) | 5-10 GJ/tCO₂ (thermal), 1-1.5 MWh/tCO₂ (electrical) | 4-8 GJ/tCO₂ (thermal), 0.5-1 MWh/tCO₂ (electrical) |
| Current Cost Range | $80 - $200 / tCO₂ | $400 - $800 / tCO₂ | $250 - $600 / tCO₂ |
| Long-Term Cost Target | <$60 / tCO₂ | <$150 / tCO₂ | <$100 / tCO₂ |
| Key Cost Drivers | Biomass feedstock price & logistics, plant scale, storage proximity | Energy cost, sorbent degradation, plant utilization rate | Sorbent cycle lifetime, thermal energy source, module manufacturing |
Sources: IEA (2023), NREL (2024), Oxford Smith School (2023), Direct Industry Reports.
Credit Markets & Policy Mechanisms
Commercial viability is inextricably linked to carbon credit and policy support frameworks. These mechanisms de-risk investment and generate revenue.
Table 2: Key Commercialization Mechanisms & Impact
| Mechanism | Description | Current Value/Impact | BECCS Relevance | DAC Relevance |
|---|---|---|---|---|
| 45Q Tax Credit (US) | Credit per ton of CO₂ sequestered. | $85/t (geologic), $60/t (utilization) | High (fits existing bio-energy) | High (primary driver for first plants) |
| California LCFS | Generates tradeable credits for low-carbon fuels. | ~$70 - $100 / tCO₂e | Very High (for biofuels pathway) | Moderate (for synthetic fuels) |
| Voluntary Carbon Market | Corporations buy offsets for ESG goals. | $5 - $30 / tCO₂e (nature-based), $100 - $500 / tCO₂ (tech-based) | Moderate (must demonstrate additionality) | High (premium for engineered removal) |
| EU ETS & Innovation Fund | Cap-and-trade, plus funding for innovative tech. | ~€80 / tCO₂ (ETS price) | High (for negative emissions) | High (large-scale project funding) |
| UK & Swiss Contracts for Difference | Government auctions for carbon removal. | £100 - £200 / tCO₂ (UK pilot) | High | High |
Experimental Protocol: Techno-Economic Assessment (TEA) for Comparative Analysis
A standardized TEA is critical for objective comparison. The following protocol details the methodology.
Protocol Title: Standardized Techno-Economic Assessment (TEA) for CDR Technologies
Objective: To model and compare the levelized cost of carbon dioxide removed (LCOD) for BECCS and DAC pathways under consistent boundary conditions.
Materials & Software:
- Process modeling software (e.g., Aspen Plus, Python-based chemical process models)
- Financial modeling platform (Excel, MATLAB)
- Datasets: regional biomass costs, grid electricity mix & cost, natural gas prices, labor rates.
Procedure:
System Boundary Definition:
- For BECCS: Define "plant gate to sequestration site." Include biomass cultivation/transport, conversion (e.g., gasification + combustion), CO₂ capture (amine scrubber), compression, transport (pipeline, ≤300 km), and geological injection.
- For DAC: Define "air contact to sequestration site." Include air contactor, sorbent regeneration cycle, CO₂ purification/compression, transport, and injection.
Process Modeling & Mass-Energy Balance:
- Develop a detailed process flow diagram (PFD).
- Model key unit operations to determine total energy (thermal, electrical) and material (sorbent, water, chemicals) flows per ton of CO₂ captured.
- Use pilot plant data for key parameters (sorbent cycling stability, capture rate, biomass conversion efficiency).
Capital Cost (CAPEX) Estimation:
- Use equipment factoring ("bare erected cost") based on major process equipment costs.
- Apply location-specific factors for installation, indirect costs, and contingency (20%).
- Annualize CAPEX using a capital recovery factor (CRF) based on a defined discount rate (e.g., 8%) and plant lifetime (30 years).
Operating Cost (OPEX) Estimation:
- Variable OPEX: Calculate costs for energy, feedstock (biomass for BECCS), sorbent/chemical makeup, waste disposal, and transportation.
- Fixed OPEX: Estimate costs for labor, maintenance (3-4% of CAPEX), insurance, and overhead.
Co-product Revenue & Credit Integration:
- For BECCS: Model revenue from electricity or biofuel sales based on market prices.
- For DAC: Account for potential oxygen sales if applicable.
- Integrate policy credits (e.g., 45Q) as a direct reduction in LCOD.
Levelized Cost Calculation:
- Calculate LCOD using the formula:
LCOD = (Annualized CAPEX + Annual OPEX - Annual Co-product Revenue) / (Annual Net CO₂ Sequestered) - Net CO₂ Sequestered: Gross captured CO₂ minus emissions from embodied energy and process inputs (Life Cycle Assessment required).
- Calculate LCOD using the formula:
Sensitivity & Monte Carlo Analysis:
- Identify 5-7 key cost drivers (e.g., biomass price, electricity cost, discount rate).
- Perform a sensitivity analysis (±30% on each variable) to create a tornado plot.
- Run a Monte Carlo simulation (10,000 iterations) with defined probability distributions for key inputs to generate a probability distribution of LCOD.
Visualization of Commercialization Pathways
Title: Drivers of CDR Technology Commercialization
The Scientist's Toolkit: Key Reagents & Materials for Core Experiments
Table 3: Essential Research Reagents & Materials
| Item | Function in Research Context | Example in BECCS/DAC Research |
|---|---|---|
| Amine-based Sorbents (e.g., MEA, PZ) | Benchmark liquid chemical absorbent for CO₂ capture. Used for kinetic and thermodynamic studies. | BECCS: Post-combustion capture from flue gas. DAC: Baseline for liquid DAC systems. |
| Solid Sorbents (e.g., MOFs, Amine-functionalized Silica) | High-surface-area materials with selective CO₂ adsorption. Studied for cycling stability & capacity. | DAC (Primary): Core material for low-energy, temperature-vacuum swing cycles. |
| Stable Isotope ¹³CO₂ | Tracer for precise measurement of carbon flow, sequestration verification, and leak detection. | Both: Used in lab-scale sequestration experiments and field monitoring. |
| Gas Chromatograph (GC) / Mass Spectrometer (MS) | Analytical instrument for quantifying gas composition (CO₂, CH₄, O₂, N₂) and purity. | Both: Critical for measuring capture efficiency and output stream purity. |
| Thermogravimetric Analyzer (TGA) | Measures changes in material mass as a function of temperature. Key for sorbent performance. | Both: Determines CO₂ adsorption capacity, kinetics, and degradation over multiple cycles. |
| Process Mass Spectrometer | Real-time, continuous gas analysis for process monitoring and control. | Both: Used in integrated pilot plants to optimize energy input and capture rate. |
| Porous Sandstone Core Samples | Geological reservoir analogs for studying CO₂ injection, flow, and mineralization. | Both: Used in lab-scale sequestration experiments to understand storage integrity. |
| Life Cycle Assessment (LCA) Database (e.g., ecoinvent) | Inventory of environmental impacts for materials and energy. Essential for net negativity calculation. | Both: Quantifying the net carbon removed after accounting for embodied process emissions. |
Integrated Assessment Models (IAMs) are the primary analytical tools used to inform the Intergovernmental Panel on Climate Change (IPCC) assessment reports, particularly in developing mitigation pathways consistent with the Paris Agreement's long-term temperature goals. This whitepaper examines the integrated role of IPCC and IAMs in projecting pathways for 1.5°C and 2°C scenarios. The analysis is framed within a broader research thesis comparing the potential of Bioenergy with Carbon Capture and Storage (BECCS) and Direct Air Capture (DAC) as critical negative emission technologies (NETs). For researchers and scientists, understanding this integration is essential for evaluating the assumptions, limitations, and projected deployment scales of these technologies in authoritative climate scenarios.
The IPCC-IAM Framework for Pathway Development
IAMs combine insights from climate science, economics, and energy systems to project future greenhouse gas (GHG) emissions and assess the costs and feasibility of mitigation strategies. The IPCC's Sixth Assessment Report (AR6) and the subsequent Special Report on 1.5°C (SR1.5) rely heavily on scenario ensembles from multiple IAM frameworks (e.g., IMAGE, MESSAGEix-GLOBIOM, REMIND-MAgPIE).
Core Function: IAMs generate mitigation pathways by optimizing energy supply, demand, and land-use under constraints (e.g., carbon budgets, technology availability). The IPCC synthesizes these results, assessing their consistency, feasibility, and implications, thereby translating model outputs into policy-relevant knowledge.
Quantitative Projections for 1.5°C and 2°C Pathways
The following tables summarize key quantitative data from recent IPCC AR6 and SR1.5 scenario databases, highlighting the roles of carbon dioxide removal (CDR), with a focus on BECCS and DAC.
Table 1: Key Characteristics of Mitigation Pathways (2100 Averages)
| Parameter | 1.5°C with No or Limited Overshoot (<1.5°C) | 1.5°C with High Overshoot (>1.5°C, return by 2100) | Below 2°C |
|---|---|---|---|
| CO₂ Budget from 2020 (GtCO₂) | 500 | 650-800 | 1150-1350 |
| Peak Warming (°C) | 1.5-1.6 | 1.6-1.8 | 1.7-1.9 |
| Year of Net-Zero CO₂ | 2050-2055 | 2055-2065 | 2070-2085 |
| Total CDR by 2100 (GtCO₂) | 400-800 | 600-1100 | 300-700 |
| BECCS Deployment by 2100 (GtCO₂/yr) | 5-10 | 10-15 | 2-8 |
| DACCS Deployment by 2100 (GtCO₂/yr) | 0-5 | 2-8 | 0-3 |
| Electricity Share of Total Energy | 50-60% | 45-55% | 40-50% |
Table 2: Projected Cumulative CDR Deployment by 2100 (GtCO₂)
| CDR Method | Median in 1.5°C No/Low Overshoot | Median in Below 2°C | Key IAM Modeling Assumptions |
|---|---|---|---|
| BECCS | 320 | 180 | Biomass feedstock sustainability limits, CCS capture rate (~90%), land-use competition. |
| DACCS | 120 | 40 | Energy source (low-carbon), capital cost learning rates, thermal vs. electrical processes. |
| Afforestation/ Reforestation | 180 | 150 | Saturation over time, permanence risks, land availability. |
| Enhanced Weathering | 40 | 20 | Scaled availability of silicate rocks, application logistics. |
Experimental & Modeling Protocols for NETs Evaluation
The comparative potential of BECCS and DAC in IAMs is derived from underlying experimental and techno-economic data. Below are summarized protocols for key studies that feed into IAM parameterization.
Protocol 4.1: Techno-Economic Analysis (TEA) for DAC Systems
- Objective: Determine the levelized cost of CO₂ captured for solid sorbent (SS) and liquid solvent (LS) DAC systems.
- Methodology:
- Process Modeling: Use Aspen Plus or similar software to simulate mass and energy balances for a reference plant (1 MtCO₂/yr capacity).
- Capital Cost Estimation: Employ equipment factoring methods based on primary energy consumption (heat for LS, electricity for SS) and major unit operations (contactors, regenerators, compressors).
- Operational Cost Estimation: Include costs for sorbent/solvent makeup, waste disposal, maintenance, and labor.
- Sensitivity Analysis: Vary key parameters: energy cost ($/GJ), capacity factor, sorbent lifetime, and capital recovery factor.
- Output: A cost range (e.g., $150-$500/tCO₂) and identification of major cost drivers for input into IAM technology cost curves.
Protocol 4.2: Life Cycle Assessment (LCA) for BECCS Systems
- Objective: Quantify the net-negative emissions potential and environmental trade-offs of a BECCS value chain.
- Methodology:
- Goal & Scope: Define system boundaries from biomass cultivation to geological storage. Functional unit: 1 tonne of CO₂ removed from the atmosphere.
- Inventory Analysis: Collect data on: biomass yield (t/ha), fertilizer inputs, N₂O emissions from soil, biomass transport, conversion efficiency (e.g., IGCC with CCS), CO₂ capture rate, transport, and injection.
- Impact Assessment: Calculate Global Warming Potential (GWP) using IPCC factors. Account for biogenic carbon flows, indirect land-use change (iLUC) emissions if modeled.
- Uncertainty Analysis: Use Monte Carlo simulation to propagate uncertainties in key parameters (yield, soil N₂O, capture rate).
- Output: Net carbon removal (tCO₂eq/t biomass) and identification of potential burden-shifting (e.g., eutrophication, acidification).
Visualization of IAM-NET Integration Logic
Title: IAM and IPCC Integration Logic for CDR
Title: BECCS and DAC Shared Value Chain
The Scientist's Toolkit: Key Research Reagent Solutions
Table 3: Essential Materials for NETs Research
| Item/Category | Function in Research | Example/Notes |
|---|---|---|
| Solid Sorbents for DAC | Chemically bind CO₂ from air for low-temperature release. | Aminopolymer-silica composites (e.g., PEI on SiO₂). Key metrics: CO₂ capacity (mmol/g), stability over cycles. |
| Liquid Solvents for DAC | Absorb CO₂ into aqueous solution for thermal regeneration. | Potassium hydroxide (KOH) → K₂CO₃ precipitation. High corrosivity and energy penalty for regeneration. |
| Gasification Catalysts | Promote syngas production and tar reforming in BECCS. | Nickel-based catalysts on Al₂O₃ support. Prone to sulfur poisoning; require cleaning. |
| CO₂ Capture Solvents (Post-Combustion) | Separate CO₂ from flue gas in BECCS plants. | Monoethanolamine (MEA), advanced amines (e.g., KS-1). Research focuses on degradation resistance and lower regeneration energy. |
| Stable Isotope Tracers | Track carbon flows in LCA and verify sequestration. | ¹³C-labeled CO₂ for DAC pilot studies. ¹⁴C for differentiating biogenic vs. fossil carbon in storage monitoring. |
| Porous Media for Storage Studies | Simulate geological sequestration in lab. | Berea sandstone cores, synthetic silica packs. Used in core flooding experiments to measure trapping efficiency. |
| Life Cycle Inventory (LCI) Databases | Provide background data for LCA of NET systems. | Ecoinvent, GREET. Contain data on material/energy inputs, upstream emissions. |
Within the critical discourse on achieving net-negative emissions, Bioenergy with Carbon Capture and Storage (BECCS) and Direct Air Capture (DAC) are often positioned as competing technological pathways. This whitepaper synthesizes current research to argue that their roles are fundamentally complementary within a robust portfolio of climate solutions. The core thesis is that BECCS and DAC address different points in the carbon cycle, possess distinct resource profiles, and are optimized for different deployment scales and timelines, making strategic integration more effective than direct competition.
Core Technological Pathways & Comparative Analysis
Diagram 1: BECCS and DAC in the Carbon Cycle
Table 1: Comparative Technical & Economic Potential (2023-2024 Data)
| Parameter | BECCS | Direct Air Capture (Solid Sorbent) |
|---|---|---|
| Technology Readiness Level (TRL) | 7-9 (First commercial plants) | 6-7 (First-of-a-kind commercial plants) |
| Theoretical Energy Intensity (GJ/tCO₂) | 2-8 (Primarily for capture) | 5-12 (Thermal for sorbent regeneration + electrical) |
| Current Cost Range (USD/tCO₂) | $80 - $200 | $500 - $1000 |
| Projected 2050 Cost (USD/tCO₂) | $30 - $100 | $100 - $300 |
| Land Use Impact | High (Biomass cultivation) | Low (Modular plant footprint) |
| Water Use Impact | High (Irrigation, process) | Moderate (For sorbent humidity management) |
| Primary Resource Dependency | Arable land, sustainable biomass, water | Low-carbon energy, sorbent materials |
| Key Output | Carbon-negative energy | Pure CO2 stream (no inherent energy) |
Experimental Protocols for Key Comparative Studies
3.1 Protocol for Life Cycle Assessment (LCA) of Net Removal Efficiency
- Objective: Quantify the net carbon dioxide removal (CDR) efficiency of BECCS and DAC systems, accounting for full supply chain emissions.
- Methodology:
- System Boundary Definition: Establish "cradle-to-grave" boundaries. For BECCS: include biomass cultivation, transport, conversion (e.g., gasification, fermentation), CO2 capture, transport, and storage. For DAC: include sorbent/material manufacture, plant construction, operational energy sourcing, CO2 compression, transport, and storage.
- Inventory Analysis: Collect primary data from pilot facilities or robust secondary data from peer-reviewed literature for all material/energy inputs and emissions within the boundary.
- Attributional Modeling: Use software (e.g., OpenLCA, Gabi) to model flows. Assign grid emissions factors based on location. For BECCS, model soil carbon stock changes from biomass cultivation.
- Net CDR Calculation: Calculate as: Net CDR = Gross CO2 Captured & Stored - Total Life Cycle Emissions (CO2eq). Express result in tCO2 removed per hectare per year (BECCS) or per plant per year (DAC).
- Sensitivity Analysis: Test sensitivity to key parameters: biomass yield, energy source carbon intensity, sorbent lifetime, and transport distance.
3.2 Protocol for Sorbent/Material Performance Benchmarking
- Objective: Evaluate the adsorption capacity, kinetics, and regeneration energy of novel solid sorbents for DAC against benchmark materials.
- Methodology:
- Material Synthesis: Prepare test sorbents (e.g., amine-functionalized MOFs, supported alkylamines) and a benchmark (e.g., commercial amine-supported silica).
- Characterization: Determine surface area (BET), pore volume, and amine loading via elemental analysis.
- Adsorption Testing: Use a thermogravimetric analyzer (TGA) or fixed-bed reactor. Expose sorbent to a simulated air stream (400 ppm CO2, balance N2/O2) at 25°C and 1 atm. Monitor mass gain (TGA) or breakthrough curve (reactor) to determine equilibrium capacity (mmol CO2/g) and uptake kinetics.
- Regeneration Testing: After saturation, subject sorbent to temperature-vacuum swing (e.g., 80-120°C, under vacuum). Measure CO2 desorbed and energy input required via calorimetry.
- Stability Testing: Repeat adsorption-desorption cycles (≥100) to measure degradation in capacity.
Strategic Integration: A Portfolio Approach
Diagram 2: Decision Framework for Technology Deployment
The Scientist's Toolkit: Research Reagent Solutions
Table 2: Key Research Reagents and Materials for CDR Technology Development
| Reagent/Material | Supplier Examples | Function in Research |
|---|---|---|
| Aminated Silica Sorbents (e.g., TRI-PE-MCM-41) | Sigma-Aldrich, laboratory synthesis | Benchmark solid sorbent for DAC; used to study amine-CO2 chemistry and degradation mechanisms. |
| Metal-Organic Framework (MOF) Precursors (e.g., 2-methylimidazole, ZrCl₄) | Sigma-Aldrich, Strem Chemicals | Synthesis of high-surface-area supports (e.g., ZIF-8, UiO-66) for post-synthetic amine functionalization. |
| ¹³C-Labeled CO₂ | Cambridge Isotope Laboratories | Tracer for precise quantification of carbon uptake, transport, and sequestration in both biological (BECCS) and chemical (DAC) systems. |
| Ionic Liquids (e.g., [P₆₆₆₁₄][Tau]) | IoLiTec, Sigma-Aldrich | Low-vapor-pressure solvents for advanced liquid DAC systems; studied for their tunable CO2 absorption capacity. |
| Stable Isotope-Labeled Biomass (e.g., ¹³C-poplar) | Custom cultivation facilities | Enables precise tracking of biogenic carbon through the entire BECCS chain in pilot-scale experiments. |
| High-Temperature/Pressure Reactors (e.g., Parr autoclaves) | Parr Instrument Company | Simulate conditions for biomass gasification (BECCS) and sorbent regeneration (DAC) at pilot scale. |
| Gas Chromatography (GC) Systems with TCD & FID | Agilent, Shimadzu | Standard for analyzing gas composition (CO2, CH4, CO, H2) in process streams from biomass conversion and DAC capture loops. |
Conclusion
The comparative analysis reveals that BECCS and DAC are not simple substitutes but complementary technologies with distinct profiles. BECCS offers potential for energy co-generation and leverages existing bioenergy infrastructure but faces significant constraints regarding sustainable biomass and land-use. DAC provides geographical flexibility and a more measurable carbon removal process but must overcome immense energy and cost hurdles. For researchers and policymakers, the key takeaway is that a diversified NET portfolio is essential. Future directions must prioritize rigorous lifecycle assessments, dramatic innovation to reduce energy and capital costs, and the development of robust policy and carbon accounting frameworks to validate permanence and scale. The integration of these technologies with renewable energy systems and sustainable land management will ultimately determine their viability in closing the carbon gap toward net-zero emissions.