Anaerobic Digestion for Biogas Production: Microbial Insights, Process Optimization, and Future Bioenergy Applications
This article provides a comprehensive analysis of the anaerobic digestion (AD) process for biogas production, tailored for researchers and scientists in bioenergy and related fields.
Anaerobic Digestion for Biogas Production: Microbial Insights, Process Optimization, and Future Bioenergy Applications
Abstract
This article provides a comprehensive analysis of the anaerobic digestion (AD) process for biogas production, tailored for researchers and scientists in bioenergy and related fields. It explores the foundational microbiology, detailing the complex microbial consortia and biochemical pathways involved. The review further examines methodological advances in process intensification, including co-digestion and pretreatment strategies, alongside practical troubleshooting for system stability. Finally, it validates process efficiency through microbial activity assessments and kinetic modeling, positioning AD within the broader context of renewable energy trends and policy frameworks to highlight its significant potential in the circular bioeconomy.
The Microbial Engine: Deconstructing the Biology and Biochemistry of Anaerobic Digestion
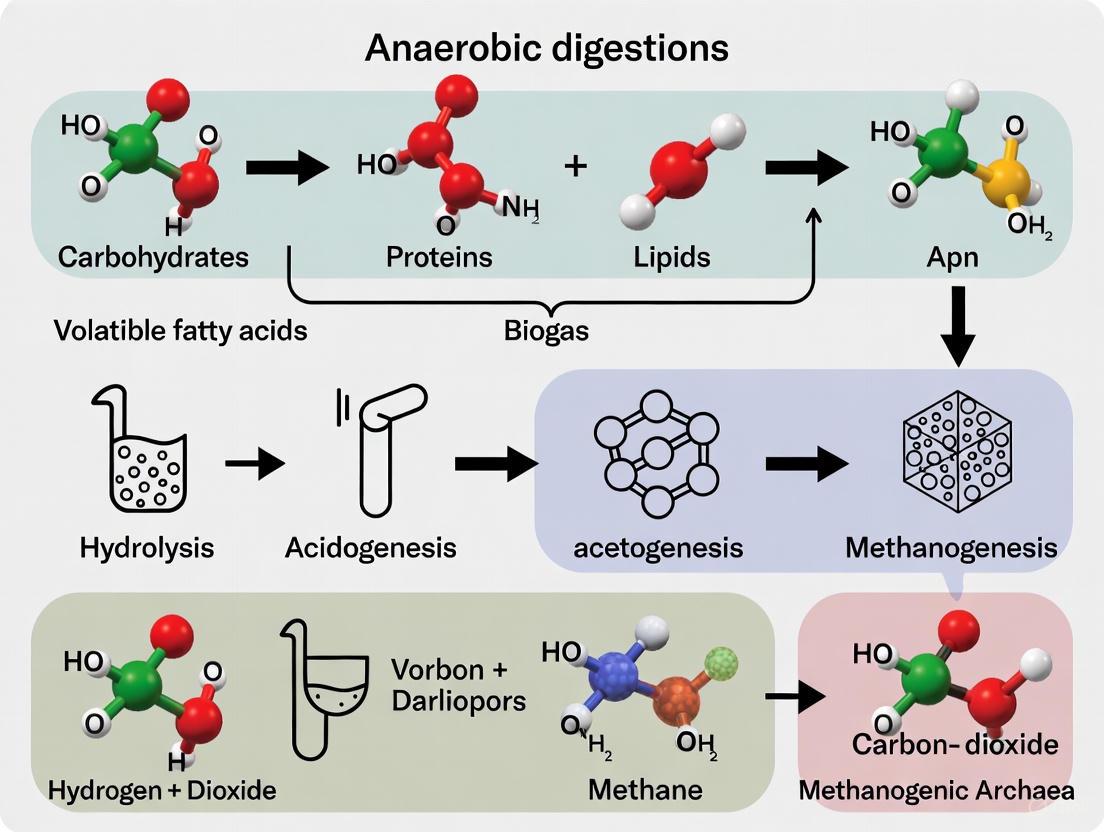
Anaerobic Digestion (AD) is a synergistic biological process wherein a consortium of microorganisms breaks down biodegradable material in the absence of oxygen, leading to the production of biogas, a renewable energy source primarily composed of methane and carbon dioxide [1]. This process is integral to sustainable waste management and renewable energy production, offering a pathway to reduce greenhouse gas emissions and valorize organic solid wastes [2] [3]. The biochemical transformation of complex organic matter into methane is achieved through four sequential and interdependent metabolic stages: hydrolysis, acidogenesis, acetogenesis, and methanogenesis [1] [4]. Each stage is facilitated by distinct microbial communities and enzymatic activities, and their efficiency dictates the overall success of the biogas production process [2] [5]. These Application Notes provide a detailed experimental framework for researchers and scientists to investigate, monitor, and optimize these critical metabolic stages within a broader thesis on AD process optimization.
The AD process is a multi-stage biological reaction. The following diagram illustrates the sequential metabolic stages, key intermediates, and the microbial groups responsible for each transformation.
The entire process relies on syntrophy, a mutually dependent relationship where the products of one microbial group serve as substrates for the next [2]. Critical to this partnership is the maintenance of a low hydrogen partial pressure, which is thermodynamically regulated by hydrogen-consuming methanogens [2]. Electron transfer between syntrophic partners occurs via Interspecies Hydrogen Transfer (IHT) or more efficient Direct Interspecies Electron Transfer (DIET) [2]. The stability of the final methanogenesis stage is highly sensitive to environmental perturbations, such as pH shifts caused by volatile fatty acid accumulation [4].
Application Notes & Experimental Protocols
This section provides detailed methodologies for investigating each metabolic stage, with a focus on quantitative analysis of key intermediates and microbial activity.
Protocol for Monitoring Hydrolysis Kinetics
Objective: To determine the hydrolysis rate constant of a specific organic solid waste (e.g., food waste, agricultural residue) by measuring the chemical oxygen demand (COD) solubilized over time.
Background: Hydrolysis is often the rate-limiting step for solid waste digestion, where complex polymers are broken into soluble monomers by extracellular enzymes [4]. Monitoring the release of soluble COD provides a direct measure of hydrolysis efficiency.
Research Reagent Solutions:
- Phosphate Buffered Saline (PBS, 0.1 M, pH 7.2): For sample dilution and washing.
- Sodium Azide Solution (2% w/v): To inhibit biological activity for control samples.
- COD Digestion Reagents: Standard reagents for closed reflux colorimetric or titrimetric methods.
- Protease/Cellulase/Lipase Enzymes: For positive control experiments with enzymatic pre-treatment.
Procedure:
- Feedstock Preparation: The substrate is mechanically reduced to a particle size of 1-2 mm and homogenized.
- Experimental Setup: Set up batch reactors in triplicate with a working volume of 500 mL. Add 20 g of prepared substrate to 400 mL of anaerobic inoculum. Maintain mesophilic conditions (35 ± 2 °C) with continuous mixing at 100 rpm.
- Sampling: At time intervals (0, 2, 4, 8, 12, 24, 48 hours), withdraw 10 mL of slurry.
- Centrifugation: Centrifuge the sample at 12,000 × g for 15 minutes at 4 °C.
- Filtration: Filter the supernatant through a 0.45 μm membrane filter.
- COD Analysis: Analyze the filtered supernatant for soluble COD using standard methods.
- Data Analysis: The hydrolysis rate is modeled using a first-order kinetic equation:
dS/dt = k_h * X, whereSis the concentration of solubilized COD,k_his the hydrolysis rate constant (day⁻¹), andXis the concentration of particulate COD.
Protocol for Profiling Acidogenesis and Acetogenesis Products
Objective: To quantify the dynamic profile of volatile fatty acids (VFAs) and other intermediates during acidogenesis and acetogenesis.
Background: Acidogenic bacteria ferment soluble monomers into VFAs, alcohols, and gases [6]. Acetogens then oxidize these products primarily to acetate, H₂, and CO₂ [2] [1]. The ratio and concentration of VFAs are critical indicators of process stability.
Research Reagent Solutions:
- Sulfuric Acid (H₂SO₄, 2% v/v): For sample acidification prior to VFA analysis.
- Internal Standard Solution: 2-Ethylbutyric acid or 4-Methylvaleric acid in water.
- GC Calibration Standards: Certified VFA mix (C2-C6) in water at known concentrations.
- Carrier Gas: High-purity Helium or Hydrogen for GC operation.
Procedure:
- Reactor Operation: Operate a continuous stirred-tank reactor or a batch reactor with the feedstock of interest.
- Sampling: Collect liquid samples daily. Immediately centrifuge at 12,000 × g for 10 minutes and filter through a 0.2 μm syringe filter.
- Sample Derivatization (if required): For some GC columns, acidify the sample and mix with an internal standard. No derivatization is needed for specialized columns (e.g., NUKOL).
- Gas Chromatography Analysis:
- Instrument: Gas Chromatograph equipped with a Flame Ionization Detector (FID).
- Column: Capillary column suitable for acid analysis (e.g., DB-FFAP, NUKOL).
- Oven Program: Ramp from 80°C to 200°C at 10°C/min.
- Injector/Detector Temperature: 250°C.
- Quantify acetate, propionate, butyrate, isobutyrate, valerate, and isovalerate concentrations against the calibration curve.
- Data Interpretation: Calculate the Acetate-to-Propionate ratio. A ratio below 1.5 or a propionate concentration above 1500 mg L⁻¹ may indicate potential inhibition [4].
Protocol for Investigating Methanogenesis Pathways
Objective: To differentiate between acetoclastic and hydrogenotrophic methanogenic pathways and quantify their contribution to total methane yield.
Background: Methanogenesis is the terminal step where methanogenic archaea produce methane via two main pathways: acetoclastic (cleavage of acetate) and hydrogenotrophic (reduction of CO₂ with H₂) [2] [1]. Specific inhibitors can be used to delineate these pathways.
Research Reagent Solutions:
- Sodium 2-Bromoethanesulfonate (BES, 20 mM): A specific inhibitor of methyl-CoM reductase, effectively blocking methanogenesis.
- Sodium Acetate Solution (1 M): Substrate for acetoclastic methanogens.
- H₂/CO₂ Gas Mix (80/20 v/v): Substrate for hydrogenotrophic methanogens.
- Anaerobic Basal Medium: A standard medium containing salts, vitamins, and trace elements, sparged with N₂/CO₂ to maintain anaerobiosis.
Procedure:
- Serum Bottle Preparation: In 120 mL serum bottles, add 50 mL of active anaerobic digester slurry. Create four sets in triplicate: (A) Control, (B) Acetate-Amended (20 mM), (C) H₂/CO₂-Amended (1 atm overpressure), (D) BES-Inhibited (10 mM).
- Incubation: Incubate bottles at 35°C on a shaker platform.
- Biogas Monitoring: Periodically measure biogas pressure and composition. Use a manometer for pressure and a gas chromatograph with a Thermal Conductivity Detector (TCD) to determine CH₄ and CO₂ percentages.
- Calculation: The methane yield from the acetate-amended bottles represents the activity of acetoclastic methanogens. The methane yield from the H₂/CO₂-amended bottles represents the hydrogenotrophic activity. The BES-inhibited set serves to confirm the specificity of methane production.
Data Presentation & Analysis
Table 1: Theoretical Methane Yield and Biodegradability of Common Feedstocks
Data adapted from Penn State EGEE 439 course materials and review literature [6] [4]. Yields are theoretical maximums under ideal conditions.
| Feedstock / Substrate | Elemental Formula | Theoretical Methane Yield (m³ CH₄/kg VS) | Relative Biodegradability |
|---|---|---|---|
| Carbohydrates | (CH₂O)ₙ | 0.37 | High |
| Proteins | C₁₀₆H₁₆₈O₃₄N₂₈S | 0.51 | Medium |
| Lipids / Fats | C₈H₁₅O | 1.00 | Very High |
| Lignocellulosic Biomass | C₅H₉O₂.₅NS₀.₀₂₅ | 0.48 | Low to Medium (rate-limited by hydrolysis) |
Table 2: Dominant Microbial Taxa and Key Functions in Anaerobic Digestion
Compiled from microbial community analyses using high-throughput sequencing [2] [5].
| Metabolic Stage | Key Microbial Groups (Phylum/Genus) | Primary Metabolic Function | Critical Inhibitors |
|---|---|---|---|
| Hydrolysis | Firmicutes, Bacteroidetes, Actinobacteria, Chloroflexi | Secretion of exoenzymes (cellulases, proteases, lipases) to solubilize complex polymers. | High lignin content, antibiotics (e.g., tetracycline) [3]. |
| Acidogenesis | Clostridium, Bacteroides, Eubacterium | Fermentation of monomers to VFAs, alcohols, H₂, and CO₂. | Low pH (<5.5), high sulfate levels. |
| Acetogenesis | Syntrophobacter, Syntrophomonas | Oxidation of VFAs and alcohols to acetate, H₂, and CO₂ (obligate syntrophs). | High H₂ partial pressure, ammonia. |
| Methanogenesis | Methanosaeta (acetoclastic), Methanosarcina (versatile), Methanobacterium (hydrogenotrophic) | Reduction of CO₂ (with H₂) or cleavage of acetate to produce CH₄. | Ammonia-N > 2000 mg/L, VFAs, BES, temperature shocks. |
The experimental workflow for a comprehensive analysis of the four stages, from setup to data interpretation, is summarized below.
The Scientist's Toolkit: Key Research Reagents & Materials
This table details essential reagents, standards, and materials required for the experimental protocols outlined in this document.
| Item | Specification / Example | Primary Function in AD Research |
|---|---|---|
| Sodium 2-Bromoethanesulfonate (BES) | Purity ≥ 95% | A specific inhibitor of methanogenesis; used to delineate methanogenic pathways and enrich non-methanogenic cultures. |
| Volatile Fatty Acid (VFA) Standard Mix | Certified reference material including C2-C6 acids (e.g., acetate, propionate, butyrate) | Calibration and quantification of acidogenesis and acetogenesis intermediates via Gas Chromatography. |
| Anaerobic Basal Medium | Standardized mix of minerals, vitamins, trace elements, and a reducing agent (e.g., Cysteine-HCl) | Provides essential nutrients for microbial growth while maintaining a strict anaerobic environment for culturing. |
| Stable Isotope-Labeled Substrates | ¹³C-Acetate, ¹³C-Bicarbonate, D₂O | Used in stable isotope probing (SIP) to trace carbon flow and identify active microbial populations in complex consortia. |
| DNA/RNA Extraction Kit | Optimized for complex environmental samples (e.g., sludge, manure) | Isolation of high-quality nucleic acids for downstream molecular analysis (qPCR, metagenomics, transcriptomics). |
| PCR Primers for Microbial Groups | e.g., Archaea 16S rRNA, bacterial functional genes (hydrolases) | Targeted amplification of specific microbial groups or genes to assess community structure and functional potential. |
| Granular Activated Carbon (GAC) | Particle size 0.5 - 2 mm | Used to facilitate Direct Interspecies Electron Transfer (DIET) by acting as a conductive material, potentially enhancing methanogenesis rates [2]. |
Anaerobic digestion (AD) is a microbial process that breaks down organic matter in the absence of oxygen, producing biogas primarily composed of methane (CH4) and carbon dioxide (CO2) [7]. The efficiency of this process is wholly dependent on complex, synergistic relationships within core microbial consortia, comprising specific bacterial phyla and archaeal methanogens [8] [9]. Understanding the composition and function of these core groups is paramount for optimizing biogas production and process stability in AD systems. This application note details the key microbial players, quantitative data on their abundance, standardized protocols for their identification, and the essential reagents required for research in this field.
Core Microbial Groups in Anaerobic Digestion
The core microbiome in AD systems consists of a consortium of bacteria responsible for hydrolysis, acidogenesis, and acetogenesis, and archaea that carry out the final step of methanogenesis [7]. The stability and performance of the digester are heavily influenced by the structure of this microbial community [8].
Table 1: Core Bacterial Phyla in Anaerobic Digestion Systems
| Phylum | Relative Abundance (%) | Primary Functional Role | Notes |
|---|---|---|---|
| Firmicutes | Highly Abundant | Hydrolysis, Fermentation, Syntrophic Acetate Oxidation | Often dominant; key in breaking down complex organics. |
| Bacteroidetes | Highly Abundant | Hydrolysis, Fermentation of proteins/ carbohydrates | |
| Chloroflexi | Abundant | Saccharolytic, syntrophic metabolism | Associated with decomposition of complex carbon [10]. |
| Proteobacteria | Variable | Diverse, including syntrophic metabolisms | Includes known hydrocarbon-degrading genera (e.g., Marinobacter) [11]. |
| Caldatribacteriota (JS1) | Present in specific environments | Metabolism of complex carbon | Found in consortia in energy-limited sediments like salt marshes [10]. |
| Planctomycetota | Present | Putative role in carbon cycling | Identified as part of core consortia in salt marsh sediments [10]. |
Table 2: Key Archaeal Methanogens in Anaerobic Digestion Systems
| Methanogen Order/Genus | Methanogenic Pathway | Preferred Conditions | Correlation with Biogas Production |
|---|---|---|---|
| Methanobacteriales (e.g., Methanobacterium) | Hydrogenotrophic | Mesophilic to Thermophilic | Positively correlated; high explanatory power for production rates [8] [9]. |
| Methanobacteriales (e.g., Methanothermobacter) | Hydrogenotrophic | Thermophilic (55-70°C) | Dominant under high temperatures; crucial for ex-situ upgrading [9]. |
| Methanomassiliicoccus | Hydrogenotrophic | Mesophilic | Present in lab-scale upgrading systems [9]. |
| Methanomicrobiales | Hydrogenotrophic | Mesophilic to Thermophilic | Abundance correlated with biogas production performance (r=0.665) [8]. |
| Methanosarcinales (e.g., Methanosaeta) | Acetoclastic | Mesophilic | A persistently abundant and stable OTU in full-scale digesters [8]. |
The assembly and function of these core consortia are influenced by environmental parameters. Temperature is a crucial variable, significantly determining microbial community structures and causing a shift in dominant archaea from Methanobacterium to Methanothermobacter at higher temperatures [9]. The pH level also significantly interferes with the relative abundance of dominant archaea, with pH ~8.5 often being optimal for hydrogenotrophic methanogenesis [9]. Furthermore, syntrophic interactions are essential, particularly in energy-limited conditions, where the collective metabolic potential of core consortia enables the decomposition of complex carbon [10].
Quantitative Data on Microbial Abundance and Biogas Production
Quantitative data linking microbial abundance to system performance is critical for diagnostics and optimization.
Table 3: Quantitative Correlations Between Microbial Metrics and Biogas Production
| Metric | Finding | Statistical Significance | Reference |
|---|---|---|---|
| Methanogen Abundance vs. Genes | Relative abundances of methanogenic archaea and methanogenic genes are positively correlated. | r² = 0.530, P < 0.001 | [8] |
| Methanogen Variation vs. Biogas Production | Variations in methanogenic traits explain 55.7% of variation in biogas production rates. | Much higher than environmental parameters (16.4%) | [8] |
| Hydrogenotrophic Methanogens | Abundant Methanomicrobiales taxa correlate with biogas production performance. | r = 0.665, P < 0.001 | [8] |
| Functional Redundancy | Methanogens have lower functional redundancy than fermentative bacteria. | Makes process more sensitive to methanogen population shifts. | [8] |
Experimental Protocols
Protocol 1: Enrichment of Specialized Microbial Consortia
This protocol is adapted from methods used to enrich terephthalate-degrading consortia from environmental sediments [12].
1. Application: To obtain a microbial consortium capable of degrading a specific, potentially recalcitrant organic compound (e.g., terephthalamide, hydrocarbons).
2. Reagents & Materials:
- Bushnell Haas Broth (or other minimal salt media)
- Target carbon source (e.g., disodium terephthalate, terephthalamide)
- Environmental samples (sediment, soil, sludge)
- 125 mL Erlenmeyer flasks
3. Procedure:
- Inoculation: Add 0.5 g of environmental sample to 50 mL of Bushnell Haas media supplemented with the target carbon source (e.g., 10 g/L disodium terephthalate) in a 125 mL flask [12].
- Incubation: Incubate at a relevant temperature (e.g., 25°C) on an orbital shaker at 130 rpm [12].
- Subculturing: Every 14 days, transfer 5 mL of the enrichment culture into 50 mL of fresh media containing the same carbon source [12].
- Monitoring: Repeat this transfer process multiple times to select for a stable, specialized consortium. Monitor substrate degradation via HPLC [12].
- Analysis: After several transfers, collect biomass for 16S rRNA amplicon sequencing to identify the dominant taxa in the enriched consortium [12].
Protocol 2: DNA Extraction and 16S rRNA Gene Sequencing for Community Analysis
This protocol describes the standard method for characterizing microbial community composition, as used in multiple studies of anaerobic digesters and enriched cultures [11] [12] [9].
1. Application: To profile the taxonomic composition of a microbial community from an environmental sample or enrichment culture.
2. Reagents & Materials:
- PowerSoil DNA Extraction Kit (Qiagen)
- E.Z.N.A. Mag-Bind Soil DNA Kit (Omega Bio-tek)
- PCR reagents (e.g., KAPA HiFi Hot Start ready mix)
- Primers for 16S rRNA gene (e.g., 341F/805R for Bacteria, 340F/1000R for Archaea)
3. Procedure:
- DNA Extraction:
- Extract genomic DNA from 0.25 g of homogenized sediment/sludge using a commercial kit like the Qiagen PowerSoil DNA kit or Omega Bio-tek Mag-Bind Soil DNA Kit, following the manufacturer's instructions [10] [9].
- Quantify DNA concentration using a fluorimeter (e.g., Qubit 2.0) and assess quality with a bioanalyzer (e.g., Agilent 2100) [9].
- PCR Amplification:
- Amplify the hypervariable V3-V4 region of the bacterial 16S rRNA gene using primers 341F (CCTACGGGNGGCWGCAG) and 805R (GACTACHVGGGTATCTAATCC) [9].
- For Archaea, use primers such as 340F (CCCTAYGGGGYGCASCAG) and 1000R (GGCCATGCACYWCYTCTC) [9].
- Use a thermocycler with an appropriate program: initial denaturation (95°C, 3 min); 25-35 cycles of denaturation (95°C, 30 s), annealing (50-55°C, 30 s), elongation (72°C, 30 s); final extension (72°C, 5 min) [9].
- Sequencing and Analysis:
- Purity and pool PCR products for sequencing on an Illumina platform (e.g., NovaSeq) [10] [9].
- Process raw sequences through quality filtering, clustering into Operational Taxonomic Units (OTUs) or Amplicon Sequence Variants (ASVs), and assign taxonomy by comparing to reference databases (e.g., SILVA, Greengenes) [11].
Metabolic Pathways and Syntrophic Interactions
The process of anaerobic digestion involves a sequence of metabolic stages—hydrolysis, acidogenesis, acetogenesis, and methanogenesis—that are interconnected through syntrophic relationships. The following diagram illustrates the flow of metabolites and the key microbial groups involved in these pathways, highlighting the critical syntrophic partnerships, particularly between bacteria and archaea.
Diagram 1: Metabolic Pathways and Microbial Consortia in Anaerobic Digestion. The diagram shows the sequential breakdown of organic matter, highlighting the key functional groups of bacteria (red) and archaea (blue) involved at each stage. Critical syntrophic interactions, involving the transfer of H₂ between bacteria and hydrogenotrophic archaea, are emphasized with dashed red lines.
The Scientist's Toolkit: Essential Research Reagents
Table 4: Essential Reagents and Kits for Microbial Consortia Research
| Item | Function/Application | Example Product/Catalog Number |
|---|---|---|
| DNA Extraction Kit | Extraction of high-quality genomic DNA from complex environmental samples like sludge or sediment. | PowerSoil DNA Kit (Qiagen), E.Z.N.A. Mag-Bind Soil DNA Kit (Omega Bio-tek) [10] [9] |
| 16S rRNA Primers | Amplification of taxonomic marker genes for high-throughput sequencing of bacterial and archaeal communities. | 341F/805R (Bacteria), 340F/1000R (Archaea) [9] |
| PCR Master Mix | Robust and high-fidelity amplification of target DNA sequences for sequencing library preparation. | KAPA HiFi Hot Start Ready Mix (TaKaRa) [9] |
| Minimal Salt Media | Enrichment of specific microbial consortia by providing essential nutrients while making a target compound the sole carbon source. | Bushnell Haas Media [12] |
| Standards for qPCR | Absolute quantification of functional genes (e.g., mcrA, dsrA, acsB) to quantify specific microbial guilds. | Custom gBlocks Gene Fragments (IDT) [13] |
Influence of Feedstock on Microbial Community Structure and Diversity
Within the framework of anaerobic digestion (AD) for biogas production, the microbial community is the fundamental engine driving the conversion of organic matter into methane. The composition and structure of this microbial consortium are not static; they are profoundly shaped by the chemical nature of the feedstock introduced into the system. Understanding this relationship is critical for optimizing process stability and biogas yield. This Application Note synthesizes current research to elucidate how different feedstocks influence the microbial ecology within anaerobic digesters. It provides a structured overview of key findings, detailed experimental protocols for investigating these communities, and visualizations of the underlying metabolic pathways, serving as a practical resource for researchers and scientists in the field of bioenergy and environmental biotechnology.
Feedstock-Dependent Microbial Community Dynamics
The substrate introduced to an anaerobic digester acts as a primary selective pressure, determining which microbial populations will thrive. Feedstock composition varies widely in terms of complexity, nutrient balance, and the presence of inhibitory compounds, all of which directly shape the community structure.
Feedstock Type as a Selective Force: Research has conclusively demonstrated that the feedstock type strongly influences the microbial community structure, particularly in the first-stage (acidogenic) reactors. A study investigating communities enriched on various high-strength wastewaters found that feed type was a major driver of carbon removal efficiency and microbial community structure for 1st-stage fermenting communities [14]. Conversely, the second-stage (methanogenic) communities, which are fed the effluent from the first stage (primarily volatile fatty acids and alcohols), showed less variation based on the original feedstock [14]. This indicates that the chemical environment directly selects for specific functional groups.
Community Response to Feedstock Change: Microbial communities demonstrate a significant capacity to adapt to changing feedstock conditions. A study investigating the response of biogas microbiomes to a profound feedstock change from maize silage to sugar beet silage, and vice versa, observed a smooth adaptation of the microbial communities without a profound negative impact on the overall biogas production [15]. The bacterial community showed dynamic shifts, with taxa like Bacteroidetes and Sporochaetales increasing with the shift to the more easily degradable sugar beet silage. Notably, the archaeal community responsible for methanogenesis remained largely unchanged, highlighting the functional redundancy and stability of this critical functional group [15].
Absence of Universal Keystone Species: The search for universal "keystone species" directly tied to organic carbon degradation across all feed types has proven challenging. In a detailed analysis of suspended microbial cultures, it was shown that only one core genus and no unique genera were positively and significantly correlated to soluble COD (sCOD) removal across different feedstocks [14]. This suggests that excellent reactor performance is not dependent on a single, specific microbial population but is likely achieved by a consortium of organisms with overlapping functional roles that can assemble in response to the available substrate.
Table 1: Impact of Feedstock Type on Microbial Community Structure and Reactor Performance
| Feedstock Category | Impact on Bacterial Community | Impact on Archaeal Community | Key Performance Indicators |
|---|---|---|---|
| Protein-Rich Wastewater | Enriches for proteolytic bacteria (e.g., Clostridium, Bacteroidetes) [2]. | Supports acetoclastic methanogens (e.g., Methanosaeta, Methanosarcina) from amino acid degradation [2]. | High ammonia/ammonium levels; potential inhibition at high concentrations [15]. |
| Lipid-Rich Wastewater | Enriches for syntrophic fatty acid-oxidizing bacteria (e.g., Syntrophomonas) [2]. | Requires close syntrophy with hydrogenotrophic methanogens (e.g., Methanoculleus, Methanobacterium) [16]. | High theoretical methane potential; risk of LCFA inhibition and foaming [16]. |
| Lignocellulosic Biomass | Enriches for hydrolytic specialists (e.g., Firmicutes, Actinobacteria, Chloroflexi) [2]. | Community shaped by hydrolysis products (sugars, acetate); mix of acetoclastic and hydrogenotrophic [17]. | Hydrolysis rate is often limiting; pretreatment can enhance digestibility [17]. |
| Simple Sugars (Whey Permeate) | Rapid acidogenesis; dominance of lactic acid bacteria and Trichococcus [16]. | Shift from acetoclastic (e.g., Methanosarcina) to hydrogenotrophic (e.g., Methanobacterium) under high load [16]. | High risk of acidification; requires careful control of OLR and pH [16]. |
Table 2: Core Microbial Functional Groups in Anaerobic Digestion and Their Roles
| Functional Group | Key Taxa (Examples) | Primary Metabolic Function | Sensitive To |
|---|---|---|---|
| Hydrolytic Bacteria | Firmicutes, Bacteroidetes, Actinobacteria, Chloroflexi [2] | Secrete extracellular enzymes to break down polymers (proteins, carbs, lipids) into monomers [2]. | Feedstock particle size, lignin content, temperature. |
| Acidogenic Bacteria | Bacteroidetes, Clostridium [2] | Ferment monomers into volatile fatty acids (VFAs), alcohols, hydrogen, and carbon dioxide [2]. | pH, type of monomeric substrate. |
| Syntrophic Acetogens | Syntrophobacter, Syntrophomonas [2] | Oxidize VFAs (e.g., propionate, butyrate) to acetate, H₂, and CO₂ (obligate syntrophs) [2]. | H₂ partial pressure, temperature, ammonia. |
| Acetoclastic Methanogens | Methanosaeta, Methanosarcina [2] | Cleave acetate to form methane and carbon dioxide [2]. | Ammonia, VFA concentration, pH, temperature. |
| Hydrogenotrophic Methanogens | Methanobacterium, Methanobrevibacter, Methanoculleus [2] | Reduce CO₂ with H₂ to form methane [2]. | H₂ availability, trace metals (e.g., Nickel, Cobalt). |
Experimental Protocols for Microbial Community Analysis
To investigate the influence of feedstock on microbial communities, a combination of reactor operation, molecular biology techniques, and analytical chemistry is required. The following protocols provide a standardized approach for such investigations.
Protocol 1: Establishing Feedstock-Specific Enrichment Cultures
This protocol is adapted from the methodology used to determine how feed type influences community structure and carbon removal [14].
1. Reactor Setup and Inoculation:
- Use suspended flow-through reactors (e.g., continuous stirred-tank reactors, CSTRs) with a working volume of 1-2 L.
- Maintain mesophilic conditions (35-37°C) using a water jacket or incubator.
- Inoculate all reactors with the same anaerobic biomass, obtained from a stable full-scale digester. Sieve (e.g., 2 mm mesh) and pre-incubate the inoculum to reduce endogenous activity [16].
- Set an initial organic loading rate (OLR) of 2.0 g VS L⁻¹ d⁻¹ and a hydraulic retention time (HRT) of 20-40 days, adjustable based on feedstock degradability [15].
2. Feedstock Preparation and Operation:
- Select contrasting feedstocks (e.g., synthetic starch-rich, protein-rich, lipid-rich wastewater, real brewery wastewater, and real dairy wastewater) [14].
- Standardize the chemical oxygen demand (COD) concentration of all feedstocks to ~8 g/L by dilution or concentration to ensure comparability.
- Feed reactors once daily. Continuously monitor biogas production, composition (CH₄, CO₂, H₂S), and pH.
- Regularly sample the digestate for analysis of volatile fatty acids (VFAs), total ammonium nitrogen (TAN), and COD to track process stability and performance.
3. Sampling for Microbial Community Analysis:
- Collect triplicate biomass samples (e.g., 50 mL of digestate) from each reactor during stable operation.
- Centrifuge samples at 10,000 × g for 10 minutes to pellet biomass. Discard the supernatant.
- Flash-freeze the pellet in liquid nitrogen and store at -80°C until DNA extraction.
Protocol 2: DNA Extraction and 16S rRNA Gene Amplicon Sequencing
This protocol details the molecular biological analysis of the collected samples [14] [15].
1. DNA Extraction:
- Extract genomic DNA from frozen biomass pellets using a commercial kit (e.g., DNeasy PowerSoil Kit, Qiagen) following the manufacturer's instructions.
- Perform extraction in triplicate for each sample to account for heterogeneity and ensure sufficient DNA yield.
- Quantify the extracted DNA using a fluorometric method (e.g., Qubit dsDNA HS Assay) and check quality via agarose gel electrophoresis or spectrophotometry (A260/A280 ratio).
2. 16S rRNA Gene Amplification and Sequencing:
- Amplify the hypervariable regions of the bacterial and archaeal 16S rRNA gene via PCR. For bacteria, use primers such as 27F (5'-AGAGTTTGATCMTGGCTCAG-3') and 926R (5'-CCGTCAATTCCTTTRAGTTT-3') [15].
- Include a fluorescent label (e.g., Cy5) on the forward primer if subsequent analysis by terminal restriction fragment length polymorphism (TRFLP) is planned [15].
- For high-throughput sequencing, use a platform like Illumina MiSeq with a standardized protocol (e.g., 515F/806R for both bacteria and archaea).
- Purify the PCR products and pool equimolar amounts of each sample for sequencing.
3. Bioinformatic and Statistical Analysis:
- Process raw sequencing data using a pipeline like QIIME 2 or mothur. Steps include quality filtering, denoising, chimera removal, and clustering of sequences into Amplicon Sequence Variants (ASVs) or Operational Taxonomic Units (OTUs).
- Assign taxonomy to ASVs/OTUs using a reference database (e.g., SILVA, Greengenes).
- Perform statistical analysis to correlate microbial community composition (e.g., via PCoA, NMDS) with process parameters (e.g., sCOD removal, VFA profile) and feedstock type. Use indicator species analysis to identify taxa significantly associated with specific feedstocks.
Metabolic Pathways and Microbial Interactions
The anaerobic digestion process is governed by a complex network of metabolic pathways and syntrophic interactions between bacteria and archaea. The following diagrams illustrate the flow of carbon and electrons from complex feedstock to methane, highlighting key pathways and microbial interactions.
Carbon Flow and Key Metabolic Pathways
Figure 1: Carbon flow from complex feedstock to biogas. The diagram shows the four key stages of anaerobic digestion: Hydrolysis, Acidogenesis, Acetogenesis, and Methanogenesis, and the primary substrates utilized by methanogens.
Interspecies Electron Transfer Mechanisms
A critical interaction for stable digestion, especially of fatty acids, is syntrophy, which relies on efficient interspecies electron transfer (IET) to maintain thermodynamic feasibility.
Figure 2: Interspecies electron transfer mechanisms. Syntrophic bacteria transfer electrons to methanogenic partners indirectly via hydrogen (IHT) or formate (IFT), or directly (DIET) through conductive materials or pili, which is more efficient.
The Scientist's Toolkit: Essential Research Reagents and Materials
Table 3: Key Research Reagent Solutions for Microbial Community Analysis in AD
| Reagent/Material | Function/Application | Example Protocol Use |
|---|---|---|
| DNeasy PowerSoil Kit (Qiagen) | DNA extraction from complex digestate samples; effective lysis of tough microbial cells and removal of PCR inhibitors. | DNA extraction for 16S rRNA sequencing [15]. |
| 16S rRNA Gene Primers (27F/926R) | Amplification of bacterial 16S rRNA gene for community fingerprinting (TRFLP) or sequencing. | PCR amplification for microbial community analysis [15]. |
| Illumina MiSeq Reagent Kit | High-throughput sequencing of 16S rRNA amplicons to profile community composition and diversity. | 16S rRNA gene amplicon sequencing [14]. |
| Standardized Synthetic Wastewater | Defined feedstock for controlled experiments; allows isolation of the effect of specific components (starch, protein, lipids). | Enrichment cultures on specific feed types [14]. |
| Gas Chromatography (GC) System | Quantification of biogas composition (CH₄, CO₂) and volatile fatty acids (VFAs) in digestate. | Process monitoring and performance analysis [16] [17]. |
| pH & VFA/Alkalinity Test Kits | Rapid, on-site monitoring of process stability. Titration to determine VFA concentration and alkalinity. | Daily reactor monitoring and stability assessment [17]. |
Within the framework of research on anaerobic digestion (AD) for biogas production, the precise control of operational parameters is fundamental to optimizing process efficiency, stability, and metabolic outcomes. Temperature and pH are two of the most critical parameters, acting as primary regulators of microbial metabolism, community structure, and biochemical pathways. Anaerobic digestion can be conducted under different temperature regimes, primarily mesophilic (35–37 °C) and thermophilic (50–55 °C) conditions, each imparting distinct characteristics on the process [18]. Concurrently, pH dynamics serve as a key indicator of metabolic balance, particularly between acid-forming and methane-producing microorganisms [18]. This Application Note details the comparative effects of mesophilic and thermophilic temperatures, the critical role of pH, and their interrelationship. It provides validated protocols and datasets to guide researchers and scientists in the systematic optimization of anaerobic digestion systems for enhanced biogas production.
Comparative Analysis: Mesophilic vs. Thermophilic Digestion
The choice between mesophilic and thermophilic operation involves a trade-off between process stability and reaction rate. The table below summarizes the core performance characteristics of the two temperature regimes.
Table 1: Comparative performance of mesophilic and thermophilic anaerobic digestion.
| Parameter | Mesophilic (35-37 °C) | Thermophilic (50-55 °C) |
|---|---|---|
| Optimal Methane Yield | Lower yield compared to thermophilic | Peak yield of 363.3 mL/g VS reported at OLR of 4.5 g VS/(L·d) [19] |
| Hydrolysis Rate | Lower; often the rate-limiting step | Approximately twice as high as mesophilic, accelerating the initial breakdown [20] |
| Process Stability | More stable; less sensitive to perturbations [18] | Less stable; more prone to acidification and ammonia inhibition [21] [20] |
| Pathogen Reduction | Less effective | Enhanced destruction of viral and bacterial pathogens [19] [20] |
| Microbial Diversity | Higher diversity | Lower diversity and distinct community structure [20] |
| Energy Requirement | Lower heating requirement | Higher energy input needed to maintain temperature [21] [18] |
| Sensitivity to Ammonia | Less sensitive | More sensitive due to shift in ammonium/ammonia equilibrium [20] |
Thermophilic digestion offers significant advantages in terms of reaction kinetics and pathogen inactivation. The heightened metabolic activity at higher temperatures leads to a hydrolysis rate approximately double that of mesophilic systems, which can allow for shorter retention times or higher organic loading rates (OLRs) [20]. Furthermore, thermophilic conditions provide superior hygienization, which is a critical consideration for the land application of digestate [19]. However, this comes at the cost of reduced process stability. Thermophilic systems are more susceptible to inhibition from free ammonia (NH₃), which is more prevalent at elevated temperatures and can be toxic to methanogenic archaea, particularly aceticlastic methanogens [20]. They are also more sensitive to fluctuations in feeding regimes and temperature itself [18].
In contrast, mesophilic digestion is characterized by robust process stability and is generally considered more forgiving to operational fluctuations, making it a widely adopted standard in industrial applications [18]. The microbial community under mesophilic conditions is typically more diverse, which can contribute to greater functional resilience. However, this stability is coupled with slower reaction rates and lower pathogen kill, necessitating longer retention times [19] [20].
A promising approach to harness the benefits of both regimes is the Temperature Phase Anaerobic Co-Digestion (TPAcD) system. This two-stage configuration employs a short, initial thermophilic phase (e.g., 2 days) to maximize hydrolysis, followed by a longer mesophilic phase for stable methanogenesis. Research has demonstrated that TPAcD can increase methane yield by 50.3% and 32.7% compared to single-stage mesophilic and thermophilic systems, respectively [21].
pH Dynamics and Process Control
pH is a master variable in anaerobic digestion, directly influencing enzyme activity and the equilibrium of metabolic pathways. The optimal pH range for methanogenic archaea, the key methane-producing microorganisms, is narrow, typically between 6.8 and 7.2 [18]. Deviations from this range can severely inhibit methanogenesis, leading to process failure.
The Role of Alkalinity and VFAs
The pH stability is governed by the balance between the production of volatile fatty acids (VFAs) during acidogenesis and the buffering alkalinity of the system. Alkalinity, primarily from bicarbonate (HCO₃⁻) derived from CO₂ dissolution, acts as a buffer against rapid pH drops by neutralizing produced acids [18]. A stable process maintains a sufficient alkalinity concentration to prevent acid accumulation.
Process imbalance is often signaled by a buildup of VFAs, which consumes alkalinity and causes a drop in pH. If the acid production rate exceeds the methane production rate, this can create a vicious cycle of further pH drop and greater methanogenic inhibition, ultimately leading to process failure [18]. Therefore, monitoring the ratio of VFA to alkalinity is a common practice for assessing digester health.
Managing pH Instability
Several strategies can be employed to correct and prevent pH instability:
- Chemical Buffering: Adding sodium bicarbonate (NaHCO₃) is a direct method to increase alkalinity and raise pH without introducing inhibitory ions [18].
- Co-digestion: Combining substrates with high buffering capacity, such as dairy manure, with easily acidogenic substrates, like food waste, can naturally enhance system stability [18].
- OLR Management: Controlling the organic loading rate prevents the overwhelming shock of VFA production, allowing methanogens to maintain pace.
Table 2: Key parameters and reagents for monitoring and controlling pH dynamics.
| Parameter/Reagent | Optimal Range/Function | Experimental/Operational Significance |
|---|---|---|
| pH | 6.8 - 7.2 [18] | Primary indicator of process balance; must be monitored frequently. |
| Alkalinity | >2000 mg/L as CaCO₃ (typical) | Measures the system's buffering capacity against VFA accumulation. |
| VFA/Alkalinity Ratio | <0.3-0.4 (as acetic acid) | An early warning indicator for impending process imbalance. |
| Sodium Bicarbonate (NaHCO₃) | pH buffer | Used to raise alkalinity and pH directly; preferred due to minimal side effects. |
| Ammonia Nitrogen (NH₃-N) | <200 mg/L (inhibitory level varies) | High levels, especially in thermophilic systems, can be inhibitory and affect pH equilibrium [20]. |
Experimental Protocols
Protocol: Comparing Methanogenic Performance Across Temperature Regimes
This protocol outlines a methodology for establishing lab-scale anaerobic digesters to systematically evaluate the effect of temperature and organic loading rate (OLR) on methane yield and process stability.
I. Materials and Reagents
- Inoculum: Collect anaerobic digestate from a continuously stirred tank reactor (CSTR). For mesophilic and thermophilic experiments, use sludge acclimated to 37 °C and 55 °C for over 90 days, respectively [19].
- Substrate: Use homogenous organic waste (e.g., food waste, sewage sludge). Characterize by determining Total Solids (TS), Volatile Solids (VS), and elemental composition (C, H, O, N) to calculate C/N ratio and theoretical methane potential via the Buswell equation [19].
- Anaerobic Digesters: Batch or continuous stirred-tank reactors (e.g., 5 L working volume) with gas-tight seals, ports for feeding/sampling, and biogas outlet [21].
- Support Equipment: Heated water baths or external circulation heating systems for temperature control; gas collection system (e.g., gas bags, liquid displacement); biogas analyzer (e.g., Geotech Biogas 5000) for CH₄/CO₂ composition; pH meter.
II. Methodology
- Preparation:
- Determine the initial TS and VS of the inoculum and substrate [19] [21].
- Mix the substrate and inoculum in the digester. For a 5 L digester, a common ratio is 2 L of mixture to 1 L of inoculated sludge [21].
- Adjust the initial pH to 7.0 using NaOH or HCl solutions [21].
- Purge the headspace of each reactor with an inert gas (e.g., N₂) to ensure anaerobic conditions.
Operation:
- Assign reactors to mesophilic (35 °C) or thermophilic (55 °C) temperature groups. Maintain temperature within ±0.5 °C.
- Apply a stepped OLR increase. A typical range is 2.5 to 6.5 g VS/(L·d) for food waste [19]. Allow sufficient time (e.g., 3 hydraulic retention times) for the system to stabilize at each OLR before data collection.
- Apply continuous or intermittent mixing at a low speed (e.g., 50 rpm) [21].
Monitoring and Data Collection:
- Biogas Production: Measure daily biogas volume using a gas meter or liquid displacement system.
- Biogas Composition: Analyze CH₄, CO₂, and H₂S content regularly using a biogas analyzer [21].
- Process Parameters: Sample digestate periodically to measure pH, VFA concentration, and ammonia nitrogen (NH₃-N) [19] [21].
- Performance Calculation: Calculate specific methane yield (mL CH₄/g VSadded) for each OLR and temperature condition.
Protocol: Assessing Process Stability via pH and VFA Dynamics
This protocol focuses on tracking key indicators of process imbalance and implementing corrective measures.
I. Materials and Reagents
- Same as Protocol 4.1, with the addition of:
- Analytical Equipment: Gas Chromatograph (GC) with Flame Ionization Detector (FID) for VFA speciation and quantification [21]; spectrophotometer or discrete analyzer for ammonia nitrogen measurement.
- Buffering Reagents: Sodium bicarbonate (NaHCO₃) solution.
II. Methodology
- Baseline Establishment: Under stable operating conditions, establish baseline values for pH, VFA profile (acetic, propionic, butyric acids), and alkalinity.
- Induction of Stress: Induce a controlled imbalance by pulsing a high OLR of substrate or by temporarily ceasing mixing. Monitor the system response.
- High-Frequency Sampling: During the stress period and recovery, sample digestate every 12-24 hours for immediate pH and VFA analysis.
- Corrective Action:
- If the pH drops below 6.8 and VFAs are accumulating, initiate buffering by adding a pre-determined volume of NaHCO₃ solution to restore alkalinity [18].
- If instability is severe, temporarily reduce the OLR to decrease the acid loading rate.
- Data Analysis: Plot the temporal trends of pH, total VFA, and methane production rate to visualize the onset of imbalance and recovery trajectory.
The logical relationship between temperature, pH, and their combined effect on microbial communities and process outcomes is visualized below.
The Scientist's Toolkit: Essential Research Reagents and Materials
The following table catalogues critical reagents, substrates, and analytical standards essential for conducting rigorous anaerobic digestion research.
Table 3: Key research reagents and materials for anaerobic digestion experiments.
| Item | Function/Application | Specifications & Notes |
|---|---|---|
| Inoculum Sludge | Source of anaerobic microbial consortium. | Should be acclimated to the target temperature (mesophilic or thermophilic) for >90 days for stable baselines [19]. |
| Standardized Substrate | Organic feedstock for digestion. | Characterize by Total Solids (TS), Volatile Solids (VS), and C/N ratio. Food waste (C/N ~21.5) and sewage sludge (C/N ~6.6) are common [21]. |
| Sodium Hydroxide (NaOH) / Hydrochloric Acid (HCl) | pH adjustment during setup or imbalance. | Used to calibrate initial pH to 7.0 [21]. |
| Sodium Bicarbonate (NaHCO₃) | Alkalinity and pH buffer. | Critical for counteracting VFA accumulation and preventing acid crash [18]. |
| VFA Standard Mix | Calibration for GC analysis. | Contains salts of acetic, propionic, butyric acids for quantifying VFA concentrations [21]. |
| Gas Standard Mix | Calibration for biogas analyzer. | Contains known proportions of CH₄, CO₂, and H₂S for accurate biogas composition measurement [21]. |
| Elemental Analyzer | Determining C/H/O/N composition of substrate. | Used to calculate theoretical methane potential (via Buswell equation) and C/N ratio [19]. |
The strategic management of temperature and pH is paramount for advancing anaerobic digestion research and technology. Mesophilic digestion offers reliability, while thermophilic processes provide enhanced kinetics and pathogen control, albeit with greater operational complexity. The emerging two-stage TPAcD configuration demonstrates that a synergistic approach can harness the strengths of both temperature regimes, leading to significant gains in methane productivity. Maintaining pH within the optimal range for methanogens through diligent monitoring and buffering is non-negotiable for stable process operation. The protocols and data presented herein provide a foundation for researchers to systematically investigate these critical parameters, optimize bioreactor performance, and contribute to the development of robust, efficient, and sustainable biogas production systems.
Microbial Synergies and Interspecies Electron Transfer Mechanisms
Within the engineered ecosystem of an anaerobic digester, the conversion of organic waste to biogas is accomplished through the coordinated activity of diverse microbial populations. This process is strictly dependent on syntrophic activities, defined as close cooperation between at least two organisms based on the transfer of metabolic products from one to another [22]. These microorganisms engage in complex networks of interspecies electron transfer (IET), which plays a crucial role in the methanogenesis process [23]. Three primary mechanisms of IET have been identified: interspecies hydrogen transfer (IHT), interspecies formate transfer (IFT), and direct interspecies electron transfer (DIET) [23].
While IHT and IFT rely on hydrogen or formate as diffusive electron carriers, DIET represents a more efficient mechanism that utilizes conductive structures or materials to facilitate direct electron transfer between microorganisms [23]. DIET does not require hydrolysis or acidification and allows for direct conversion of organic matter into methane through syntrophic metabolism of DIET-active microorganisms, significantly improving anaerobic fermentation efficiency [23]. This application note details experimental approaches to study and enhance these microbial synergies, with particular focus on DIET mechanisms and their application in biogas production research.
Key Microbial Players and Electron Transfer Mechanisms
Microbial Communities in Anaerobic Digestion
Anaerobic digestion relies on a consortium of microorganisms operating through four main metabolic stages: hydrolysis, acidogenesis, acetogenesis, and methanogenesis [24] [22]. The microbial community in an anaerobic digester is characterized by complex networks of interactions, where each microorganism plays a specific role [24]. Syntrophic relationships between bacteria and archaea are particularly important, defined by their ability to transfer electrons at stable and fast rates to survive within the digester environment [24].
Table 1: Key Microbial Genera Involved in Interspecies Electron Transfer
| Microbial Group | Genus/Phylum | Function in AD | Role in Electron Transfer |
|---|---|---|---|
| Electrogenic Bacteria | Geobacter | Organic acid oxidation | Direct electron donation via conductive pili and cytochromes [25] |
| Syntrophorhabdus | Syntrophic metabolism | Exhibits strong interaction strength with methanogens (0.14 ± 0.22) [26] | |
| Syntrophomonas | Butyrate oxidation | Limited interaction strength (0.01 ± 0.01) [26] | |
| Methanogenic Archaea | Methanosaeta | Acetoclastic methanogenesis | DIET participation; dominant with biochar amendment [24] [27] |
| Methanosarcina | Versatile methanogenesis | Accepts electrons via DIET; both hydrogenase-positive (M. barkeri) and cytochrome-dependent (M. acetivorans) types [25] | |
| Methanobacterium | Hydrogenotrophic methanogenesis | Dominant in electro-methanogenic communities [28] | |
| Methanomassiliicoccus | Hydrogen-dependent methylotrophy | Strong interaction partner for syntrophic bacteria [26] |
Molecular Mechanisms of Direct Interspecies Electron Transfer
DIET occurs through biologically conductive structures that form direct electrical connections between microbial cells. Geobacter species utilize conductive pili and outer-surface c-type cytochromes to transfer electrons to methanogenic partners [24]. In archaea, anaerobic methanotrophic (ANME) archaea like 'Candidatus Methanoperedens' engage in extracellular electron transfer using uncharacterized short-range electron transport protein complexes and OmcZ nanowires [29]. Electrochemical analyses of DIET-active communities reveal distinct redox potential signals at -0.18 V and +0.10 V (vs SHE), indicating at least two distinct redox protein complexes active in electron transfer from methane to electrodes [29].
Diagram 1: DIET Mechanisms. Solid blue lines show material-mediated DIET; dashed red line shows direct biological DIET.
Experimental Protocols for DIET Investigation
Protocol 1: Establishing DIET-Promoting Co-culture Systems
Principle: This protocol establishes defined synthetic microbial communities to investigate DIET mechanisms without interference from complex environmental microbiomes [25].
Materials:
- Strains: Geobacter metallireducens, Methanosarcina barkeri (Type I), Methanosarcina acetivorans (Type II)
- Culture media: Modified DSM 120 medium (see Table 4 for composition)
- Anaerobic chamber with N₂-CO₂ (80:20) atmosphere
- Serum bottles (110 mL) with thick butyl rubber stoppers
- Substrates: Ethanol (20 mM), methanol (100 mM), sodium acetate (50 mM)
Procedure:
- Pre-conditioning of G. metallireducens:
- Subculture G. metallireducens 3-5 times in ferric citrate medium with 20 mM ethanol replacing acetate
- Use 10% (v/v) inoculum transfer each time to ensure ethanol adaptation
Preparation of Methanosarcina pure cultures:
- Grow M. barkeri in modified DSM 120 with 0.2% NaCl and 100 mM methanol
- Grow M. acetivorans in modified DSM 120 with 0.2% NaCl (reduced from 0.5%) and 50 mM sodium acetate
- Incubate at 37°C until OD₆₀₀ reaches 0.4-0.6 (logarithmic growth phase)
Establishing co-culture systems:
- Under strict anaerobic conditions, inoculate cultures in DSM 120 medium at proportions below.
- Use 20 mM ethanol as substrate in 10 mL medium/110 mL anaerobic vial
- Incubate at 30°C for 38-70 days with three biological replicates
Table 2: Co-culture System Configurations
| System Type | Component Ratios | Key Characteristics | Expected Methane Yield |
|---|---|---|---|
| SM-G (Single Methanosarcina) | M. barkeri + G. metallireducens (1:1) | Hydrogenase-positive metabolism; hydrogen cycling | Baseline (1x) [25] |
| SM-G (Single Methanosarcina) | M. acetivorans + G. metallireducens (1:1) | Cytochrome-dependent metabolism; Rnf complex energy metabolism | 3.0x increase over baseline [25] |
| DM-G (Dual Methanosarcina) | M. barkeri + M. acetivorans + G. metallireducens (1:1:1) | Metabolic complementarity; optimized electron allocation | 3.8x increase over baseline [25] |
Analytical Methods:
- Monitor headspace gas composition daily via gas chromatography
- Measure optical density at 600 nm for growth assessment
- Perform transcriptomic analysis to verify upregulation of DIET-related genes
Protocol 2: Bioelectrochemical Enrichment of Electroactive Communities
Principle: This protocol uses alternating polarity in bioelectrochemical systems to simultaneously enrich electroactive bacteria and electrotrophic methanogens for robust electro-methanogenesis [28].
Materials:
- Two-chamber bioelectrochemical systems (120 mL methanogenic chamber)
- Granular activated carbon (GAC, 50 g, particle size 2-3 mm)
- Potentiostat with three-electrode configuration
- Carbon brush working electrode, Ag/AgCl reference electrode, platinum counter electrode
- Substrate: Synthetic wastewater or organic waste streams
Procedure:
- System setup:
- Amend methanogenic chamber with 50 g GAC
- Add 60 mL substrate, creating 20 mL headspace
- Bury carbon brush working electrode in GAC
- Position Ag/AgCl reference electrode adjacent to working electrode
Alternating polarity program:
- Set potentiostat to alternate between +0.8 V and -0.4 V vs SHE
- Program with defined intervals (e.g., 6-hour cycles)
- Run enrichment for 4-6 weeks
Monitoring and analysis:
- Daily measurement of biogas production and composition
- Cyclic voltammetry scans (e.g., from -0.6 V to +0.2 V vs SHE at 1 mV/s)
- 16S rRNA gene sequencing of established communities
Expected Outcomes:
- Communities dominated by Methanobacterium (up to 74.3% abundance)
- Stable methane production rate of 0.18 mol CH₄/kg GAC/day
- Robust communities maintaining function after operational perturbations
Protocol 3: Conductive Material Amendment for DIET Enhancement
Principle: This protocol evaluates the enhancement of DIET in anaerobic digesters through amendment with carbon-based and iron-based conductive materials [23] [27].
Materials:
- Continuous stirred tank reactors (CSTRs) or batch reactors
- Conductive materials: Biochar, graphene, Fe₃O₄, Fe₃O₄@BC composite
- Substrate: Vegetable waste, thermo-chemically pretreated sludge
- Anaerobic inoculum from functioning digesters
Procedure:
- Material preparation:
- Biochar: Grind hardwood biochar to 1-8 mm particle size
- Fe₃O₄@BC synthesis: Prepare via co-precipitation method; load nano-Fe₃O₄ onto biochar surface
- Graphene: Prepare by exfoliating graphite using H₂SO₄/HNO₃ mixture, thermal shock at 1050°C, and ultrasonication
Reactor setup and operation:
- Use CSTRs with total volume 6 L (effective volume 4.5 L)
- Equip with temperature control, mechanical stirring, and pH monitoring
- Add conductive materials at varying concentrations:
- Biochar: 0-40 g/L
- Graphene: 50-1000 mg/L
- Fe₃O₄@BC: 100-300 mg/L
- Maintain organic loading rate (OLR) at 3.5-3.715 g VS/L·d
- Operate at mesophilic temperature (33-37°C)
Performance monitoring:
- Daily biogas production and composition analysis
- Volatile fatty acid (VFA) profiling via HPLC
- Microbial community analysis via 16S rRNA amplicon sequencing
- Specific methanogenic activity assays
Table 3: Performance Outcomes of Conductive Material Amendment
| Material | Optimal Dose | Methane Yield Increase | VFA Reduction | Key Microbial Shifts |
|---|---|---|---|---|
| Biochar | 20 g/L | 42.8% vs control [27] | Significant VFA degradation [24] | Methanothrix increased to 73.1% (vs 59.9% control) [27] |
| Graphene | 100 mg/L | 24.8% vs control [27] | Enhanced VFA transformation | Methanothrix increased to 85.4% [27] |
| Fe₃O₄@BC | 200 mg/L | Biogas production rate of 0.658 L/g VS [23] | Reduced VFA accumulation | Increased Christensenellaceae_R-7_group, Sphaerochaeta, Thermovirga [23] |
| Magnetite | Varies by system | Up to 70% improvement possible [30] | Accelerated propionate metabolism | Enriched Geobacter and Methanosarcina [25] |
The Scientist's Toolkit: Essential Research Reagents
Table 4: Key Research Reagent Solutions for DIET Investigations
| Reagent/Material | Specifications | Research Function | Application Notes |
|---|---|---|---|
| Modified DSM 120 Medium | 0.5 mM sulfide, 1 mM cysteine, 0.22 g/L CaCl₂·2H₂O, 2 g/L NaHCO₃; no yeast extract, no Casitone [25] | Cultivation of DIET-relevant methanogens | Essential for synthetic co-culture systems; salinity adjustment needed for different Methanosarcina species [25] |
| Granular Activated Carbon (GAC) | Particle size 2-3 mm (6 mesh); high surface area | Electron conduit in DIET studies | Provides scaffold for microbial attachment and electron transfer; enhances community stability [28] |
| Biochar | Hardwood source, 1-8 mm particle size, specific surface area ~215 m²/g [27] | Low-cost conductive amendment | Enhances DIET while improving digestate dewaterability; optimal at 20 g/L [27] |
| Fe₃O₄@BC Composite | Nano-Fe₃O₄ loaded on biochar via co-precipitation | Synergistic DIET promotion | Combines conductivity of magnetite with microbial support of biochar; optimal at 200 mg/L [23] |
| Graphene | Exfoliated from graphite using H₂SO₄/HNO₃ treatment | High-conductivity DIET material | Superior conductivity but potential antimicrobial effects; use at low concentrations (100 mg/L) [27] |
| Anaerobic Serum Bottles | 110 mL volume with thick butyl rubber stoppers | Oxygen-free cultivation | Essential for maintaining strict anaerobic conditions for methanogen cultures [25] |
Diagram 2: Experimental Workflow for DIET Studies
Analytical Methods for DIET Validation
Electrochemical Techniques
Electrochemical analyses provide direct evidence of DIET activity in microbial systems:
Cyclic Voltammetry:
- Parameters: Scan from -0.6 V to +0.2 V vs SHE at 1 mV/s
- Interpretation: Identify redox peaks associated with electron transfer proteins
- Expected outcome: Distinct signals at -0.18 V and +0.10 V indicate active redox centers [29]
Chronoamperometry:
- Application: Monitor current production over time with methane as electron donor
- Validation: Compare current with and without methane supply
- Performance metrics: Methane-dependent current of 91-93% indicates high DIET activity [29]
Polarization Curves:
- Analysis: Determine onset potential of current production
- Validation: Onset near CH₄/CO₂ redox couple (-0.249 V at pH 7) confirms methane oxidation [29]
Microbial Community Analysis
Advanced molecular techniques elucidate DIET-associated microbial shifts:
16S rRNA Amplicon Sequencing:
- Target: Hypervariable regions (V3-V4) for bacteria and archaea
- Analysis: Track enrichment of DIET-relevant genera (Geobacter, Methanosarcina, Methanosaeta)
- Platform: Illumina MiSeq or NovaSeq with appropriate primers
Metatranscriptomics:
- Application: Identify upregulated DIET-related pathways
- Key targets: Conductive pili genes, multi-heme cytochromes, methanogenic enzymes
- Validation: Confirm expression of omcZ, pi1A, and methane metabolism genes [29]
Empirical Dynamic Modeling (EDM):
- Approach: Analyze daily time-series data to reconstruct microbial interaction networks
- Application: Quantify interaction strengths between syntrophic partners
- Outcome: Identify keystone species with strong syntrophic relationships (e.g., Syntrophorhabdus-Methanomassiliicoccus with interaction strength 0.14 ± 0.22) [26]
The protocols and methodologies detailed in this application note provide researchers with comprehensive tools for investigating and harnessing microbial synergies via interspecies electron transfer. DIET represents a promising mechanism to enhance anaerobic digestion efficiency, particularly in systems challenged by high organic loading, ammonia toxicity, or volatile fatty acid accumulation [30]. The experimental approaches outlined enable systematic study of DIET mechanisms, from defined co-culture systems to complex community reactors.
Future research directions should focus on optimizing conductive material properties, improving material reuse strategies, controlling potential metal toxicity, and validating scalability through pilot- and full-scale demonstrations [30]. Integration of novel cultivation strategies with advanced molecular analyses will continue to unravel the complexity of microbial electron transfer networks, enabling more efficient bioenergy recovery from organic wastes.
Enhancing Biogas Yield: Advanced Strategies for Process Intensification and System Design
Within the framework of anaerobic digestion (AD) research for biogas production, the pretreatment of organic substrates is a critical step for enhancing process efficiency and biogas yield. The complex lignocellulosic structure of many organic wastes, characterized by a resilient matrix of cellulose, hemicellulose, and lignin, significantly limits their biodegradability and constitutes a major bottleneck, primarily during the hydrolysis phase [31] [32]. Pretreatment methods aim to disrupt this recalcitrant structure, thereby increasing the accessibility of organic compounds to microbial consortia in the digester. The choice of pretreatment is highly dependent on the chemical composition of the substrate, with lignocellulosic-, protein-, and lipid-rich feedstocks requiring distinct approaches for optimal bio-methanation [32]. This document details the primary pretreatment technologies—Cphysical, chemical, and biological—and provides specific application notes and experimental protocols for their implementation in a research setting.
Classification and Application of Pretreatment Methods
The efficacy of a pretreatment method is not universal but is intrinsically linked to the chemical dominance of the substrate. A meta-analysis of AD studies has demonstrated that grouping substrates by chemical composition (e.g., lignocellulosic-rich, protein-rich, lipid-rich) is fundamental for selecting a pretreatment that leads to a significant increase in methane yield, while inappropriate choices can result in non-significant or even adverse effects [32]. The following sections and tables summarize the key characteristics and applications of various pretreatment strategies.
Table 1: Overview of Pretreatment Methods for Different Substrate Types
| Pretreatment Category | Specific Methods | Primary Mechanism of Action | Ideal Substrate Types | Reported Methane Yield Increase (Examples) |
|---|---|---|---|---|
| Physical | Milling, Grinding, Extrusion, Ultrasonic, Hydrodynamic Cavitation | Reduces particle size, increases surface area, disrupts cell walls [31]. | Lignocellulosic biomass, sludge; often combined with other methods. | Varies with substrate and intensity; mechanical methods can be energy-intensive [31]. |
| Thermal | Thermal Hydrolysis, Steam Explosion, Hydrothermal | Disintegrates complex structures, solubilizes organic matter, breaks down lignocellulose [32]. | Protein-rich substrates (e.g., microalgae, slaughterhouse waste), lignocellulosics [32]. | Steam explosion: SMD=7.386; Hydrothermal: SMD=13.144 for protein-rich substrates [32]. |
| Chemical | Alkaline (e.g., NaOH), Acid, Deep Eutectic Solvents | Degrades lignin and hemicellulose, improves solubilization [31] [33]. | Lignocellulosic-rich substrates (e.g., agricultural residues) [33]. | Can exceed 100% increase in methane yield for lignocellulosics [31]. |
| Biological | Enzymatic (e.g., cellulase, protease, lipase), Fungal | Specific enzymatic hydrolysis of polymers (cellulose, proteins, lipids) [32]. | Protein-rich (enzymatic), Lignocellulosic-rich (fungal) [32] [33]. | Protease pretreatment for protein-rich: SMD=5.132; certain enzymatic blends can achieve up to 485% increase [31] [32]. |
| Hybrid | Thermo-Chemical, Bio-Physical (e.g., Enzymatic + Mechanical) | Combines mechanisms for synergistic effect, overcoming limitations of single methods [34] [33]. | Recalcitrant substrates like Organic Fraction of Municipal Solid Waste (OFMSW) [34]. | Often superior to individual methods; co-pretreatment of thermal KOH and steam explosion shown effective for lignocellulosics [35]. |
Table 2: Advantages and Disadvantages of Pretreatment Categories
| Pretreatment Category | Key Advantages | Key Disadvantages / Challenges |
|---|---|---|
| Physical | No inhibitory by-products, increases surface area [31]. | High energy consumption, one of the costliest phases [31]. |
| Thermal | Effective for cell disruption and pasteurization, full-scale application experience [32]. | High energy input, risk of forming recalcitrant or inhibitory compounds (e.g., Maillard products) [32]. |
| Chemical | Effective lignin removal, can be cost-efficient (e.g., alkaline) [36] [33]. | Possible formation of inhibitory by-products (e.g., furans from acids), need for pH neutralization, chemical cost [36]. |
| Biological | Low energy demand, high specificity, no toxic products, environmentally friendly [32]. | Can be slow, enzyme costs can be high, requires careful control of conditions [32]. |
| Hybrid | Can enhance overall efficiency, mitigate drawbacks of individual methods [31] [33]. | Increased process complexity, potentially higher combined costs. |
Experimental Protocols for Key Pretreatment Methods
Protocol: Alkaline Pretreatment for Lignocellulosic Substrates
Principle: Alkaline agents (e.g., NaOH) effectively break ester and glycosidic bonds between lignin, hemicellulose, and cellulose, leading to lignin solubilization and structural swelling, thereby enhancing enzymatic accessibility [36] [33].
Materials:
- Substrate: Dried and milled lignocellulosic biomass (e.g., corn stover, wheat straw).
- Reagent: Sodium hydroxide (NaOH) pellets or solution.
- Equipment: Autoclave or temperature-controlled water bath, pH meter, magnetic stirrer, vacuum filtration setup, balance.
Procedure:
- Substrate Preparation: Mill the biomass to a particle size of 1-2 mm. Determine the initial Total Solids (TS) and Volatile Solids (VS) content.
- Reaction Setup: Prepare a 2-10% (w/v) NaOH solution. Mix the biomass with the NaOH solution at a solid-to-liquid ratio of 1:10 (w/v) in a sealed reactor vessel.
- Incubation: Incubate the mixture at a temperature range of 50-121°C for 15 minutes to 24 hours. For ambient temperature pretreatment, extend the duration to 24 hours or more.
- Neutralization & Washing: After incubation, cool the mixture to room temperature. Neutralize the pH to ~7.0 using hydrochloric acid (HCl) with constant stirring.
- Solid Recovery: Separate the pretreated solids via vacuum filtration and wash with deionized water to remove residual salts and inhibitors. The solid fraction is now ready for anaerobic digestion assays.
Protocol: Enzymatic Pretreatment for Protein-Rich Substrates
Principle: Protease enzymes specifically hydrolyze peptide bonds in proteins, breaking them down into peptides and amino acids, which are more readily available for acidogenic bacteria, thus accelerating the hydrolysis bottleneck [32].
Materials:
- Substrate: Protein-rich waste (e.g., microalgae biomass, slaughterhouse waste).
- Reagent: Commercial protease enzyme preparation.
- Equipment: Incubator or water bath, pH meter, orbital shaker, centrifuge.
Procedure:
- Substrate Preparation: Homogenize the substrate. If using microalgae, a slurry with a VS concentration of 5-10% is typical.
- Enzyme Addition: Adjust the substrate pH to the optimum range for the specific protease (typically pH 7-8 for neutral/alkaline proteases). Add the enzyme at a dosage of 0.1-1.0% (w/w of VS).
- Hydrolysis Reaction: Incubate the mixture at the enzyme's optimal temperature (e.g., 40-50°C) with mild agitation (100-150 rpm) for 4-12 hours.
- Reaction Termination: After the incubation period, heat the mixture to 90°C for 10 minutes to denature and deactivate the enzyme.
- Digestion Inoculation: Cool the hydrolysate to the digestion temperature (e.g., 37°C for mesophilic digestion) and proceed directly to biogas potential tests.
Protocol: Combined Thermo-Alkaline Pretreatment for Enhanced Sludge Digestion
Principle: This hybrid method combines the synergistic effects of heat and alkali to aggressively disrupt extracellular polymeric substances (EPS) and microbial cell walls in wastewater sludge, significantly improving biodegradability [36].
Materials:
- Substrate: Wastewater activated sludge (WAS).
- Reagents: NaOH or Ca(OH)₂ solution.
- Equipment: Autoclave, pH meter, fume hood (if using ammonia), filtration setup.
Procedure:
- Sludge Conditioning: Adjust the pH of the sludge to 10-12 using a concentrated NaOH solution.
- Thermal Treatment: Transfer the alkaline sludge to an autoclave and treat at 121°C (1 bar pressure) for 30-60 minutes.
- Cooling and Adjustment: After treatment, cool the sludge rapidly. The pH can be left as is or partially neutralized, depending on the subsequent AD process requirements and its buffering capacity.
- Biomethane Potential (BMP) Test: Use the pretreated sludge directly in BMP assays to evaluate the enhancement in methane production compared to raw sludge.
The Scientist's Toolkit: Research Reagent Solutions
Table 3: Essential Reagents and Materials for Pretreatment Research
| Reagent/Material | Function/Application | Example Use Case |
|---|---|---|
| Sodium Hydroxide (NaOH) | Alkaline catalyst for lignocellulose delignification and sludge disintegration [36] [33]. | Alkaline and Thermo-Alkaline Pretreatment. |
| Sulfuric Acid (H₂SO₄) | Acid catalyst for hemicellulose hydrolysis in lignocellulosic biomass. | Acid Pretreatment. |
| Protease Enzyme | Hydrolyzes proteins into amino acids and peptides [32]. | Enzymatic pretreatment of protein-rich substrates (e.g., microalgae, slaughterhouse waste). |
| Cellulase Enzyme | Hydrolyzes cellulose into glucose monomers. | Enzymatic pretreatment of cellulosic materials. |
| Deep Eutectic Solvents (DES) | Green solvents for selective extraction of lignin [33]. | Chemical pretreatment of lignocellulosic biomass. |
| Magnetite (Fe₃O₄) Nanoparticles | Catalyze direct interspecies electron transfer (DIET) between bacteria and methanogens, enhancing process stability and methane yield [37]. | Additive in anaerobic digestion following pretreatment. |
Visualization of Pretreatment Workflows and Microbial Impacts
The following diagrams, generated using Graphviz DOT language, illustrate the logical workflow for selecting a pretreatment method and the subsequent impact on microbial communities within the anaerobic digester.
Diagram 1: Substrate Pretreatment Selection Workflow
Diagram 2: Microbial Community Response to Pretreatment
Anaerobic co-digestion (AcoD) has emerged as a pivotal strategy for enhancing biogas production within the broader context of sustainable waste management and renewable energy generation. This process leverages the synergistic effects of combining multiple organic feedstocks to balance nutrient profiles, dilute inhibitory compounds, and improve overall process stability and methane yield. The carbon-to-nitrogen (C/N) ratio is a critical parameter, as it directly influences microbial metabolism, buffer capacity, and the long-term stability of the anaerobic digestion process [38]. Imbalanced C/N ratios can lead to process inhibition; for instance, high nitrogen availability causes ammonium inhibition, while low nitrogen leads to insufficient microbial growth and system acidification [38] [39]. This application note provides a consolidated framework of optimal C/N ratios, detailed experimental protocols, and advanced enhancement strategies to guide researchers and scientists in optimizing AcoD systems for maximum methane production.
Quantitative Analysis of C/N Ratios and Feedstock Performance
A synthesis of recent research reveals distinct optimal C/N ratios and performance outcomes for various feedstock combinations, as summarized in Table 1.
Table 1: Optimal C/N Ratios and Methane Yields for Various Co-digestion Feedstocks
| Feedstock Combination | Optimal C/N Ratio | Methane Yield at Optimal C/N | Process Stability Notes | Source |
|---|---|---|---|---|
| Lignocellulosic Residues & Goat Manure | 33 | 244 ± 15 mLN gVS-1 d-1 | Stable and effective production. Failure at C/N of 52. | [38] |
| Food Waste (FW) & Green Waste (GW) | 17-24 (FW:GW 4:1) | Not specified | Marked improvement in process performance, 64% shorter lag phase. | [40] [41] |
| Olive Pomace & Pig Manure | ~25 (35% Pig Manure) | 283 mL CH₄ gVS-1 | Overcame complete inhibition of olive pomace mono-digestion. | [42] |
| Paper Waste (PW) & Food Waste (FW) | 25 | 350 mL CH₄ gVS-1 (Batch); 13 L gVS-1 (CSTR) | Superb performance, 96% VS reduction. | [43] |
| Ulva lactuca & Cow Manure | ~20 (2:1 Ratio) | 325.75 mL CH₄ gVS-1 | Modified Gompertz model best fit the data (R²=0.999). | [44] |
The boundaries of process stability are clearly defined by specific thresholds. For instance, a C/N ratio of 43 with lignocellulosic residues and goat manure leads to process hindrance, while a C/N of 52 causes failure, characterized by a drop in pH to 5.4 and a VFA-to-alkalinity ratio increase to 0.9 [38]. Similarly, in Food Waste digestion, organic loading rates (OLR) exceeding 3.0 g VS/L/d trigger VFA accumulation above 20,000 mg/L and acidification (pH 5.94), collapsing biogas production [45].
Experimental Protocols for AcoD Optimization
Protocol: Biochemical Methane Potential (BMP) Assays for Feedstock Screening
Objective: To determine the specific methane yield and biodegradability of individual substrates and their mixtures.
Materials:
- Inoculum: Anaerobically digested sludge from a functioning wastewater treatment plant or biogas reactor.
- Substrates: Pre-treated, homogenized, and characterized feedstocks (e.g., FW, GW, manure).
- Equipment: 160-1000 mL glass serum bottles, helium gas, septum caps, water bath or incubator (37°C), pressure transducer, gas chromatograph.
Procedure:
- Preparation: Clean and dry serum bottles. Use a working volume typically between 0.8 L (in a 1 L bottle) and 120 mL (in a 160 mL bottle) [42] [43].
- Loading: Add substrates and inoculum based on predetermined VS ratios. Maintain an inoculum-to-substrate ratio (ISR) of 2:1 (on a VS basis) to ensure sufficient microbial activity [42]. For co-digestion tests, create mixtures with varying VS or C/N ratios (e.g., 4:1, 3:1, 1:1 FW:GW) [40].
- Anaerobic Atmosphere: Flush the headspace of each bottle with helium for 3-5 minutes to establish anaerobic conditions and seal immediately with airtight rubber septa [42] [43].
- Incubation: Place bottles in a thermostatic incubator at 37 ± 1°C for the test duration (typically 30-40 days). Provide periodic manual or mechanical shaking [40] [42].
- Monitoring: Measure daily biogas production via water displacement or pressure build-up. Periodically sample the headspace gas using a gastight syringe for compositional analysis (CH₄, CO₂) via gas chromatography [42].
- Kinetic Modeling: Fit the cumulative methane production data to kinetic models (e.g., first-order, modified Gompertz) to determine hydrolysis rate constants (k) and maximum potential yields (B₀) [44] [42].
Protocol: Semi-Continuous Stirred Tank Reactor (CSTR) Operation
Objective: To evaluate long-term process stability, methane yield, and microbial adaptation under continuous feeding conditions.
Materials:
- Reactors: CSTRs with a minimum total volume of 2 L, equipped with mechanical stirring, temperature control, and gas-tight ports.
- Feedstock: Pre-mixed substrate slurry with a defined C/N ratio.
- Monitoring Equipment: Mariotte bottles for biogas volume, pH meter, COD test kits, VFA analysis equipment (e.g., HPLC, GC).
Procedure:
- Start-up & Inoculation: Fill reactors with active inoculum (e.g., mesophilic digestate) to the working volume (e.g., 1.7 L in a 2 L reactor) [42].
- Operational Parameters: Set and maintain mesophilic temperature (37 ± 1°C). Define Hydraulic Retention Time (HRT) and Organic Loading Rate (OLR). A common HRT is 21 days, with an OLR starting at 1-2 g VS/L/d [42] [43].
- Feeding Regime: Feed the reactors daily with the prepared substrate mixture. Ensure continuous or intermittent mixing to maintain homogeneity.
- Process Monitoring:
- Microbial Community Analysis: At the end of defined operational periods, sample the digestate for DNA extraction and sequencing (16S rRNA) to monitor shifts in microbial populations, particularly methanogenic archaea like Methanosarcina [42].
The workflow for developing and optimizing an AcoD process, from initial screening to continuous operation, is illustrated below.
Enhancement Strategies and Microbial Management
Additives for Process Intensification
The addition of conductive materials represents a advanced strategy to boost methane production and process resilience as shown in Table 2.
Table 2: Additives for Enhanced Methane Production in AcoD
| Additive | Optimal Dose | Substrate | Methane Yield Improvement | Proposed Mechanism | Source |
|---|---|---|---|---|---|
| Co-Pyrolysis Biochar (DRB) | Not specified | Food Waste | +37.1% | Direct Interspecies Electron Transfer (DIET), VFA adsorption, enrichment of Methanosarcina. | [46] |
| Ferric Oxide (Fe₂O₃) | 0.5 g / 800 mL | Slaughterhouse WW & FW | +81% | DIET, mitigation of inhibitory compounds. | [47] |
| Digestate-derived Biochar | Not specified | Kitchen Waste | +20.8% | VFA adsorption, pH stability. | [46] |
Microbial Community Dynamics
The success of AcoD is fundamentally linked to the structure and function of the microbial community. Co-digestion strategies significantly enhance microbial diversity and resilience. For instance, co-digesting olive pomace with pig manure not only increased methane yield more than fivefold but also notably increased the relative abundance of methanogenic archaea, particularly Methanosarcina, a robust and versatile genus known for its ability to participate in DIET [42]. Additives like biochar further promote this shift by providing a habitat for microbial colonization and facilitating electron exchange, thereby stabilizing the methanogenesis phase [46].
The following diagram illustrates the core interdependencies between feedstock properties, process parameters, and microbial outcomes that dictate AcoD performance.
The Scientist's Toolkit: Research Reagent Solutions
Table 3: Essential Reagents and Materials for AcoD Research
| Reagent/Material | Function & Application | Example Specification / Note |
|---|---|---|
| Anaerobic Inoculum | Source of microbial consortia for initiating digestion. | Mesophilically digested sludge from a wastewater treatment plant, used fresh. [42] |
| Helium Gas | To create an oxygen-free atmosphere in batch BMP bottles. | High-purity (>99.99%), used for headspace flushing. [42] |
| Sodium Hydroxide (NaOH) Solution | CO₂ trapping in biogas measurement systems; pH adjustment during recovery from acidification. | 3N solution used in bubblers for Mariotte bottle setup. [42] [45] |
| Conductive Materials (e.g., Biochar, Fe₂O₃) | Additives to promote DIET, improve stability, and enhance methane yield. | Co-pyrolysis biochar from digestate and rice straw; Ferric oxide at 0.5g/800mL. [46] [47] |
| Cellulose | Positive control in BMP assays to verify inoculum activity. | Microcrystalline cellulose, a standard reference substrate. [42] |
| Analytical Standards (VFA, Gas) | For calibration of analytical equipment (GC, HPLC) to quantify process intermediates and products. | Certified standard mixtures for acetic, propionic, butyric acids; CH₄/CO₂ gas standards. |
Achieving enhanced and stable methane production through anaerobic co-digestion requires a multifaceted approach. Central to this is maintaining an optimal C/N ratio, typically between 20:1 and 30:1, though the ideal value is feedstock-dependent. Long-term CSTR studies and BMP assays are critical for validating feedstock synergies and determining process parameters. Furthermore, the integration of additives like biochar and ferric oxide presents a promising avenue for process intensification by leveraging DIET and improving microbial resilience. The protocols and data summarized in this application note provide a foundation for researchers to systematically develop, optimize, and scale AcoD processes, contributing to more efficient and sustainable biogas production systems.
Anaerobic Digestion (AD) is a vital biological process for sustainable organic waste management and renewable energy production, converting complex organic materials into biogas primarily comprising methane and carbon dioxide [48]. A fundamental technical parameter defining AD system design and operation is the total solids (TS) content of the feedstock, which categorizes processes into high-solids anaerobic digestion (HS-AD) and low-solids anaerobic digestion (LS-AD) [49] [48].
LS-AD, often termed "wet" AD, typically processes pumpable slurries with total solids content less than 15% [50] [49]. In contrast, HS-AD (also known as dry or solid-state AD) handles stackable substrates with total solids concentrations typically ranging from 15% to 40% or higher [49] [48] [51]. This distinction in solids content profoundly influences reactor hydrodynamics, mass transfer, microbial ecology, and overall system design, making the choice between HS-AD and LS-AD a critical decision in biogas plant development [49] [48].
This analysis provides a comparative examination of HS-AD and LS-AD reactor configurations, operational parameters, and sector-specific applications, supported by quantitative data and experimental protocols tailored for researchers and scientists in the field of biogas process development.
Fundamental Comparative Analysis
The core differences between high-solids and low-solids anaerobic digestion systems are quantified across several technical parameters, which dictate their suitability for specific applications and waste streams.
Table 1: Fundamental Characteristics of High-Solids vs. Low-Solids Anaerobic Digestion
| Parameter | High-Solids AD (HS-AD) | Low-Solids AD (LS-AD) |
|---|---|---|
| Total Solids Content | 15-40% (≥15%) [49] [48] | <15% (typically 5-10%) [50] [49] |
| Water Requirement | Low [51] | High [51] |
| Reactor Volume | Smaller [48] | Larger [49] |
| Organic Loading Rate (OLR) | ~10 kgVS/(m³·d) [48] | ~5-6 kgVS/(m³·d) [48] |
| Energy Consumption | Higher for mixing/pumping [49] | Lower for mixing/pumping [49] |
| Tolerance to Impurities | High [51] | Low to Moderate [51] |
| Substrate Flexibility | Wide range of dry, stackable biomass [51] | Limited to pumpable slurries [50] |
| Mass Transfer Efficiency | Challenged due to low moisture content [48] | Enhanced due to liquid environment [49] [48] |
| Methane Yield | Potentially higher per unit volume but often constrained by mass transfer [48] | Generally stable and efficient [49] |
Table 2: Rheological and Process Challenges Comparison
| Challenge | High-Solids AD (HS-AD) | Low-Solids AD (LS-AD) |
|---|---|---|
| Rheological Behavior | High viscosity, non-Newtonian flow [48] | Low viscosity, more Newtonian flow [48] |
| Mixing Limitations | Poor mixing, dead zones, high energy demand [52] [48] | Efficient mixing, homogenous conditions [48] |
| Inhibition Sensitivity | VFA accumulation, ammonia inhibition [48] | Faster dilution of inhibitors [48] |
| Process Stability | Prone to inhibition, lower stability [49] [48] | Generally more stable [49] |
| Scale-Up Considerations | Significant mass transfer challenges [48] | More straightforward hydrodynamics [48] |
Reactor Configurations and Design Principles
High-Solids AD Reactor Systems
HS-AD systems employ specialized designs to handle viscous, high-solids substrates:
Batch Tunnel Digesters: Gas-tight chambers (e.g., concrete "garage-style" digesters) operated in batch mode, where feedstock is deposited and sealed for the digestion period, typically 18-21 days [49] [51]. Liquid digestate (percolate) is recirculated over the solid biomass to distribute microorganisms and nutrients [51].
Continuous Vertical Plug Flow Digesters: Upright cylindrical tanks (e.g., DRANCO technology) where feedstock is continuously fed from the top and moves downward by gravity, with total solids content up to 40% [49]. Typical retention times are 15-30 days without internal mixing [49].
Horizontal Plug-Flow Digesters: Elongated reactors (e.g., Kompogas technology) with low-speed agitators to prevent sedimentation, operating at thermophilic temperatures (53-55°C) with approximately 14-day retention [49].
Two-Stage Hybrid Systems: Initial dry hydrolysis stage followed by wet methanogenesis stage (e.g., GICON, Harvest Power), combining advantages of both systems for improved efficiency [49].
Low-Solids AD Reactor Systems
LS-AD utilizes mixed reactor designs for homogeneous slurry processing:
Complete Stirred Tank Reactors (CSTR): Enclosed, heated tanks with mechanical, hydraulic, or gas mixing systems, optimal for 3-6% total solids manure slurries with 20-30 day retention [50] [53]. CSTRs provide continuous operation with active microorganisms throughout the reactor [50].
Covered Lagoon Digesters: Impermeable membranes covering manure lagoons, operating at ambient temperatures with seasonal biogas production variations [50] [53]. Suitable for liquid manure collection systems with minimal technical operation requirements [50].
Upflow Anaerobic Sludge Blanket (UASB): Designed for dilute wastes (<1% total solids) where microorganisms form granular aggregates, allowing hydraulic retention times as low as 5 days [50] [54].
Fixed Film and Fluidized Bed Reactors: Support media (plastic rings, wood chips, sand) for biofilm growth, enabling compact designs with short retention times but requiring solids removal to prevent clogging [50].
Diagram 1: High-solids AD reactor configuration options for solid waste processing.
Mass Transfer Phenomena and Enhancement Strategies
Mass transfer limitations represent the most significant challenge in HS-AD systems, directly impacting methane production rates and process efficiency [48].
Diagram 2: Cascade of mass transfer limitations in high-solids anaerobic digestion systems.
Enhancement Strategies for HS-AD
Substrate Pretreatment: Mechanical (grinding, extrusion) and thermal pretreatments enhance particle solubilization and biodegradability, improving substrate accessibility for microorganisms [48].
Optimized Mixing Strategies: Controlled agitation prevents stratification while avoiding over-mixing that can disrupt microbial consortia. Optimal mixing speeds vary with total solids content (e.g., 30 RPM for 16.4% total solids, up to 80 RPM for 18.7% total solids) [52].
Biochar Addition: Carbon-based materials (e.g., biochar) enhance mass transfer through improved microbial attachment, toxin adsorption, and direct interspecies electron transfer [48].
Liquid Recirculation: In dry fermentation systems, periodic recirculation of percolate maintains moisture distribution and nutrient transfer [51].
Two-Stage Process Configuration: Separating hydrolysis/acidogenesis from methanogenesis allows optimization of conditions for each microbial community [49].
Experimental Protocols for AD Performance Analysis
Laboratory-Scale Bioreactor Operation Protocol
Objective: Evaluate methane production kinetics from specific organic waste streams under controlled HS-AD and LS-AD conditions.
Materials:
- Laboratory-scale CSTR bioreactors (2-10L capacity) with temperature control and gas collection systems [54]
- Feedstock characterization equipment (total solids, volatile solids, elemental analyzer)
- Biogas composition analyzer (GC-TCD or portable biogas analyzer)
- pH, VFA, and alkalinity monitoring equipment
Procedure:
- Inoculum Acclimation: Adapt anaerobic sludge to target substrate over 2-3 retention periods
- Reactor Startup: Fill reactors with acclimated inoculum (30% v/v) and substrate (70% v/v)
- Temperature Control: Maintain mesophilic (35±1°C) or thermophilic (55±1°C) conditions
- Continuous Operation: Implement daily feeding with hydraulic retention time 20-30 days
- Process Monitoring: Daily biogas production and composition, pH
- Weekly Analytics: VFA profile, alkalinity, chemical oxygen demand removal
- Performance Calculation: Determine methane yield (L CH₄/g VS), organic loading rate, and degradation efficiency
Mass Transfer Assessment Protocol
Objective: Quantify mass transfer coefficients in HS-AD systems under different mixing regimes.
Materials:
- Rheometer for viscosity measurements
- Tracer compounds (Li⁺, fluorescent dyes)
- Online monitoring sensors (pH, redox)
- Computational fluid dynamics (CFD) software for mixing simulation
Procedure:
- Rheological Characterization: Determine viscosity and yield stress across shear rates
- Tracer Studies: Introduce inert tracer and monitor concentration over time
- Mixing Energy Calculation: Correlate power input with homogenization efficiency
- CFD Modeling: Simulate flow patterns and identify dead zones
- Mass Transfer Correlation: Develop relationship between rheological properties and substrate degradation rates
Application Analysis by Sector
The selection between HS-AD and LS-AD technologies is heavily influenced by sector-specific waste characteristics, regulatory frameworks, and economic considerations.
Table 3: Sector-Specific Application of High-Solids and Low-Solids AD Technologies
| Sector | Preferred AD Technology | Typical Feedstocks | Key Considerations |
|---|---|---|---|
| Agriculture | LS-AD: Covered lagoons, CSTR for manure [50] | Dairy/swine manure (3-6% TS) [50] | Nutrient management, odor control, co-digestion opportunities |
| HS-AD: Plug flow for solid manure [50] | Solid manure (10-15% TS), bedded pack [50] | Handling of high-solits waste, bedding materials | |
| Municipal Solid Waste | HS-AD: Batch tunnel, vertical plug flow [49] [48] | Organic fraction of MSW (20-40% TS) [49] [48] | Contamination tolerance, minimal preprocessing, water conservation |
| Wastewater Treatment | LS-AD: CSTR, fixed film, UASB [50] | Sewage sludge, primary/secondary sludge (<5% TS) [50] | Existing infrastructure, energy self-sufficiency, biosolids management |
| Industrial & Food Waste | Both: Selection based on waste characteristics [50] | Food processing waste, brewery waste, agricultural residues [50] | Seasonal variation, high organic strength, co-digestion potential |
| Standalone Digestion Facilities | HS-AD predominates for source-separated organics [50] [49] | Commercial food waste, FOG, energy crops [50] | Tip fees, renewable energy production, digestate marketing |
The Researcher's Toolkit: Essential Reagents and Materials
Table 4: Essential Research Reagents and Materials for AD Studies
| Reagent/Material | Function/Application | Technical Specifications |
|---|---|---|
| Laboratory CSTR Bioreactors | Continuous process simulation under controlled conditions [54] | 2-10L capacity, temperature control (20-70°C), corrosion-resistant materials (AISI 316), gas-tight sealing [54] |
| Anaerobic Inoculum | Microbial seed for biogas production | Acclimated anaerobic sludge from operational digesters, volatile solids content >15% |
| Process Monitoring Kits | Essential parameter analysis | pH, alkalinity, VFA test kits; CH₄/CO₂/H₂S gas analyzers; chemical oxygen demand digestion systems |
| Biochar Additives | Mass transfer enhancement, microbial support [48] | Particle size 1-5mm, high surface area (>200 m²/g), conductive properties |
| Trace Element Solutions | Prevent microbial nutrient limitations | Customized mixtures of Fe, Ni, Co, Mo, Se, W to address specific feedstock deficiencies |
| Antifoaming Agents | Control foam formation in mixed digesters | Silicone-based or organic antifoams, compatible with methanogenic archaea |
| Gas Collection Systems | Biogas volume and composition measurement | Tedlar bags, liquid displacement systems, continuous flow meters with data logging |
The selection between high-solids and low-solids anaerobic digestion technologies represents a critical decision pathway in biogas plant design, with implications for substrate flexibility, water usage, energy efficiency, and operational stability. HS-AD offers advantages in reduced water consumption, smaller reactor volume, and higher tolerance for contaminants, making it particularly suitable for municipal solid waste and agricultural residues with high solids content. However, its application is constrained by significant mass transfer limitations and process instability concerns. Conversely, LS-AD provides more reliable operation with efficient mixing and mass transfer, remaining the preferred option for liquid and slurry-based waste streams.
Future research should focus on innovative strategies to overcome mass transfer barriers in HS-AD through advanced reactor designs, optimized mixing protocols, and the application of conductive materials. The integration of two-stage systems combining HS-AD and LS-AD principles presents a promising approach to leverage the advantages of both technologies. As the global anaerobic digestion market continues to expand, driven by waste management regulations and renewable energy targets, understanding the nuanced applications of these complementary technologies becomes increasingly essential for researchers, engineers, and policy-makers working toward sustainable waste valorization and circular bioeconomy development.
Temperature control is a critical determinant of efficiency and stability in the anaerobic digestion (AD) process, directly influencing microbial metabolism, reaction rates, and ultimately, biogas yield and composition. Solar-assisted heating and advanced thermal insulation strategies present innovative, sustainable solutions for maintaining optimal digester temperatures, particularly in variable or cold climates. This document provides detailed application notes and experimental protocols to guide researchers in implementing and evaluating these temperature control systems within a biogas production research framework. The methodologies are designed to generate reproducible, quantitative data on system performance, enabling direct comparison of different design configurations.
Quantitative Performance Data of Temperature Control Systems
The following table summarizes key performance metrics from recent studies on solar-assisted and insulated anaerobic digesters, providing a baseline for expected outcomes.
Table 1: Performance metrics of different temperature control system designs in anaerobic digestion.
| System Design | Temperature Increase Above Ambient (°C) | Biogas/Methane Yield Improvement | Key Operational Parameters | Source |
|---|---|---|---|---|
| Solar Geyser with Heat Exchanger & Soil Insulation | Maintained target mesophilic range (82.76% of time) | Cumulative biogas increased by 33%; Methane content increased by 14% | Underground fixed-dome digester; 10-min stir every 4 hours (30 rpm). | [55] |
| Greenhouse + Insulated Trench | +7.4 °C | Promotes sustainable biogas production in cold climates. | Low-cost tubular digester; insulation thicknesses of 1 cm and 5 cm tested. | [56] |
| Insulated Trench Only | +4.3 °C to +6.0 °C | Promotes sustainable biogas production in cold climates. | Trench insulation effectiveness is dependent on its thickness. | [56] |
| Greenhouse Only | +0.8 °C | Minimal impact on biogas production. | - | [56] |
| Anaerobic Digestion at Controlled Ambient (25°C) | - | Generated 163 mL CH₄/g VS from Digested Secondary Sludge. | Viable where ambient temperatures are consistently high, eliminating heating costs. | [57] |
Experimental Protocols for System Validation
To ensure the reliability and reproducibility of research on digester temperature control, the following standardized protocols are proposed.
Protocol 1: Thermal Performance of Passive Solar Designs
This protocol assesses the efficacy of passive heating and insulation strategies, such as greenhouses and insulated trenches.
3.1.1 Research Reagent Solutions & Essential Materials
Table 2: Key materials for evaluating passive solar heating designs.
| Item | Function/Description | Experimental Role |
|---|---|---|
| Low-Cost Tubular Digester | Primary anaerobic fermentation vessel. | Experimental unit for testing biogas production and thermal dynamics. |
| Temperature Data Loggers | Sensors for continuous temperature monitoring. | To record slurry temperature at regular intervals (e.g., hourly). |
| Greenhouse Enclosure | A structure made of transparent material (e.g., polyethylene) covering the digester. | Passive solar heating strategy to trap short-wave solar radiation. |
| Trench Insulation Material | Material with low thermal conductivity (e.g., polystyrene, polyurethane foam). | Layer placed between the digester and the surrounding soil to reduce heat loss. |
3.1.2 Methodology
- Setup: Construct multiple full-scale, identical tubular digesters. Apply different passive strategies to each:
- Digester A: Combine a greenhouse enclosure with a trench insulated with 5 cm thick material.
- Digester B: Use only trench insulation (e.g., 1 cm thickness).
- Digester C: Use only a greenhouse enclosure.
- Digester D: No modifications (control).
- Instrumentation: Install temperature data loggers in the slurry of each digester and one to record ambient temperature.
- Operation & Data Collection: Operate all digesters under identical conditions (e.g., feedstock, loading rate). Continuously monitor and record slurry and ambient temperatures for a minimum of one hydraulic retention time (HRT), ideally covering seasonal variations.
- Data Analysis: Calculate the average temperature difference between each digester's slurry and the ambient temperature (( \Delta T = T{slurry} - T{ambient} )). Compare the performance of each configuration [56].
Diagram 1: Workflow for passive solar design testing.
Protocol 2: Efficacy of an Active Solar Heating System with Thermal Storage
This protocol evaluates a system where solar energy is actively collected and transferred to the digester, often incorporating thermal storage for temperature stability.
3.2.1 Research Reagent Solutions & Essential Materials
- Solar Thermal Collector: A device (e.g., evacuated tube or flat-plate solar geyser) to convert solar radiation into heat.
- Heat Exchanger: A coil or panel immersed in the digester slurry through which the heated fluid circulates.
- Circulation Pump & Piping: System to move the heat transfer fluid between the collector and the heat exchanger.
- Temperature Control System: An automated system (e.g., Arduino-based) that activates the pump based on temperature differentials.
- Thermal Storage Unit: An insulated tank containing a Phase Change Material (PCM) that stores excess thermal energy for later use.
3.2.2 Methodology
- System Integration: Connect the solar thermal collector to the heat exchanger inside the digester. Integrate the circulation pump and a control system programmed to maintain the slurry within a target mesophilic range (e.g., 35 ± 2 °C). Incorporate a PCM-based thermal storage unit into the hydraulic loop.
- Experimental Comparison: Use two identical digesters: one equipped with the active solar system (test) and one without (control).
- Operation: Feed both digesters with the same substrate (e.g., cow dung mixed with water in a 1:1 ratio).
- Data Collection: Continuously monitor and record:
- Slurry temperatures in both digesters.
- Biogas production volume (cumulative) and composition (methane and CO₂ content) via gas chromatography.
- Total Solids (TS), Volatile Solids (VS), and Chemical Oxygen Demand (COD) of the influent and effluent to calculate removal efficiencies [55].
- Data Analysis: Calculate the percentage increase in cumulative biogas and methane yield in the test digester compared to the control. Corporate pH and temperature data to understand process stability.
Diagram 2: Active solar heating system with thermal storage.
Advanced Application: Validated Thermal Model for System Design
For predicting thermal behavior and optimizing design, a validated thermal model is essential. The following protocol outlines the development and application of such a model.
4.1 Methodology
- Model Formulation: Design a thermal model based on classical heat transfer equations, accounting for all heat losses (through walls, floor, roof, and with effluent) and thermal loads (heating of inlet slurry).
- Experimental Validation: Build a small-scale digester (e.g., floating drum type) with a heating system and temperature sensors. Collect empirical temperature data under various ambient conditions.
- Model Calibration: Adjust the model parameters to minimize the difference between predicted and measured slurry temperatures (e.g., by reducing the Root Mean Square Error).
- Simulation & Analysis: Use the validated model with Typical Meteorological Year (TMY) data for a specific location to simulate annual performance, estimate heating requirements, and determine the critical digester size above which auxiliary heating becomes economically viable [58].
Table 3: Key parameters for thermal modeling of anaerobic digesters.
| Parameter | Description | Role in Model |
|---|---|---|
| Slurry Temperature | The internal temperature of the digester content. | Primary output variable of the model. |
| Ambient Temperature | The external air temperature. | Key input variable driving heat loss. |
| Soil Temperature | The temperature of the surrounding soil (for buried digesters). | Boundary condition for conductive heat loss. |
| Heat Loss Coefficients | Calculated values for conduction through digester walls, floor, and roof. | Determine the rate of thermal energy loss to the surroundings. |
| Solar Irradiance | The amount of solar power received per unit area. | Input for estimating solar thermal energy gain. |
Implementing solar-assisted heating and advanced insulation strategies provides a robust method for enhancing the thermodynamic and biochemical efficiency of anaerobic digesters. The protocols outlined herein provide a standardized framework for researchers to quantitatively assess and optimize these systems, contributing to more predictable and sustainable biogas production. The integration of empirical experimentation with validated thermal modeling represents a powerful approach for scaling these innovative designs from laboratory research to commercial application.
The global transition to a low-carbon energy system has intensified the search for renewable alternatives to fossil fuels. Biomethane, or Renewable Natural Gas (RNG), represents a mature and infrastructure-compatible solution derived from the anaerobic digestion (AD) of organic waste [59]. Raw biogas, the primary product of AD, typically contains 50-75% methane (CH₄), with the remainder consisting primarily of carbon dioxide (CO₂) and trace impurities such as hydrogen sulfide (H₂S), water vapor, nitrogen, and siloxanes [60] [59]. These components reduce the calorific value of the gas and can cause operational issues like corrosion in engines and pipelines [60]. Consequently, biogas upgrading is an essential technological step to remove these impurities and produce pipeline-quality biomethane, which must meet stringent standards of 96–99% CH₄ content for grid injection or use as a vehicle fuel [61] [59].
This document frames biogas upgrading within a broader research context on anaerobic digestion, providing application notes and detailed experimental protocols for the primary upgrading technologies. It is designed to support researchers and scientists in developing robust methodologies for evaluating and optimizing these systems, with a focus on data rigor and process reproducibility.
Current Biogas Upgrading Technologies: A Comparative Analysis
The purification of biogas into biomethane relies on several physicochemical and biological technologies. The selection of an appropriate upgrading technology depends on factors such as plant capacity, feedstock composition, desired biomethane purity, and economic considerations [62] [63]. The most prevalent technologies include membrane separation, amine scrubbing, pressure swing adsorption (PSA), and cryogenic separation.
Table 1: Comparative Performance of Major Biogas Upgrading Technologies
| Technology | Methane Purity (%) | Methane Recovery/Slip | Key Operating Principle | Energy Demand | TRL & Key Challenges |
|---|---|---|---|---|---|
| Amine Scrubbing | 98.5 – 99.5% [62] | <0.1% methane slip [62] | Chemical absorption of CO₂ and H₂S using amine solvents [62] | Thermal energy for solvent regeneration [62] | High TRL; Solvent degradation, equipment corrosion risk [62] |
| Pressure Swing Adsorption (PSA) | Can fall below 95% over time [62] | 5-8% methane loss after a few years [62] | Adsorption of CO₂ and other gases onto solid media under pressure [62] | Electrical energy for compression [62] | High TRL; Adsorbent fatigue, CO₂ breakthrough, media replacement costs [62] |
| Cryogenic Separation | >99% CH₄ [61] | High recovery rate; enables CO₂ valorization [64] | Separation based on differing condensation/ freezing points at low temperatures [61] | High energy demand for refrigeration [64] [61] | Growing TRL; High capital and operating cost, complexity [64] [61] |
| Membrane Separation | N/A in sources | N/A in sources | Selective permeation of gases through a membrane [63] | Energy for compression [63] | High TRL; Membrane fouling and selectivity limitations [63] |
| Water Scrubbing | N/A in sources | N/A in sources | Physical absorption of CO₂ and H₂S in water [60] | Energy for water pumping and regeneration [60] | High TRL; High water consumption, microbial growth [60] |
The industry is also exploring hybrid approaches, such as combining cryogenic separation with membrane or chemical pre-treatment, to enhance overall efficiency and reduce operating costs [64] [61]. Furthermore, emerging biological methods like in-situ and ex-situ hydrogenotrophic methanation are being developed, which convert CO₂ into additional CH₄ using hydrogen, offering a potentially carbon-negative pathway [60].
Application Notes and Experimental Protocols
For research into biogas upgrading, establishing standardized protocols is critical for generating comparable and reliable data. The following sections outline key experimental methodologies.
Protocol: Assessing Biogas Upgrading Performance with a Mobile Pilot Unit
Objective: To evaluate the on-site performance and economic viability of an amine-based upgrading technology using a mobile, containerized pilot unit [62]. Background: Field trials with mobile units provide real-world data on methane purity, recovery rates, and operational stability, de-risking future capital investment [62]. This protocol is adaptable for other upgrading technologies with similar pilot systems.
Materials and Reagents: Table 2: Research Reagent Solutions for Biogas Upgrading Experiments
| Item | Function/Description | Example/Specification |
|---|---|---|
| Raw Biogas Supply | Feedstock for upgrading system. | Direct feed from anaerobic digester or landfill gas well [62] [59]. |
| Amine Solvent | Chemical absorbent for CO₂ and H₂S. | Proprietary aqueous amine blend [62]. |
| Biomass-fired Boiler | Provides thermal energy for process. | Supplies steam for solvent regeneration [62]. |
| Gas Chromatograph (GC) | Analyzes gas composition. | Measures CH₄, CO₂, O₂, H₂S concentrations in inlet and outlet streams [65]. |
| Online Gas Flow Meters | Monitors system capacity and gas flow. | Installed at raw biogas inlet and biomethane product outlet [62]. |
Procedure:
- Unit Siting and Commissioning: Position the mobile upgrading unit (e.g., a system with a capacity of up to 250 Nm³/h) proximate to the biogas source. Connect the raw biogas feed line, biomethane output line, and utilities [62].
- System Baseline: Collect and analyze a sample of the raw biogas using GC to determine baseline concentrations of CH₄, CO₂, and H₂S.
- Process Initiation: Start the upgrading unit according to manufacturer specifications. Initiate the flow of raw biogas and the amine solvent circulation system.
- Solvent Regeneration: Engage the thermal regeneration system (e.g., using a biomass-fired boiler) to desorb CO₂ from the rich amine solvent, allowing for solvent recycle [62].
- Data Collection Phase: Over a predetermined trial period (e.g., several weeks), continuously monitor and record:
- Inlet and outlet gas flow rates.
- Pressure and temperature at key process points.
- Periodic GC analysis of the upgraded biomethane to determine CH₄ purity and impurity levels.
- Energy consumption of the unit.
- Data Analysis: Calculate key performance indicators (KPIs) including:
- Methane Purity:
(Volume of CH₄ in product gas / Total volume of product gas) * 100% - Methane Recovery:
(Mass flow rate of CH₄ in product gas / Mass flow rate of CH₄ in feed gas) * 100% - Specific Energy Demand:
Total energy consumed / Volume of biomethane produced
- Methane Purity:
Protocol: Biochemical Methane Potential (BMP) Assays for Feedstock Evaluation
Objective: To determine the methane yield of different organic substrates used in anaerobic digestion, a key parameter influencing upstream biogas production before upgrading [65].
Materials and Reagents:
- Inoculum: Actively digesting sludge from a functioning anaerobic digester [65].
- Substrate: Prepared organic waste (e.g., homogenized manure, crop residues).
- Batch BMP Reactors: Sealed glass vessels with ports for gas collection and sampling.
- Anaerobic Chamber: For preparing media and reactors without oxygen.
- Gas-Tight Syringes: For sampling headspace gas.
- GC System: Equipped with a thermal conductivity detector (TCD) for methane quantification.
Procedure:
- Experimental Setup: In multiple batch BMP reactors, combine a known volume of inoculum with a known mass of substrate at a defined inoculum-to-substrate ratio (e.g., 2:1 on a volatile solids basis). Include control reactors containing only inoculum to account for background gas production [65].
- Incubation: Flush the headspace of each reactor with an inert gas (N₂/CO₂) to ensure anaerobic conditions. Seal the reactors and place them in a temperature-controlled environment (e.g., 37°C for mesophilic conditions) [65].
- Gas Monitoring: At regular intervals, use a gas-tight syringe to sample the headspace of each reactor. Inject the gas sample into the GC to measure the methane concentration [65].
- Data Collection and Calculation: Monitor gas production and composition until daily methane production becomes negligible. The cumulative methane volume produced from the substrate reactors, after subtracting the methane from the control reactors, gives the biochemical methane potential of the substrate.
Diagram 1: BMP assay workflow
Protocol: Microbial Community Analysis for Process Stability
Objective: To characterize the microbial community structure in anaerobic digesters, as community composition and dynamics are critical for process stability and efficiency [65].
Materials and Reagents:
- Sample: Digested sludge from an anaerobic reactor.
- DNA Extraction Kit: For microbial genomic DNA.
- PCR Reagents: Primers targeting the 16S rRNA gene (for Bacteria and Archaea).
- Sequencing Kit: For high-throughput amplicon sequencing (e.g., Illumina).
- Bioinformatics Software: QIIME 2, Mothur, or similar pipelines.
- Reference Database: e.g., MiDAS (Microbial Database for Activated Sludge) [65].
Procedure:
- Sample Collection and DNA Extraction: Aseptically collect samples from the digester. Extract total genomic DNA from the samples using a commercial kit.
- Amplification and Sequencing: Amplify the hypervariable regions of the 16S rRNA gene via PCR. Purify the amplicons and prepare libraries for high-throughput sequencing.
- Bioinformatic Analysis: Process the raw sequence data through a standard pipeline:
- Quality filtering and denoising.
- Clustering sequences into Amplicon Sequence Variants (ASVs) or Operational Taxonomic Units (OTUs).
- Taxonomic classification using a reference database.
- Data Interpretation: Analyze the data to determine microbial diversity (alpha and beta diversity), relative abundance of key taxa (e.g., hydrolytic bacteria, acetogens, methanogens), and correlate shifts in community structure with process parameters (e.g., VFA levels, methane yield).
Diagram 2: Microbial analysis process
The Scientist's Toolkit: Essential Reagents and Materials
Table 3: Key Research Reagent Solutions for Anaerobic Digestion and Upgrading Research
| Category | Item | Function/Application |
|---|---|---|
| Process Gases | High-Purity CO₂, CH₄, N₂, H₂/CO₂ Mix (for ex-situ methanation) | Used for system calibration, creating synthetic biogas, and as a substrate for biological upgrading studies [60]. |
| Chemical Absorbents | Aqueous Amine Solutions (e.g., MEA, MDEA) | Research on chemical scrubbing efficiency, solvent degradation, and regeneration kinetics [62]. |
| Solid Adsorbents | Zeolites, Activated Carbon, Molecular Sieves | Testing for pressure swing adsorption (PSA), H₂S removal, and gas drying [62]. |
| Biological Media | Defined Mineral Media, Nutrient Supplements | Supporting the growth of specific microbial consortia in biological upgrading systems (e.g., hydrogenotrophic methanogens) [60]. |
| Analytical Standards | Certified Calibration Gas Mixtures (CH₄/CO₂/H₂S), VOC/Siloxane Standards | Essential for accurate quantification of biogas components and impurities using GC and other analytical instruments [65]. |
| Catalysts | Nickel-based Catalysts, Biochar/Carbon Composites | Investigating catalytic tar reforming in gasification and methanation processes [66]. |
Sustaining Digester Performance: Identifying and Overcoming Operational Challenges
Within the framework of a broader thesis on anaerobic digestion (AD) process optimization, the precise monitoring of Key Performance Indicators (KPIs) is fundamental for research and development. Anaerobic digestion is a multi-stage biological process involving the breakdown of organic matter by microorganisms in the absence of oxygen, leading to biogas production [67]. Gas production, gas composition, and Volatile Fatty Acid (VFA) profiles are critical KPIs that provide deep insight into the metabolic status, stability, and efficiency of the digestion process [68]. For researchers and scientists, mastering these parameters is essential for advancing process control, enhancing biogas yields, and developing innovative biorefinery concepts, such as the targeted production of valuable VFAs [69]. This document provides detailed application notes and experimental protocols for the accurate measurement and interpretation of these KPIs.
The Critical Role of KPIs in Anaerobic Digestion Research
Anaerobic digestion is a consecutive process involving hydrolysis, acidogenesis, acetogenesis, and methanogenesis [69]. VFAs, which are short-chain fatty acids with six or fewer carbon atoms (e.g., formate, acetate, propionate, butyrate), are inevitable intermediates during acidogenesis and acetogenesis [69] [70]. Their concentration and profile are a direct reflection of the balance between acid-producing and acid-consuming microbial communities.
Under stable process conditions, methanogenic archaea consume VFAs as rapidly as they are produced. However, an accumulation of VFAs indicates process imbalance, potentially leading to a pH drop, inhibition of methanogenesis, and ultimately, process failure known as "acid-crash" [69] [68]. Conversely, controlled enhancement of VFA production is an emerging research area within the biorefinery concept, where VFAs are the target products instead of biogas [69].
Similarly, biogas yield and composition are ultimate indicators of process performance. A stable process typically yields biogas with 50-60% methane, with significant deviations signaling stress or inhibition [68]. Therefore, integrated monitoring of VFAs and biogas is indispensable for advanced research and process development.
Key Process Parameters and Indicators
The table below summarizes the core parameters and indicators that must be monitored to maintain a stable AD process or to steer it towards desired outcomes, such as enhanced VFA production.
Table 1: Key Process Parameters and Indicators for Anaerobic Digestion Monitoring
| Parameter/Indicator | Description & Role in AD | Optimal or Stable Range | Monitoring Frequency |
|---|---|---|---|
| Organic Loading Rate (OLR) | The rate at which organic feedstock is supplied to the digester [68]. | Substrate-dependent; changes must be gradual. | Daily [68] |
| Hydraulic Retention Time (HRT) | The average time liquid/soluble compounds remain in the reactor [68]. | Substrate and temperature-dependent. | During process changes [68] |
| Temperature | Critical for microbial activity; operates in mesophilic (~35-38°C) or thermophilic (~55°C) ranges [67]. | ± 2°C of set point. | Twice daily [68] |
| pH | Indicates overall acidity/alkalinity; slow to change due to system buffering [68]. | 6.8 - 8.0 [68] | Twice daily [68] |
| Volatile Fatty Acids (VFAs) | Intermediates; their accumulation indicates inhibition of methanogenesis [69] [68]. | Concentration and ratios are key; see Section 4. | Twice monthly (stable), or more frequently during instability [68] |
| FOS/TAC (or IA/PA) | Ratio of volatile fatty acids (FOS) to total alkalinity (TAC); an early warning indicator of imbalance [68]. | Specific to plant biology; stable ratio is key. | Twice monthly (stable), or more frequently during instability [68] |
| Biogas Composition | Percentage of CH₄, CO₂, and trace gases like H₂S and NH₃ [68]. | 50-60% CH₄, 40-50% CO₂ [68] | Twice daily [68] |
Analytical Framework: From Sampling to Data Interpretation
A robust analytical workflow is fundamental for generating reliable data. The pathway from sample collection to data interpretation involves several critical steps to ensure analytical integrity.
Visualizing the Monitoring Workflow
The diagram below outlines the core workflow for monitoring KPIs in an anaerobic digestion process, integrating both gaseous and liquid stream analyses.
Experimental Protocols for KPI Assessment
Protocol 1: Sampling, Preservation, and Analysis of Volatile Fatty Acids
Accurate VFA analysis is highly dependent on correct sample handling to prevent ongoing microbial activity from altering the VFA profile [70].
Table 2: Protocol for VFA Sampling and Analysis
| Step | Procedure | Critical Parameters | Supporting Research |
|---|---|---|---|
| 1. Sampling | Collect sludge/broth sample from the active digester zone using pre-warmed glass bottles if maintaining temperature. Transport immediately to the lab. | Rapid handling and immediate cooling is crucial to halt microbial activity. | [70] |
| 2. Preservation | Preferred Method: Instant centrifugation. Alternatives: Chemical preservation (e.g., with Cu²⁺ salts) or immediate deep-freezing at -20°C. | Centrifugation yields highest recovery. Frozen samples must be thawed at 30°C before analysis. | [70] |
| 3. Solid-Liquid Separation | Centrifuge sample aliquots at 15,000 × g for 15 minutes. Filter the supernatant through a 0.2 μm regenerated cellulose (RC) filter. | This combination effectively removes microorganisms and solid particles for clear analytes. | [70] |
| 4. Analysis (Quantification) | Method A (Individual VFAs): Use High-Performance Liquid Chromatography (HPLC) with a Fast Fruit Column or Gas Chromatography (GC). Method B (Total VFAs): Employ the three-point titration Kapp method. | Chromatography allows for precise measurement of individual VFA concentrations and ratios. The Kapp method is a cost-effective alternative for total VFA estimation. | [70] [68] |
Interpreting VFA Data
- Individual VFAs and Ratios: Acetic acid is typically the major VFA, followed by propionic acid. The acetic-to-propionic acid ratio is a key process indicator; a drastic change signals biology shifts and instability. Accumulation of higher-chain (butyric, valeric) or branched-chain fatty acids indicates severe process imbalance [68].
- VFA as Commodities: In a biorefinery context, operational parameters (OLR, HRT, pH) can be tuned to maximize the production of specific, valuable VFAs like propionic or butyric acid, shifting the goal from biogas to chemical production [69].
Protocol 2: Monitoring Biogas Production and Composition
Biogas measurement provides direct insight into the methanogenic health and overall energy recovery efficiency of the system.
Table 3: Protocol for Biogas Characterization
| Step | Procedure | Critical Parameters | Supporting Research |
|---|---|---|---|
| 1. Gas Flow Measurement | Use a wet-tip gas meter, mass flow meter, or specialized bioreactor exhaust system to measure the total volumetric daily production. | Calibrate flow meters regularly. Record volume normalized to Standard Temperature and Pressure (STP). | [67] |
| 2. Gas Composition | Analyze biogas using a Gas Chromatograph (GC) equipped with a thermal conductivity detector (TCD). | Typical composition: 50-60% CH₄, 40-50% CO₂. Trace gases (H₂S, NH₃, H₂) must be monitored as they can be toxic/inhibitory. | [68] |
| 3. Data Correlation | Correlate changes in biogas composition and yield with changes in VFA profiles, OLR, and other process parameters. | A drop in methane content alongside rising VFAs confirms methanogenic inhibition. A rising H₂ concentration can indicate disrupted syntrophic relationships. | [69] [68] |
The Scientist's Toolkit: Essential Research Reagents and Materials
Table 4: Key Research Reagent Solutions and Materials
| Item | Function/Application | Specifications / Examples |
|---|---|---|
| Volatile Acid Standard Mix | Quantitative calibration for chromatography. Contains a mix of VFAs (e.g., formate, acetate, propionate, butyrate, etc.) at known concentrations. | Sigma-Aldrich 46975-U [70] |
| Internal Standard (for HPLC) | Used to correct for sample loss and variations during analysis. | Phenoxyacetic acid (PA) is effective due to its resistance to microbial degradation. [70] |
| Chemical Preservation Agents | To instantly halt microbial activity in liquid samples for later VFA analysis. | ZnCl₂, CuCl₂, CuSO₄, or commercial preservation kits. [70] |
| Chromatography Columns | Separation of individual VFAs in complex liquid samples. | e.g., Phenomenex Fast Fruit Column for HPLC. [70] |
| Dialysis Tubing | Alternative method for passive extraction of VFAs from sludge samples. | e.g., Visking #44114 dialysis tubing. [70] |
| Anaerobic Bioreactors | Engineered systems for process control and study. | UASB, EGSB, IC reactors with features like three-phase separators to retain biomass. [67] |
Advanced Application: Integrated Process Monitoring and Control
For advanced research, integrating these KPIs into a holistic view of the process is key. The FOS/TAC ratio serves as an early warning system. A rising ratio indicates VFA accumulation is outpacing the system's buffering capacity, allowing for corrective actions (e.g., reducing OLR, adding alkalinity) before a significant pH drop occurs [68].
Furthermore, predictive modeling is an emerging powerful tool. Models, such as those based on the modified Hill model, can simulate VFA production under varying conditions (OLR, temperature, pH, HRT), helping researchers predict process stability and optimize for VFA or methane yield with deviations as low as ±9.1% from experimental data [71]. This integrated, model-based approach is the future of sophisticated anaerobic digestion research and process control.
Anaerobic digestion (AD) is a cornerstone technology for converting organic wastes into renewable biogas. However, process stability is frequently challenged by inhibitor accumulation, leading to suboptimal methane yields or even complete system failure [72] [73]. The degradation of nitrogen-rich feedstocks—such as food waste, animal manure, and slaughterhouse waste—releases ammonia, which can become inhibitory at high concentrations [72] [73]. Imbalanced organic loading rates or carbon-to-nitrogen (C/N) ratios can cause volatile fatty acid (VFA) accumulation, acidifying the reactor and inhibiting methanogens [74] [75]. Furthermore, the presence of sulfate in wastewater enables sulfide production by sulfate-reducing bacteria, directly poisoning methanogenic archaea [76] [77] [78]. This application note provides critical quantitative thresholds, detailed experimental protocols, and validated mitigation strategies to manage these common inhibitors, ensuring robust AD operation.
Quantitative Inhibitor Thresholds and Impacts
Understanding the concentration ranges at which common inhibitors begin to affect the AD process is crucial for monitoring and diagnosis. The following table summarizes the inhibitory thresholds for ammonia, VFAs, and sulfide.
Table 1: Summary of Common Inhibitors in Anaerobic Digestion
| Inhibitor | Forms & Sources | Beneficial Range | Moderate Inhibition | Severe Inhibition | Key Influencing Factors |
|---|---|---|---|---|---|
| Ammonia | TAN (NH₃ + NH₄⁺); Degradation of proteins and urea [72] [73]. | 50–200 mg/L [72] | 1,500–3,000 mg/L TAN [73] | >3,000 mg/L TAN [73] | pH, temperature, microbial acclimation [72] [79] |
| Volatile Fatty Acids (VFAs) | Short-chain acids (e.g., acetic, propionic); Intermediate products of acidogenesis [74] [75]. | - | Acetic: >2,400 mg/L; Propionic: >900 mg/L [74] | VFA accumulation causing pH drop [75] | OLR, C/N ratio, pH, HRT [74] [75] |
| Sulfide | H₂S (toxic) and HS⁻; Sulfate reduction by SRB [76] [77]. | - | Unionized H₂S is primary toxic agent [77] [78] | Varies with system; ME-AD enhanced tolerance [77] | pH, sulfate concentration, reactor configuration [76] [77] |
Experimental Protocols for Inhibitor Monitoring and Mitigation
Protocol: Assessing and Mitigating Ammonia Inhibition
Principle: Ammonia inhibition primarily affects methanogenic archaea, with the free ammonia (NH₃) form being particularly toxic due to its ability to diffuse passively through cell membranes [72] [73]. This protocol uses acclimation to gradually build microbial tolerance.
Materials:
- Inoculum: Sampled from a functioning anaerobic digester.
- Basal Anaerobic Medium (BAm): Prepared as per Angelidaki et al. [79].
- Carbon Source: Casein or a similar proteinaceous substrate [79].
- Ammonia Source: NH₄Cl solution.
- Equipment: Serum bottles (118 mL working volume), anaerobic glove box (N₂ atmosphere), gas chromatograph, pH meter, syringe for biogas measurement.
Procedure:
- Inoculum Preparation: Sieve the inoculum to remove large particles and dilute with BAm at a 20:80 (v/v) ratio inside serum bottles within an anaerobic glove box [79].
- Baseline Operation: Feed the reactors with the carbon source and monitor baseline biogas production and pH for several generations (e.g., 21-day batches) until stable [79].
- Stepwise Adaptation: Introduce NH₄Cl at a starting concentration of, for example, 4 g NH₄⁺-N/L. Re-inoculate the culture every 21 days into fresh medium with a stepwise increase in NH₄Cl concentration (e.g., increments of 2 g/L) [79].
- Monitoring: Track key parameters weekly:
- Biogas Volume and Composition: Use a graduated syringe and GC analysis.
- VFA Profile: Analyze using GC to ensure acids are being consumed.
- pH, TAN, FAN: Measure pH and TAN, calculating FAN using established equations [79].
- Metagenomic Analysis (Optional): Periodically extract DNA from pellet samples for sequencing to track microbial community dynamics and the emergence of tolerant strains like Methanoculleus bourgensis and Acetomicrobium sp. [79].
The workflow for this adaptive process is outlined below.
Protocol: Controlling VFA Accumulation via Nitrate Recirculation
Principle: Accumulated VFAs can be consumed as a carbon source by denitrifying bacteria when nitrate is introduced. This controls VFA levels and restores pH, allowing methanogenesis to resume [74].
Materials:
- Lab-Scale CSTR: 25 L working volume, maintained at 35°C.
- Feedstock: Food waste slurry, characterized for TS, VS, and COD.
- Nitrate Source: Aerobic tank effluent with high NO₃⁻-N concentration (~1500 mg/L) [74].
- Equipment: Biogas collector with acidic, saturated NaCl solution, pumps for recirculation and feeding.
Procedure:
- System Setup & Inhibition Induction: Operate the CSTR at a high organic loading rate (e.g., 6 kg COD/m³·d) using food waste until VFA accumulation is observed, indicated by a drop in pH and biogas production [74].
- Nitrate Recirculation: When inhibition is confirmed, initiate recirculation of the aerobic tank effluent (0.5Q with ~1500 mg/L NO₃⁻-N) back to the anaerobic digester [74].
- Continuous Feeding: Continue feeding the digester with the main substrate while maintaining nitrate recirculation.
- Monitoring: Monitor the system for 50+ days, tracking:
Protocol: Alleviating Sulfide Inhibition with a Microbial Electrolysis Cell (MEC)
Principle: Integrating an MEC into an AD reactor (ME-AD) creates a weak alkaline condition at the cathode. This shifts the equilibrium from toxic unionized H₂S to less toxic ionized HS⁻, protecting methanogens [77].
Materials:
- ME-AD Reactor: Anaerobic reactor with integrated MEC (anode and cathode).
- Power Supply: To apply external voltage to the MEC.
- Sulfate-Rich Substrate: Organic waste with high sulfate content.
- Control Reactors: Conventional AD reactor (with and without pH control) for comparison.
Procedure:
- Reactor Operation: Inoculate the ME-AD reactor and operate in parallel with control reactors, feeding a sulfate-rich organic substrate [77].
- MEC Activation: Apply an external voltage to the ME-AD system to drive cathodic H₂ production.
- Performance Evaluation: Compare the following metrics against controls over multiple hydraulic retention times:
- Unionized H₂S Concentration: Should be lower in the ME-AD system.
- Methane Production: The ME-AD reactor can show 1.56 to 3.03 times higher CH₄ production than controls [77].
- Microbial Community Analysis: Analyze suspended sludge and cathode biofilm to confirm enrichment of methanogens like Methanosaeta and Methanosphaera [77].
The Scientist's Toolkit: Essential Research Reagents and Materials
Table 2: Key Reagents and Materials for Inhibitor Research
| Item | Function/Application | Example Use Case |
|---|---|---|
| NH₄Cl (Ammonium Chloride) | A source of ammoniacal nitrogen for simulating or inducing ammonia stress in batch or continuous experiments. | Stepwise adaptation to ammonia toxicity [79]. |
| Casein | A model proteinaceous carbon source that releases ammonia upon degradation, used in controlled inhibition studies. | Studying microbial community shifts under ammonia stress [79]. |
| Nitrate Salts (e.g., KNO₃) | Provide NO₃⁻-N for denitrification processes; used to control VFA accumulation by promoting their consumption as a carbon source. | Recirculation strategy to alleviate VFA inhibition [74]. |
| Photosynthetic Bacteria (PSB) | Used as a bioaugmentation seed to consume VFAs, produce alkaline substances, and recover system pH and methane production. | Recovery from VFA inhibition in illuminated reactors [75]. |
| Hydrogen Peroxide (H₂O₂) | A chemical agent used to intentionally arrest methanogenesis, redirecting the process towards VFA accumulation as a target product. | Enhancing VFA production from glucose [80]. |
| Microbial Electrolysis Cell (MEC) | An integrated system that creates a localized high-pH microenvironment at the cathode to mitigate toxic H₂S inhibition. | ME-AD configuration for treating sulfate-rich wastewater [77]. |
Effectively managing ammonia, VFAs, and sulfide is paramount for stable and efficient anaerobic digestion. Mitigation is most successful when it aligns with the underlying microbiology, such as fostering acclimated communities, leveraging cross-process interactions like denitrification, or using novel bio-electrochemical systems. The protocols and data provided here offer a foundation for researchers to diagnose, remediate, and prevent inhibition, thereby enhancing the resilience and productivity of biogas production from complex organic wastes.
Process imbalances in anaerobic digestion (AD), manifesting as foaming, scum formation, and pH fluctuations, present significant operational challenges that can severely impact biogas production efficiency and plant stability. These imbalances disrupt the delicate microbial consortia responsible for the hydrolysis, acidogenesis, acetogenesis, and methanogenesis stages of AD, potentially leading to reduced methane yields, equipment damage, and even complete process failure. Foaming alone affects a substantial proportion of full-scale facilities, with surveys indicating that 54% of wastewater treatment plants in California and 61% in the United Kingdom have reported problems with foaming in their anaerobic digesters [81]. Effective management of these imbalances requires a comprehensive understanding of their root causes, early detection methods, and proven correction strategies, all framed within the context of maintaining microbial community structure and function. This document provides researchers and scientists with application notes and experimental protocols to identify, monitor, and correct these common process imbalances, thereby supporting stable and efficient biogas production.
Foam Formation: Causes and Corrective Strategies
Mechanisms and Contributing Factors
Foam in anaerobic digesters is a complex three-phase phenomenon comprising gas, liquid, and solid phases [81]. For problematic foam to develop, three conditions must align simultaneously: high gas production, surfactants that lower surface tension, and floating solids that trap gas bubbles [82]. The formation process initiates when gas bubbles become stabilized by surfactants—compounds that reduce surface tension—and are then further stabilized by a network of filamentous microorganisms or solid particles that prevent bubble collapse [81].
The main documented causes of AD foaming can be categorized as follows:
Biological Factors: Filamentous bacteria, particularly Microthrix parvicella, act as powerful foam stabilizers rather than direct foam initiators [81] [82]. These organisms create a structural network that traps gas bubbles, transforming minor foaming incidents into persistent problems. Additionally, extracellular polymeric substances (EPS) produced by certain bacteria increase viscosity and create ideal conditions for persistent foam [82].
Operational Issues: Irregular feeding patterns, especially slug feeding of high volumes of substrate, can shock the system and trigger foaming events [82]. Studies have demonstrated that sudden increases in organic loading rate (OLR) correlate strongly with foam initiation [82]. Mixing problems represent another operational challenge, as insufficient mixing allows stratification and dead zones where biological activity becomes imbalanced [82].
Feedstock Characteristics: Certain substrates possess intrinsic foaming potential. Sugar beet silage, for instance, contains pectin and saponins that can promote foam formation [83]. Protein-rich and lipid-rich substrates also contribute to foaming tendencies [81].
Table 1: Primary Foaming Causes and Underlying Mechanisms
| Cause Category | Specific Factors | Underlying Mechanism |
|---|---|---|
| Biological | Filamentous bacteria (e.g., Microthrix parvicella) | Create structural networks that stabilize gas bubbles [81] |
| Extracellular Polymeric Substances (EPS) | Increase liquid viscosity and foam stability [82] | |
| Operational | High Organic Loading Rate (OLR) | Increases gas production rate beyond system capacity [82] |
| Irregular feeding patterns | Causes shock loading and microbial community imbalance [82] | |
| Inadequate mixing | Allows stratification and localized acidogenesis [82] | |
| Chemical | Surfactant accumulation | Reduces surface tension, facilitating bubble formation [82] |
| Alkalinity addition after acidification | Resumes gas production while volatile acids remain high [82] |
Experimental Protocols for Foam Potential Assessment
Leipzig Foaming Test
The Leipzig foaming test was developed specifically for digestates with high fiber content, typically found in biogas plants treating renewables [81].
Materials:
- Gas dispersion tube (porosity type D4)
- 500 mL graduated measuring cylinder
- Nitrogen gas supply with precise flow control
- Thermostatic water bath
- Sample of digestate or substrate
Procedure:
- Place 200 mL of sample in the graduated measuring cylinder.
- Maintain constant temperature of 35°C using the thermostatic water bath.
- Connect the nitrogen supply to the gas dispersion tube immersed in the sample.
- Apply a constant nitrogen flow rate of 1.5 L/min for 10 minutes.
- Measure the foam height immediately after gas supply cessation (H0) and after 5 minutes (H5).
- Calculate foam stability as the ratio H5/H0.
Interpretation: Samples with H0 > 300 mm and H5/H0 > 0.7 indicate high foaming potential requiring preventive measures.
Aeration Method for Low-Fiber Digestates
This method is suitable for digestates with low fiber content, typically found in anaerobic digesters of wastewater treatment plants [81].
Materials:
- 1 L graduated cylinder
- Compressed air supply with flow regulator
- Porous stone diffuser
- Stopwatch
Procedure:
- Fill the graduated cylinder with 500 mL of digestate sample.
- Place the porous stone diffuser at the bottom of the cylinder.
- Apply air at a constant flow rate of 1 L/min for 5 minutes.
- Record the maximum foam height during aeration.
- Continue monitoring for 10 minutes post-aeration to observe foam collapse behavior.
Interpretation: Foam heights exceeding 30% of the liquid volume indicate significant foaming potential. Persistent foam (>5 minutes after aeration cessation) suggests stabilization by filamentous organisms or surfactants.
Corrective and Preventive Measures for Foaming
When facing active foaming events, implement the following immediate actions:
- Adjust Feeding Regime: Temporarily reduce the organic loading rate by 25-50% to lower gas production [82].
- Mechanical Intervention: Increase mixer speed to the highest setting to physically disrupt foam structure [81].
- Antifoam Application: Apply targeted antifoaming agents such as rapeseed oil or oleic acid, which have demonstrated effectiveness in manure-based biogas reactors [81]. Silicon-based antifoams should be used cautiously as they may introduce siloxanes into the biogas [82].
For long-term foam prevention:
- Substrate Management: Pre-treat susceptible substrates like sugar beet silage with pectinase enzymes to degrade pectin, a known foam promoter [83].
- Process Monitoring: Regularly track the volatile acid to alkalinity ratio as an early warning indicator of impending foaming events [82].
- Microbial Community Management: Control filamentous bacteria in upstream aerobic treatment processes to prevent their transfer to anaerobic digesters [81].
pH Fluctuations: Monitoring and Control Protocols
Impact of pH on Process Stability and Microbial Communities
pH is a critical parameter in anaerobic digestion, directly influencing microbial activity, metabolic pathways, and overall process stability. The optimal pH range for most anaerobic digesters is 6.8 to 7.2, though the process can tolerate a range of 6.5 to 8.0 [84]. Deviations from this range disrupt the delicate balance between acid-producing and methane-producing microorganisms, potentially leading to process acidification and failure.
The specific impacts of pH variations include:
- Hydrolysis and Acidogenesis: These initial stages of AD can proceed effectively at lower pH values (5.5-6.5), with research showing improved phosphorous release at pH 5.5 [85].
- Methanogenesis: Methane-producing archaea are highly sensitive to pH fluctuations, with optimal activity between pH 6.8 and 7.2 [84] [86]. At pH values below 6.5, methanogenic activity decreases significantly, leading to volatile fatty acid (VFA) accumulation and further pH depression—a self-propagating cycle known as "sour" digestion.
- Nutrient Availability: pH affects the solubility and bioavailability of essential nutrients and trace elements, with low pH operations demonstrating increased release of phosphorus, magnesium, and calcium [85].
Table 2: pH Effects on Anaerobic Digestion Performance Parameters
| pH Value | Methane Yield | VFA Accumulation | Phosphorus Release | Microbial Community Shift |
|---|---|---|---|---|
| 5.0 | Severe inhibition (>70% reduction) | Significant propionic and butyric acid accumulation | Maximum release (74±5.0%) | Dominance of acidogenic bacteria [85] |
| 5.5 | ~50% reduction | High VFA levels, primarily propionic and butyric acids | Significant enhancement | Inhibition of methanogens [85] |
| 6.5 | Moderate reduction (10-20%) | Moderate VFA accumulation | Moderate release | Balanced communities with reduced methanogenic diversity [85] [86] |
| 7.0 | Optimal production | Minimal VFA accumulation | Limited release | Balanced microbial communities with diverse methanogens [86] |
| 8.0 | Slight reduction | Possible inhibition of acidogenesis | Limited release | Shift toward alkali-tolerant species [86] |
pH Control Strategies and Experimental Setups
Continuous pH Monitoring and Control System
Maintaining stable pH conditions requires sophisticated monitoring and control systems. Recent research has demonstrated differences in reactor performance between daily pH adjustments and continuous dosing approaches [86].
Materials:
- pH controller (e.g., Bluelab pH probe connected to LabVIEW)
- Precision peristaltic pumps for acid/base addition
- Arduino MEGA 2560 microcontroller
- Reactor vessel with mixing capability
- 1M NaOH and 1M HCl solutions for pH adjustment
Procedure for Continuous Dosing Setup (CDS):
- Calibrate pH probe using standard buffers (pH 4.0, 7.0, and 10.0).
- Set desired pH setpoint on the controller (e.g., pH 7.0).
- Program the microcontroller to read pH values every minute.
- Configure peristaltic pumps to deliver small volumes of acid or base solution as needed to maintain setpoint.
- Monitor system performance, including gas production and ammonium concentration.
Procedure for Daily Dosing Setup (DDS):
- Extract 10 mL sample from reactor once daily.
- Measure pH using calibrated benchtop pH meter.
- Calculate required acid or base volume to return pH to setpoint.
- Add correction dose to reactor while mixing.
- Record pH values and dosing volumes.
Comparative Analysis: Research indicates that while continuous pH control provides enhanced gas production rates, there is negligible difference in ammonium release rates between continuous and daily dosing approaches [86].
Protocol for Low pH Operation to Enhance Phosphorus Recovery
Operating digesters at controlled low pH values can enhance phosphorus recovery, though with trade-offs in methane production [85].
Materials:
- Laboratory-scale continuous anaerobic digesters
- pH control system (as described in 3.2.1)
- Centrifuge for solids separation
- UV-Vis spectrophotometer for ammonium analysis (e.g., Agilent Technologies Cary 60)
- Merck Spectroquant ammonium test kits
Procedure:
- Establish stable anaerobic digestion at neutral pH using waste activated sludge.
- Gradually decrease pH setpoint to target value (e.g., pH 5.5) over 24 hours to avoid shocking microbial community.
- Maintain pH for predetermined retention time with continuous mixing.
- Monitor volatile fatty acids (VFAs) daily using gas chromatography.
- Measure soluble phosphorus, magnesium, and calcium concentrations in centrifuged samples.
- Quantify ammonium concentration using spectrophotometric methods at 690 nm wavelength.
- Compare methane production and phosphorus release rates with control reactor at neutral pH.
Expected Outcomes: At pH 5.5, expect approximately 74% phosphorus release along with associated cations, but with a 50% reduction in methane production due to VFA accumulation [85].
Scum Formation and Management Strategies
Composition and Formation Mechanisms
Scum formation represents a significant operational challenge in anaerobic digesters, characterized by the accumulation of floating materials that resist integration into the liquid matrix. Scum typically consists of fibrous materials, greases, fats, and floating solids that create a stratified layer at the liquid surface. This layer impedes gas release, reduces effective digester volume, and can lead to blockages in piping systems.
The primary mechanisms driving scum formation include:
- Density Differences: Materials with lower density than the digester liquid, particularly lipids and long-chain fatty acids, naturally rise to the surface [82].
- Incomplete Mixing: Inadequate mixing energy fails to maintain homogeneous conditions, allowing buoyant materials to separate and accumulate [82].
- Polymer Aggregation: Fibrous materials from agricultural residues (e.g., straw, crop residues) and filamentous microorganisms form entangled networks that trap gases and other particulates, enhancing flotation [81] [87].
Experimental Assessment of Scum Formation Potential
Flotation Test Protocol
Materials:
- 1 L Imhoff cones
- Mechanical stirrer
- Drying oven
- Muffle furnace for ash content determination
Procedure:
- Homogenize representative sample of feedstock.
- Place 500 mL sample in Imhoff cone.
- Allow sample to settle for 30 minutes without disturbance.
- Gently stir surface with spatula to simulate minimal mixing.
- Record volume of floating material after 1 hour.
- Separate floating layer and determine its composition (volatile solids, fiber content, lipid content).
Interpretation: Samples with >10% floating volume after 1 hour indicate high scum formation potential. High lipid or fiber content in the floating fraction confirms scum propensity.
Scum Prevention and Control Strategies
Effective scum management requires a multi-faceted approach:
- Feedstock Pretreatment: Mechanical maceration of fibrous substrates reduces particle size and disrupts fibrous networks that contribute to scum formation [87].
- Mixing Optimization: Ensure adequate mixing energy input to maintain homogeneous conditions and prevent flotation. The Landia GasMix system has demonstrated effectiveness in full-scale applications by introducing mixing specifically designed to disrupt surface layers [82].
- Operational Modifications: Regularly remove accumulated scum to prevent buildup. Implement gradual feeding strategies to avoid sudden introduction of scum-forming materials.
- Chemical Additives: Carefully selected enzymes (lipases, cellulases) can break down scum components, though dosage must be optimized to avoid inhibition of anaerobic microorganisms [83].
Integrated Process Monitoring and Control Framework
Key Monitoring Parameters and Early Warning Indicators
Successful management of process imbalances requires comprehensive monitoring of key parameters that serve as early warning indicators. The following parameters should be tracked regularly:
- Volatile Fatty Acids (VFA) to Alkalinity Ratio: This ratio provides a sensitive indicator of impending acidification. Values exceeding 0.3-0.4 g acetic acid/g CaCO₃ suggest increasing acidification risk [85] [82].
- Gas Composition: Decreasing methane percentage while carbon dioxide rises indicates methanogen inhibition, often preceding foaming events [82].
- Ammonium Nitrogen: Concentrations above 1500-3000 mg/L can inhibit methanogenesis, particularly at higher pH values [86].
- Hydrogen Sulfide: Elevated H₂S concentrations (>500 ppm) not only affect biogas quality but also serve as indicators of sulfur imbalance [87].
Table 3: Research Reagent Solutions for Anaerobic Digestion Studies
| Reagent/Material | Function/Application | Experimental Notes |
|---|---|---|
| Sodium Hydroxide (NaOH) | pH adjustment in acidic conditions | Use 1M solution for DDS, 0.25M for CDS to allow finer control [86] |
| Hydrochloric Acid (HCl) | pH adjustment in alkaline conditions | Concentration should match base solution for symmetrical response [86] |
| Rapeseed Oil | Antifoaming agent | Effective dosage: 0.1% of feed volume; avoids siloxane contamination [81] |
| Pectinase Enzymes | Substrate pretreatment | Reduces foaming potential of sugar beet silage by degrading pectin [83] |
| Spectroquant Test Kits | Ammonium concentration analysis | UV-Vis measurement at 690nm after reaction [86] |
| Oleic Acid | Antifoaming agent | Particularly effective in manure-based reactors [81] |
Diagnostic and Decision-Support Workflow
The following diagram illustrates the integrated approach for diagnosing and correcting process imbalances in anaerobic digestion systems:
Advanced Intervention Strategies
When conventional corrective measures prove insufficient, advanced interventions may be necessary:
Microaeration: Controlled oxygen injection at 1-5% of the biogas production rate can reduce hydrogen sulfide concentrations through sulfur-oxidizing bacteria activity, with full-scale systems achieving 68-99% H₂S removal [87]. Optimal redox conditions are generally maintained between -300 and -150 mV [87].
Two-Stage Digestion: Separating acidogenesis and methanogenesis into dedicated reactors allows optimization of pH conditions for each stage. Research indicates optimal conditions for two-stage digestion occur with acidogenic pH of 5.5-6.2 and methanogenic pH of 6.8-7.4 [85].
Bioaugmentation: Specific microbial inoculants can be introduced to enhance degradation of persistent compounds or restore balanced microbial communities following process upsets.
Effective management of foaming, scum formation, and pH fluctuations in anaerobic digestion systems requires integrated approach combining vigilant monitoring, prompt intervention, and preventive strategies. Key to sustainable operation is recognizing that these process imbalances are interconnected—pH fluctuations can trigger foaming events, while scum formation can exacerbate pH instability through reduced mixing efficiency. The protocols and strategies outlined herein provide researchers and plant operators with evidence-based methodologies to maintain process stability and optimize biogas production. Future research directions should focus on developing robust early warning indicators through advanced sensor technology, refining microaeration control strategies, and exploring microbial community management approaches that enhance system resilience to feedstock variations and operational disturbances.
Optimizing Feeding Regimes and Hydraulic Retention Time (HRT) for Stable Operation
Application Notes: Operational Guidelines for Enhanced Process Stability
Strategic Advantages of Discontinuous Feeding Regimes
Recent research establishes discontinuous (or intermittent) feeding as a superior strategy for enhancing process stability in anaerobic digestion (AD). This approach involves administering the substrate in distinct pulses rather than a continuous, steady stream.
The core advantage lies in its ability to foster a more resilient and diverse microbial community. Studies confirm that discontinuous feeding promotes the growth and maintenance of Methanosarcina species alongside Methanosaeta, creating a more robust methanogenic consortium [88]. Methanosarcina possesses a higher substrate uptake rate and greater resistance to low pH values, which provides the digester with a higher functional resilience against organic overloading events [88]. This increased stability was demonstrated in lab-scale reactors, where discontinuously fed systems recovered pre-disturbance pH within a day and VFA concentrations within a week after an organic overload, while continuously fed reactors experienced process failure [88]. Furthermore, this enhanced stability is achieved without a loss in process efficiency, as methane production rates can reach theoretical maximums with VFA conversion efficiencies exceeding 99% [88].
Optimizing Hydraulic Retention Time (HRT) and Organic Loading Rate (OLR)
HRT and OLR are intrinsically linked critical parameters. Optimizing them is essential for stable operation, particularly during the start-up phase of a digester. Table 1 summarizes key operational parameters and their optimal ranges for process stability.
Table 1: Key Operational Parameters for Anaerobic Digestion Stability
| Parameter | Optimal or Demonstrated Range | Impact on Process Stability |
|---|---|---|
| Feeding Regime | Discontinuous (e.g., once/24h or 48h) | Promotes microbial diversity and functional resilience against overloading [88]. |
| HRT | 10 - 40 days (depending on system configuration) | A two-stage system shifted from HRT of 20d (R1) & 40d (R2) to 10d (R1) & 10d (R2) successfully, though it required careful VFA management [89]. |
| OLR | 0.25 - 0.50 g VS/L/day (during start-up) | An increase from 0.25 to 0.50 g VS/L/day, coupled with an HRT reduction to 10 days, required halting feeding to the second-stage reactor during VFA accumulation to restore pH [89]. |
| pH | 6.8 - 7.2 [90] | Crucial for microbial activity, especially methanogens. A pH of 7.00 was targeted for restoration after an instability event [89]. |
| Temperature | Mesophilic (35-37°C) [90] | Provides a stable environment for a wide range of microbial consortia. |
| VFA/Alkalinity Ratio | < 0.3 (as FOS/TAC); 0.76 caused instability [89] | A key indicator for imminent acidification risk. Monitoring is essential for early intervention. |
Manipulating HRT and OLR requires careful monitoring. In a two-stage semi-continuous mesophilic AD study, reducing the HRT from 20 to 10 days in the first stage while simultaneously increasing the OLR from 0.25 to 0.50 g VS/L/day caused a dramatic shift: methane production in the first stage dropped, favoring hydrogen production, and the VFA/alkalinity ratio reached an alarming 0.76 [89]. The successful mitigation strategy was to temporarily halt feeding to the second-stage reactor, allowing the pH to restore to 7.00 and methanogenic activity to recover, evidenced by methane content increasing from 39.15% to 67.48% [89].
Experimental Protocols
Protocol: Establishing a Discontinuous Feeding Regime for Enhanced Resilience
This protocol is adapted from studies that successfully increased the functional resilience of anaerobic microbial communities through feeding strategy [88].
Research Reagent Solutions & Essential Materials
Table 2: Key Reagents and Materials for Feeding Regime Experiments
| Item | Function/Description | Experimental Relevance |
|---|---|---|
| Lab-Scale CSTR Reactors | Continuously Stirred Tank Reactors (e.g., 1-10 L working volume) | Core vessel for the anaerobic digestion process. |
| Substrate | Volatile Fatty Acids (VFA) mixture or complex organic waste (e.g., food waste simulant). | The organic material to be converted into biogas. A defined VFA mix simplifies studying acetogenesis and methanogenesis. |
| Inoculum | Adapted anaerobic digestate from a functioning biogas plant. | Source of the microbial consortium necessary for digestion. |
| pH Probe & Meter | For continuous or frequent pH monitoring. | Critical for tracking process stability and detecting acidification. |
| Gas Chromatograph (GC) | For measuring biogas composition (CH₄, CO₂, H₂). | Essential for quantifying process performance and metabolic pathways. |
| Alkalinity Test Kit | For measuring total alkalinity (TAC) or bicarbonate alkalinity. | Used with VFA data to calculate the VFA/Alkalinity ratio (FOS/TAC), a key stability indicator. |
Methodology
- Reactor Setup & Inoculation: Set up at least two parallel lab-scale CSTR reactors. Inoculate both with the same volume of well-adapted anaerobic digestate. Maintain mesophilic temperature (e.g., 37°C) throughout the experiment.
- Baseline Operation: Operate both reactors with the same HRT and OLR for at least three retention times to establish a stable baseline performance.
- Experimental Feeding Application:
- Control Reactor (Rconti): Apply feeding continuously using a peristaltic pump, distributing the total daily substrate load evenly over 24 hours.
- Test Reactor (Rdisco): Apply the same total daily substrate load as a single, rapid pulse once every 24 hours.
- Monitoring & Data Collection: During an experimental "training" phase (several HRTs), monitor the following parameters frequently:
- Biogas: Volume production rate and composition.
- Liquid Phase: pH, VFA concentration (individual and total), and total alkalinity.
- Resilience Challenge Test: Subject both reactors to an identical organic overloading disturbance (e.g., a sudden, temporary increase in OLR). Monitor the recovery time for key parameters (pH, VFA) to return to their pre-disturbance levels.
Workflow Visualization
The following diagram illustrates the logical workflow and comparative design of the protocol for assessing feeding regimes.
Protocol: HRT and OLR Optimization during Two-Stage AD Start-Up
This protocol is based on research that stabilized the start-up of a two-stage, semi-continuous mesophilic AD system for food waste [89].
Research Reagent Solutions & Essential Materials
Table 3: Key Reagents and Materials for HRT/OLR Start-Up Experiments
| Item | Function/Description |
|---|---|
| Two-Stage Reactor System | Two interconnected CSTRs; first stage for hydrolysis/acidogenesis, second for methanogenesis. |
| Synthetic Food Waste | Standardized substrate (e.g., 50% vegetables, 20% fruits, 20% rice/noodles, 5% meat, 2.5% fish/eggs) [89]. |
| Inoculum | Anaerobic digestate from a functioning AD plant. |
| VFA Analysis (HPLC/GC) | For precise quantification of individual VFAs (acetic, propionic, butyric acids). |
| Hydraulic Controls | Pumps and timers for accurate control of HRT in semi-continuous operation. |
Methodology
- Substrate and Inoculum Preparation: Prepare the synthetic food waste substrate, removing inert materials. Characterize its total and volatile solids (TS/VS) content.
- System Inoculation and Start-Up: Charge both reactor stages with inoculum. Begin operation with a conservative OLR (e.g., 0.25 g VS/L/day) and HRT (e.g., 20 days for Stage 1, 40 days for Stage 2).
- Parameter Monitoring: Monitor daily biogas production and composition, pH, VFA, and alkalinity in both reactors.
- Parameter Adjustment and System Stabilization: Gradually decrease HRT and increase OLR (e.g., to HRT 10 days for both reactors and OLR 0.50 g VS/L/day).
- Instability Management: If the VFA/alkalinity ratio exceeds a critical threshold (e.g., >0.6-0.7) and pH drops, halt the feeding to the second-stage reactor. Continue feeding the first stage to avoid shocking its acidogenic community. Resume feeding the second stage only after VFAs have been consumed and pH has restored to a safe level (e.g., ~7.00).
Workflow Visualization
The following diagram illustrates the sequential process and decision points for managing HRT and OLR during system start-up.
In the context of anaerobic digestion (AD) for biogas production, the microbial community (MC) is the fundamental engine driving the process, converting organic waste into methane-rich biogas. However, the AD process has traditionally been treated as a "black box," where the complex composition, dynamics, and functional interactions of the microbes within remain obscure, hampering efforts to optimize process stability and biogas yields [91]. Metagenomics, the direct sequencing and analysis of genetic material recovered from an environmental sample, has emerged as a revolutionary tool for demystifying this black box [91]. By enabling researchers to decipher the taxonomic composition and functional potential of the AD microbiome without the need for cultivation, metagenomics provides unprecedented insights for diagnostic monitoring and enhancing the resilience of biogas production systems. This Application Note details protocols for metagenomic analysis and demonstrates how the resulting data can be leveraged to manage microbial communities effectively, ensuring stable and efficient biogas production.
Metagenomic Workflow for AD Microbial Community Analysis
The following section outlines the standard protocol for a metagenomic analysis of an AD microbial community, from sample collection to data interpretation. The workflow can be adapted based on the specific diagnostic question and available sequencing resources.
Sample Collection and DNA Extraction
Protocol:
- Sample Source: Collect samples (e.g., 50 mL) of the fermenter content (digestate) from the main digestion chamber. For process monitoring, consistent sampling location and timing relative to feeding cycles are critical.
- Preservation: Immediately preserve samples on ice or at -20°C for short-term storage (up to 24 hours) or at -80°C for long-term storage to prevent microbial community shifts and DNA degradation.
- Community DNA Extraction: Use a commercial soil or stool DNA extraction kit, as these are optimized for complex environmental samples and cells with tough cell walls. The protocol typically involves:
- Cell Lysis: A combination of mechanical disruption (e.g., bead beating) and chemical/enzymatic lysis to ensure comprehensive breakdown of diverse microbial cell types.
- DNA Purification: Binding DNA to a silica membrane, washing away contaminants, and eluting high-purity DNA.
- Quality Control: Assess DNA concentration using a fluorometer and DNA purity (A260/A280 ratio) via spectrophotometry. Verify DNA integrity by agarose gel electrophoresis.
Sequencing Strategies: Short-Read, Long-Read, and Hybrid Approaches
The choice of sequencing technology significantly impacts the quality and depth of the metagenomic analysis. The table below compares the key characteristics of the predominant approaches.
Table 1: Comparison of Metagenomic Sequencing Approaches for Anaerobic Digestion
| Feature | Short-Read (Illumina) | Long-Read (Oxford Nanopore, PacBio) | Hybrid Approach |
|---|---|---|---|
| Read Length | Short (75-300 bp) | Long (10+ kbp) | Combination of short and long |
| Error Rate | Low (~0.1%) | High (1-15%) | Compensates for high error rate |
| Primary Advantage | High accuracy, low cost | Long contigs, better assembly | Improved assembly continuity & completeness |
| Utility in AD | Species-level taxonomy, functional profiling | Recovery of high-quality Metagenome-Assembled Genomes (MAGs) | Superior MAG quality; identification of new species [92] |
| Example Outcome | Identification of dominant genera (e.g., Methanothrix, Syntrophomonas) | Closure of near-complete microbial genomes | Recovery of 27 MAGs, 18 representing novel species [92] |
Protocol Recommendation: For a comprehensive analysis, a hybrid approach is recommended. This involves sequencing the same community DNA sample on both an Illumina platform (for accuracy) and a long-read platform like Oxford Nanopore (for continuity). The datasets are then co-assembled using bioinformatic tools like MetaSPAdes or OPERA-MS, which leverage the strengths of both data types to produce more complete and accurate genomes from complex communities [92].
Bioinformatic Analysis and Data Interpretation
Protocol:
- Quality Control & Preprocessing: Use tools like FastQC and Trimmomatic to assess read quality and remove adapter sequences and low-quality bases.
- Assembly: Assemble the quality-filtered reads into longer contiguous sequences (contigs) using an appropriate metagenomic assembler (e.g., MEGAHIT for Illumina-only, Flye for Nanopore-only, or MetaSPAdes for hybrid data).
- Binning: Group contigs into Metagenome-Assembled Genomes (MAGs) based on sequence composition (k-mer frequency) and abundance coverage across samples using tools such as MetaBAT2, MaxBin2, or CONCOCT.
- Taxonomic & Functional Annotation:
- Taxonomy: Classify MAGs and unbinned reads against reference databases (e.g., GTDB, SILVA) using tools like Kaiju or CAT.
- Function: Annotate genes against functional databases (e.g., KEGG, COG, Pfam) using tools like PROKKA or eggNOG-mapper to reconstruct metabolic pathways.
The following diagram illustrates the complete metagenomic analysis workflow.
Diagram 1: Metagenomic analysis workflow for AD microbiomes.
Diagnostic Applications: Linking Community State to Process Parameters
Metagenomic data becomes powerful for diagnostics when correlated with operational data. Shifts in microbial community structure and function can serve as early warnings of process imbalance.
Application Protocol:
- Time-Series Sampling: Regularly sample the digester (e.g., weekly) during stable operation and throughout planned or unplanned process changes (e.g., increased organic loading rate (OLR), substrate change).
- Metagenomic Profiling: Perform 16S rRNA amplicon sequencing for rapid, cost-effective community profiling or shotgun metagenomics for deeper functional insights.
- Data Integration: Correlate taxonomic and functional shifts with chemical process parameters (e.g., VFA concentration, pH, biogas yield and composition).
Table 2: Microbial Indicators for Diagnostic Monitoring of Anaerobic Digesters
| Process Condition | Key Microbial Indicators | Metagenomic Insight | Corrective Action Implication |
|---|---|---|---|
| Stable Operation | High abundance of acetoclastic Methanothrix [92] | Balanced metabolic pathways; efficient acetate conversion to CH₄ | Maintain current parameters. |
| High Organic Load | Shift from Methanothrix to Methanosarcina; rise in fermentative bacteria [91] [92] | Methanosarcina tolerates higher VFA/acetic acid concentrations [92] | Community is adapting resiliently; monitor VFAs closely to prevent inhibition. |
| Acid Accumulation | Decline in methanogen abundance; increase in acidogenic bacteria (e.g., Lactobacillus) [91] | Inhibition of methanogenesis; buildup of acidogenesis products | Diagnose cause of VFA buildup; consider adding buffering agent or reducing OLR. |
| Presence of Syntrophic Oxidizers | Detection of Syntrophomonas (butyrate), Syntrophobacter (propionate) [92] | Community possesses key guilds for breaking down problematic VFAs | Indicator of process stability and resilience to fatty acid shocks. |
Enhancing Digester Resilience through Microbial Management
A resilient microbial community can maintain stable biogas production despite fluctuations in feedstock or operating conditions. Metagenomics allows for the proactive management of this resilience.
Building Synthetic Microbial Communities (SynComs)
Protocol: Enrichment and Bioaugmentation
- Identification: Use metagenomic data from high-performing digesters to identify key microbial taxa responsible for stress tolerance (e.g., Methanosarcina) or the degradation of recalcitrant compounds.
- Enrichment Culture: Isolate these target microbes by creating an enrichment culture that mimics the AD environment and supplies specific substrates or stressor compounds.
- Formulation: Grow the enriched consortium to a high density and formulate it for storage (e.g., pelletization, encapsulation).
- Bioaugmentation: Inoculate the formulated SynCom into a stressed or underperforming digester to introduce or bolster a specific metabolic function, thereby restoring process stability [93].
Informing Operational Decisions to Favor a Resilient Microbiome
Metagenomics can guide operational strategies that select for a robust and functionally redundant community.
- Feeding Regime Management: Discontinuous (pulse) feeding has been shown to favor the more robust methanogen Methanosarcina over Methanothrix, thereby increasing community resilience against organic overloading [92]. Metagenomic monitoring can validate this shift in real-world systems.
- Substrate Co-Digestion: Introducing a diverse mix of substrates can promote a more metabolically diverse microbial community. Metagenomics can confirm whether this leads to higher functional redundancy, where multiple species can perform the same critical function, thereby buffering the system against perturbations [93].
The following diagram illustrates the core mechanisms through which a managed microbial community achieves resilience, driven by metagenomic insights.
Diagram 2: Metagenomics-driven path to digester resilience.
The Scientist's Toolkit: Essential Reagents and Materials
Table 3: Key Research Reagent Solutions for Metagenomic Analysis of AD Microbiomes
| Item | Function / Application | Example / Note |
|---|---|---|
| DNA Extraction Kit | Isolation of high-molecular-weight, inhibitor-free community DNA from complex digestate. | Kits designed for soil or stool (e.g., DNeasy PowerSoil Pro Kit, MoBio). Critical for downstream success. |
| Library Prep Kit | Preparation of sequencing-ready libraries from DNA. | Illumina DNA Prep or Nanopore Ligation Sequencing Kit. Choice depends on sequencing platform. |
| 16S rRNA Primers | Amplification of hypervariable regions for taxonomic profiling. | Primers targeting V4 region (e.g., 515F/806R) for bacterial and archaeal diversity. |
| Positive Control DNA | Quality control for library preparation and sequencing runs. | Genomic DNA from a known organism (e.g., E. coli, M. smithii). |
| Bioinformatic Pipelines | Integrated software suites for end-to-end metagenomic data analysis. | ATLAS, metaWRAP, or nf-core/mag. Standardizes workflow and improves reproducibility. |
| Reference Databases | For taxonomic classification and functional annotation of sequences. | GTDB, SILVA (taxonomy); KEGG, eggNOG (function). Requires regular updates. |
The transition from treating the anaerobic digester as a black box to managing it as a well-understood microbial ecosystem is now achievable through metagenomics. The protocols and applications detailed in this note provide a framework for researchers and engineers to implement metagenomic diagnostics. By systematically applying these tools to monitor microbial community structure and function, it is possible to not only diagnose the causes of process instability but also to proactively engineer more resilient and efficient biogas production systems. The integration of metagenomic insights with operational management represents the future of optimized, reliable bioenergy production.
Quantifying Efficiency and Impact: Analytical Methods, Market Trends, and Policy Drivers
Anaerobic digestion (AD) is a complex biological process that converts organic matter into biogas, primarily methane and carbon dioxide, through the coordinated activity of diverse microbial consortia in oxygen-free environments [22] [94]. This process represents a sustainable technology for simultaneous waste management and renewable energy production, playing a crucial role in circular bioeconomy strategies and climate mitigation efforts [94]. The efficiency of AD systems is fundamentally governed by the intricate relationship between process operational parameters and the structure, function, and activity of microbial communities responsible for the multi-stage degradation process [22] [95].
Assessing digestion efficiency requires a multifaceted approach that integrates traditional physicochemical parameters with advanced microbial community analysis. Conventional monitoring of operational parameters such as pH, temperature, volatile fatty acids, biogas composition, and alkalinity provides valuable real-time data on process status but offers limited predictive capability for process stability or insight into microbial community dynamics [22]. The integration of molecular biological techniques with conventional process monitoring has revolutionized our understanding of AD systems, enabling researchers to link microbial community structure and function to process performance [22] [95].
This application note provides a comprehensive framework for assessing anaerobic digestion efficiency through the integration of conventional physicochemical analysis and advanced microbial population assessment techniques. Designed for researchers, scientists, and biotechnology professionals working in renewable energy and waste valorization, the protocols outlined herein facilitate a holistic understanding of AD system performance essential for process optimization, troubleshooting, and predictive modeling.
Key Parameters for Assessing Digestion Efficiency
Conventional Process Parameters
Traditional monitoring of anaerobic digestion systems relies on physicochemical parameters that provide immediate indicators of process status and stability. These parameters are readily measurable and offer valuable insights into the metabolic state of the microbial community.
Table 1: Key Conventional Parameters for AD Efficiency Assessment
| Parameter | Optimal Range | Significance | Analysis Methods |
|---|---|---|---|
| Volatile Solids Reduction (VSR) | 50-70% | Indicator of organic matter degradation efficiency | Mass balance calculation pre/post digestion |
| pH | 6.5-7.5 [96] [94] | Critical for methanogen activity; reflects acid-base balance | Potentiometric measurement |
| Volatile Fatty Acids (VFA) | <500 mg/L as acetate | Indicator of acid accumulation and process imbalance | GC, HPLC, or titration |
| Alkalinity | 2000-5000 mg/L as CaCO₃ | Buffering capacity against acid accumulation | Titration method |
| VFA/TA Ratio | <0.3 [97] | Stability indicator; >0.3 suggests potential instability | Calculated from VFA and alkalinity |
| Biogas Composition | CH₄: 55-70%, CO₂: 30-45% | Process performance and metabolic pathway indicator | GC, portable biogas analyzers |
| C/N Ratio | 20-30:1 [96] [98] | Nutrient balance for microbial growth | Elemental analysis |
| Temperature | Mesophilic: 35-40°C [96] | Microbial activity and community structure determinant | Continuous monitoring |
Volatile Solids Reduction (VSR) serves as a primary indicator of digestion efficiency, reflecting the extent of organic matter mineralization. In operational contexts, thermal hydrolysis pretreatment has been shown to significantly enhance VSR, with full-scale implementations demonstrating improved biodegradability and subsequent biogas yield [97]. The carbon-to-nitrogen (C/N) ratio is another critical parameter, with optimal ranges between 20-30:1 ensuring proper nutrient balance for microbial growth while preventing ammonia inhibition [96] [98].
Process stability is frequently assessed through the VFA/TA (volatile fatty acids/total alkalinity) ratio, also known as the Ripley ratio. Values below 0.3 generally indicate stable process conditions, while excursions beyond this threshold may suggest imminent process imbalance requiring intervention [97]. This ratio is particularly valuable as it reflects the dynamic balance between acid-producing and acid-consuming microbial communities in the digester.
Microbial Community Parameters
Advanced understanding of AD efficiency requires characterization of the microbial communities responsible for the complex transformation of organic matter to biogas. Molecular biological techniques provide unprecedented insight into community structure, function, and dynamics.
Table 2: Microbial Community Assessment Parameters for AD Efficiency
| Parameter | Target | Information Provided | Application in AD |
|---|---|---|---|
| 16S rRNA/rDNA Sequencing | Bacterial and archaeal communities | Taxonomic composition, diversity, community structure | Community dynamics, response to perturbations |
| mcrA Gene Quantification [95] | Methanogenic archaea | Abundance of methanogens | Methanogenic capacity, process stability |
| ARISA [95] | Bacterial and archaeal communities | Community fingerprinting, temporal dynamics | Start-up monitoring, community succession |
| Metagenomics | Total microbial community | Functional potential, metabolic pathways | Process optimization, inhibition studies |
| Metaproteomics [22] | Expressed proteins | Functional activity, metabolic state | Process activity, biomarker identification |
| Specific Methanogenic Activity (SMA) [98] | Methanogenic archaea | Activity of methanogenic populations | Biodegradability assessment, toxicity screening |
The start-up phase of anaerobic digesters is particularly crucial for establishing stable microbial communities that determine long-term process performance. Monitoring during the first 240 days of operation reveals distinct spatial and temporal patterns in both bacterial and archaeal communities, with community structures potentially becoming "founder determined" during this period [95]. The methyl-coenzyme reductase A (mcrA) gene serves as a valuable biomarker for methanogenic archaea, with quantitative PCR (qPCR) assays enabling tracking of methanogen population dynamics in response to operational changes [95].
Automated ribosomal intergenic spacer analysis (ARISA) provides a high-throughput fingerprinting technique for monitoring community changes over time, with statistical analysis of ARISA patterns allowing identification of distinct subgroups and transitions correlated with operational parameters [95]. When augmented by targeted deep sequencing, this approach offers valuable insight into the microbial underpinnings of process performance.
Experimental Protocols
Protocol 1: Comprehensive Process Efficiency Monitoring
This protocol outlines a standardized approach for assessing anaerobic digestion efficiency through conventional physicochemical parameters.
Materials and Reagents:
- pH meter with temperature compensation
- Gas chromatograph with TCD and FID detectors
- Titration apparatus for alkalinity and VFA analysis
- Oven and muffle furnace for solids analysis
- Inoculum and substrate characterized for key parameters
Procedure:
Sample Collection and Preparation:
- Collect representative samples from fermenter and post-digester (if applicable)
- For slurry samples, homogenize thoroughly before analysis
- Preserve samples at 4°C for immediate analysis; freeze at -20°C for future molecular work
Total Solids (TS) and Volatile Solids (VS) Determination:
- Weigh crucible (W_crucible)
- Add approximately 10g sample, record weight (W_wet)
- Dry at 105°C until constant weight (W_dry)
- Calculate TS: %TS = [(Wdry - Wcrucible)/(Wwet - Wcrucible)] × 100
- Incinerate at 550°C for 2 hours in muffle furnace (W_ash)
- Calculate VS: %VS = [(Wdry - Wash)/(Wdry - Wcrucible)] × 100
- Calculate VSR: %VSR = [(VSin - VSout)/(VSin - (VSin × VS_out))] × 100
pH and Alkalinity Measurement:
- Calibrate pH meter with standard buffers (pH 4, 7, 10)
- Measure sample pH directly
- For alkalinity: titrate 100mL sample with 0.1N H₂SO₄ to pH 4.5
- Calculate alkalinity as mg CaCO₃/L: Alk = (mL acid × N × 50,000)/sample volume (mL)
Volatile Fatty Acids Analysis:
- Option A: Titration method for total VFA
- Titrate sample with 0.1N NaOH to pH 7.0 for VFA estimation
- Option B: GC analysis for individual VFA
- Centrifuge sample at 10,000 × g for 10 minutes
- Acidify supernatant with formic acid
- Inject into GC-FID with appropriate standards
- Option A: Titration method for total VFA
Biogas Composition Analysis:
- Collect biogas in gas bags or directly sample headspace
- Analyze by GC-TCD with methanizer for CH₄, CO₂, H₂
- Use certified standard gases for calibration
Data Interpretation:
- Calculate VFA/TA ratio for process stability assessment
- Correlate VSR with biogas production and composition
- Monitor trends for early detection of process imbalance
Protocol 2: Microbial Community Analysis via ARISA and qPCR
This protocol details the assessment of active microbial populations through molecular techniques, providing insight into community structure and methanogenic potential.
Materials and Reagents:
- DNA extraction kit suitable for environmental samples
- PCR reagents: primers, dNTPs, polymerase, buffer
- ARISA primers: 1406F (5'-TGYACACACCGCCCGT-3') and 23SR (5'-GGGTTBCCCCATTCRG-3') for bacteria [95]
- mcrA gene primers: mlas (5'-GGTGGTGTMGGDTTCACMCARTA-3') and mcrA-rev (5'-CGTTCATBGCGTAGTTVGGRTAGT-3') for methanogens [95]
- Agarose gel electrophoresis equipment
- Capillary electrophoresis system for ARISA
- Real-time PCR system for qPCR
- Quantitative PCR reagents including SYBR Green
Procedure:
DNA Extraction:
- Concentrate biomass from 1-10mL digester sample by centrifugation
- Extract genomic DNA using commercial kit following manufacturer's instructions
- Assess DNA quality and quantity using spectrophotometry or fluorometry
- Store DNA at -20°C until analysis
Automated Ribosomal Intergenic Spacer Analysis (ARISA):
- Prepare PCR reaction mix:
- 1X PCR buffer
- 2.5 mM MgCl₂
- 200 µM each dNTP
- 0.2 µM each primer (1406F fluorescently labeled)
- 1.25 U DNA polymerase
- 10-50 ng template DNA
- PCR conditions:
- Initial denaturation: 95°C for 5 min
- 30 cycles: 95°C for 30s, 55°C for 30s, 72°C for 1 min
- Final extension: 72°C for 10 min
- Analyze PCR products by capillary electrophoresis
- Process data using appropriate software for fragment analysis
- Prepare PCR reaction mix:
mcrA Gene Quantification by qPCR:
- Prepare standards using serial dilutions of mcrA gene amplicons of known concentration
- Prepare qPCR reaction mix:
- 1X SYBR Green master mix
- 0.2 µM each mcrA primer
- 1 µL template DNA (diluted to 10-20 ng/µL)
- qPCR conditions:
- Initial denaturation: 95°C for 10 min
- 40 cycles: 95°C for 15s, 60°C for 30s, 72°C for 30s
- Melting curve analysis: 60-95°C with continuous fluorescence monitoring
- Calculate mcrA gene copy numbers from standard curve
- Normalize to sample volume or total DNA concentration
Data Analysis and Interpretation:
- Analyze ARISA profiles using multivariate statistics (PCA, PERMANOVA)
- Correlate community structure changes with process parameters
- Relate mcrA gene abundance to methane production rates
- Identify community shifts preceding process instability
Integrated Workflow for Digestion Efficiency Assessment
The relationship between conventional parameters and microbial community analysis in assessing digestion efficiency follows a logical workflow that integrates multiple data streams for comprehensive process understanding.
Integrated Assessment Workflow
This integrated workflow emphasizes the complementary nature of conventional and molecular analyses, with data integration providing a comprehensive understanding of digestion efficiency that would be incomplete with either approach alone.
Advanced Applications and Data Interpretation
Process Optimization and Troubleshooting
The integration of volatile solids reduction data with microbial community analysis enables sophisticated process optimization and troubleshooting approaches. For instance, low VSR coupled with high VFA/TA ratios and shifts in microbial community structure may indicate inhibition of methanogenic archaea. In such cases, mcrA gene quantification can confirm methanogen suppression, while ARISA profiles can reveal the extent of community disruption [95].
Specific Methanogenic Activity (SMA) testing provides a direct measure of methanogenic potential, with values around 0.58 g COD-CH₄/g TVS/day indicating efficient organic matter biodegradability [98]. SMA testing combined with community analysis is particularly valuable during start-up phases and when introducing new substrates, as it helps predict system stability and adaptation potential.
During process upsets such as ammonia inhibition, integrated monitoring can track the shift from acetoclastic to hydrogenotrophic methanogenesis. Under high ammonia conditions (>3 g/L NH₃-N), the methane production pathway shifts, with syntrophic acetate oxidation coupled with hydrogenotrophic methanogenesis becoming dominant [22]. This metabolic shift is reflected in both biogas composition (temporary reduction in methane content) and methanogen community structure (increase in hydrogenotrophic methanogens).
Microbial Community Dynamics and Process Stability
Long-term monitoring reveals that established microbial communities in anaerobic digesters demonstrate remarkable resilience to transient disturbances, although relative abundances may fluctuate in response to operational parameters [95]. This resilience forms the basis for process stability, with diverse microbial communities providing functional redundancy that maintains metabolic activities despite perturbations.
The start-up phase of anaerobic digesters is particularly critical, with evidence suggesting that microbial communities may become "founder determined" during initial establishment [95]. Comprehensive monitoring during this period, including both conventional parameters and microbial community dynamics, is essential for guiding operational strategies that establish stable, high-performance communities.
Advanced molecular techniques including metagenomics and metaproteomics offer deeper insights into the functional potential and expressed activities of microbial communities [22]. While these techniques are currently primarily research tools due to cost and complexity, they provide the foundation for developing targeted biomarkers for process monitoring and control.
The Scientist's Toolkit: Essential Research Reagents and Solutions
Table 3: Essential Research Reagents and Solutions for AD Efficiency Assessment
| Category | Item | Specification/Application | Notes |
|---|---|---|---|
| DNA Analysis | DNA extraction kit | Optimized for environmental samples with high humic substances | Critical for inhibitor-free DNA |
| ARISA primers | 1406F (5'-TGYACACACCGCCCGT-3') and 23SR (5'-GGGTTBCCCCATTCRG-3') | Bacterial community fingerprinting [95] | |
| mcrA primers | mlas and mcrA-rev | Methanogen quantification [95] | |
| Quantitative PCR reagents | SYBR Green or probe-based chemistry | mcrA gene quantification | |
| Process Monitoring | Alkalinity titration reagents | 0.1N H₂SO₄, pH indicator or meter | Critical stability parameter |
| VFA standards | Acetate, propionate, butyrate for calibration | GC analysis reference | |
| Biogas standards | Certified CH₄, CO₂, H₂ mixtures | GC calibration | |
| pH calibration buffers | pH 4, 7, 10 standards | Essential for accurate measurement | |
| Sample Processing | Homogenization equipment | Stomacher or similar | Representative sampling |
| Centrifuge tubes | 15-50mL, sterile | Sample processing | |
| Filtration apparatus | 0.22µm or 0.45µm membranes | Sample clarification |
Metabolic Pathways in Anaerobic Digestion
Understanding the complex metabolic interactions in anaerobic digestion is essential for interpreting efficiency parameters and microbial community data. The following diagram illustrates the key metabolic pathways and their relationship to standard monitoring parameters.
Metabolic Pathways and Monitoring
This pathway diagram illustrates the sequence of metabolic reactions in anaerobic digestion, highlighting key monitoring points and the alternative syntrophic acetate oxidation pathway that becomes dominant under high ammonia conditions [22]. Understanding these pathways is essential for interpreting process upsets and optimizing operational parameters to maintain digestion efficiency.
Comprehensive assessment of anaerobic digestion efficiency requires the integration of conventional physicochemical parameters with advanced microbial community analysis. Volatile solids reduction provides a fundamental measure of organic matter mineralization, while VFA/TA ratios and biogas composition offer real-time indicators of process stability. Molecular biological techniques, including ARISA fingerprinting and mcrA gene quantification, deliver unprecedented insight into the microbial communities responsible for process performance, enabling predictive monitoring and targeted optimization.
The protocols outlined in this application note provide researchers with standardized methodologies for holistic digestion efficiency assessment. By correlating microbial community dynamics with process parameters, these approaches facilitate deeper understanding of AD system performance, ultimately supporting more stable and efficient biogas production. As molecular techniques continue to advance and become more accessible, their integration with conventional monitoring will undoubtedly yield new biomarkers and control strategies for enhanced AD process management.
Kinetic modeling is an indispensable tool in anaerobic digestion (AD) research, providing a mathematical framework to predict biogas production, optimize process parameters, and understand the complex microbial interactions underlying waste-to-energy conversion. Anaerobic digestion is the microbial conversion of organic matter into biogas, primarily containing methane and carbon dioxide, and digestate [99]. The process sensitivity to substrate composition and operating conditions necessitates robust modeling approaches to prevent digester overloading and process failure [99]. The evolution of these models—from conventional kinetic formulations to modified Gompertz models and increasingly to data-driven machine learning (ML) approaches—represents a paradigm shift in how researchers simulate and optimize biogas production systems. This progression addresses critical challenges in AD management, including process instability, variable feedstock quality, and the need for predictive control strategies in both laboratory and industrial-scale applications.
The fundamental importance of kinetic modeling stems from its ability to correlate bacterial growth dynamics with biogas yield. During AD initiation, bacterial populations experience a lag phase for environmental adaptation, followed by exponential growth, stabilization, and eventual decline as nutrients deplete [100]. Since bacterial cell concentration directly correlates with biogas production, accurately modeling these growth phases enables researchers to estimate theoretical maximum biogas yields and optimize reactor operation [100]. For researchers and scientists investigating renewable energy alternatives, these models provide critical insights that bridge laboratory findings with full-scale implementation, supporting the transition toward sustainable waste management and energy production systems.
Established Kinetic Models in Biogas Research
Conventional Kinetic Models
Traditional kinetic models remain widely used in biogas research due to their relative simplicity and proven effectiveness across diverse substrates. These models employ mathematical equations to describe the relationship between substrate degradation, microbial growth, and methane production over time.
Table 1: Conventional Kinetic Models for Anaerobic Digestion
| Model Name | Key Equation Components | Primary Applications | Notable Advantages |
|---|---|---|---|
| First-Order Kinetic | Based on substrate degradation rate proportional to concentration remaining | Sewage sludge, agricultural waste [100] | Simple implementation; minimal parameters |
| Modified Gompertz | Sigmoidal function accounting for lag phase, maximum production rate, and potential | Food waste, algal biomass, DIET-enhanced systems [100] | Effectively models lag phase and methane potential |
| Chen & Hashimoto (CH) | Relates methane production to retention time and kinetic parameters | Lignocellulosic biomass (e.g., wheat husk) [100] | Superior accuracy for resistant substrates |
The Modified Gompertz model has been particularly widely applied, including for emerging AD processes based on direct interspecies electron transfer (DIET) [100]. This model effectively captures the sigmoidal nature of biogas accumulation, parameterizing the lag phase duration, maximum biogas production rate, and ultimate biogas yield. Meanwhile, the Chen & Hashimoto model has demonstrated remarkable predictive performance for challenging lignocellulosic substrates like wheat husk, achieving 40-67% lower root mean square error (RMSE) compared to first-order kinetic and modified Gompertz models in DIET-enhanced systems [100].
Anaerobic Digestion Model No. 1 (ADM1) and Its Evolution
The Anaerobic Digestion Model No. 1 (ADM1) represents the most comprehensive mechanistic framework developed by the International Water Association (IWA) [99]. Originally formulated for sewage sludge, ADM1 comprises 26 dynamic state concentration variables and 8 implicit algebraic variables per reactor vessel, encompassing complex biochemical and physico-chemical interactions [99] [100]. Despite its sophistication, ADM1 implementation faces practical challenges due to its extensive parameter calibration requirements and computational complexity [100].
Recent research has focused on adapting ADM1 for specific substrates like maize silage, the most common feedstock in agricultural biogas plants [99]. Modified versions (ADM1xp) now account for critical intermediates formed during ensiling—lactic acid, iso-valeric acid, and iso-butyric acid—not included in the original formulation [99]. Sensitivity analyses for maize silage indicate that disintegration (kdis) and carbohydrate hydrolysis (khyd_ch) constants most significantly influence biogas and methane production, highlighting their importance in model calibration [99]. When optimized using genetic algorithms, these enhanced models show substantially improved simulation accuracy, as reflected by increased Nash-Sutcliffe Efficiency (NSE) coefficients [99].
Advanced and Machine Learning Approaches
Integration of Machine Learning in Biogas Modeling
The integration of machine learning (ML) approaches represents a significant advancement in biogas production modeling, addressing limitations of conventional mechanistic models. ML algorithms excel at identifying complex, non-linear relationships in multi-parameter systems without requiring pre-defined mathematical structures. Long et al. applied random forests and neural networks to genomic and operational data from eight anaerobic digestion systems treating food waste and sewage sludge, achieving over 80% accuracy in predicting methane yield [99]. This highlights the potential of microbial sequencing data integration for AD optimization.
ML techniques are particularly valuable when dealing with heterogeneous feedstocks and dynamic operating conditions where traditional models struggle. Khan et al. demonstrated the effectiveness of ML in anaerobic co-digestion applications, while Ling et al. further validated these approaches [100]. Unlike mechanistic models, ML algorithms can continuously improve their predictive accuracy as additional operational data becomes available, making them particularly suitable for full-scale biogas plants with extensive monitoring systems. However, a significant limitation of purely data-driven ML approaches is their limited ability to integrate established physical relationships and empirical insights from phenomenological models [100].
Comparative Performance of Modeling Approaches
Recent research has conducted rigorous comparisons between conventional and machine learning approaches. In a comprehensive evaluation of DIET-enhanced anaerobic digestion of wheat husk, the Chen & Hashimoto model demonstrated superior predictive accuracy with 40-67% lower RMSE compared to first-order kinetic and modified Gompertz models [100]. This suggests that for certain substrate types, appropriately parameterized conventional models can compete with or even outperform more computationally intensive approaches.
Table 2: Model Performance Comparison for Different Substrates
| Substrate Type | Optimal Model | Performance Metrics | Reference Study |
|---|---|---|---|
| Maize silage | ADM1xp (modified) | Increased Nash-Sutcliffe Efficiency (NSE) after optimization | Bułkowska et al. [99] |
| Wheat husk (DIET-enhanced) | Chen & Hashimoto | 40-67% lower RMSE vs. other conventional models | Tiwari et al. [100] |
| Food waste & sewage sludge | Random Forest/Neural Networks | >80% accuracy in methane yield prediction | Long et al. [99] |
| Coffee pulp, cattle manure, food waste | Substrate-specific models (varied) | Optimal model varied by substrate composition | Karki et al. [99] |
The selection of an appropriate model depends heavily on the specific substrate characteristics, with research showing that optimal models vary significantly depending on feedstock composition [99]. For co-digestion of pretreated corn stover and chicken manure, Yu et al. reported a 6.5-24.7% improvement in methane yield due to synergistic effects, with the modified Gompertz model best capturing the production dynamics across different pretreatment scenarios [99].
Experimental Protocols and Methodologies
Protocol 1: Biochemical Methane Potential (BMP) Assays with Kinetic Analysis
Principle: Biochemical Methane Potential (BMP) tests determine the ultimate methane yield of organic substrates under controlled anaerobic conditions, providing essential data for kinetic model calibration.
Materials:
- Anaerobic inoculum (e.g., cow dung, anaerobic digester sludge)
- Test substrates (characterized for total solids, volatile solids, carbon content)
- Serum bottles (100mL to 500mL capacity) with butyl rubber stoppers and aluminum seals
- Anaerobic chamber or CO₂/N₂ gassing system
- Water bath or incubator for temperature control
- Gas chromatograph for methane quantification
- Pressure transducers or glass syringes for gas volume measurement
Procedure:
- Inoculum Preparation: Collect active anaerobic inoculum from a functioning digester. Remove large particles by filtration (2mm screen). Pre-incubate for 3-5 days to reduce background gas production.
- Substrate Characterization: Determine total solids (TS) and volatile solids (VS) content of all substrates. For maize silage, typical values are ~27.2% DM and 93.6% ODM [99].
- Bottle Preparation: Add inoculum and substrate to serum bottles at recommended substrate-to-inoculum ratios (typically 0.5-2.0 gVSsubstrate/gVSinoculum). Include controls with inoculum only to account for background methane production.
- Anaerobic Conditions: Flush headspace with nitrogen gas (N₂) to maintain anaerobic environment. Seal bottles with rubber stoppers and aluminum crimps.
- Incubation: Incubate bottles at mesophilic (35±2°C) or thermophilic (55±2°C) conditions with continuous mixing.
- Gas Monitoring: Measure daily biogas production using pressure-based methods or water displacement. Periodically sample headspace gas for methane content analysis via gas chromatography.
- Data Collection: Continue incubation until daily methane production falls below 1% of cumulative yield (typically 30-60 days).
- Kinetic Analysis: Fit experimental methane production data to kinetic models (Modified Gompertz, First-Order, Chen & Hashimoto) using nonlinear regression to determine kinetic parameters.
Quality Control:
- Perform assays in triplicate to ensure reproducibility
- Include reference substrates (microcrystalline cellulose) with known BMP values to validate methodology
- Monitor and maintain pH throughout incubation (optimal range: 6.8-7.8)
Protocol 2: Model Calibration and Validation Procedure
Principle: Systematic calibration and validation of kinetic models using experimental data to ensure predictive accuracy and prevent overfitting.
Materials:
- Experimental methane production data (time-series)
- Computational software (R, Python, MATLAB, or specialized ADM1 platforms)
- Parameter estimation algorithms (nonlinear regression, genetic algorithms)
Procedure:
- Data Partitioning: Divide experimental dataset into calibration (~70%) and validation (~30%) subsets, ensuring both sets represent the full experimental range.
- Parameter Initialization: Set realistic initial parameter estimates based on literature values or preliminary data analysis.
- Objective Function Definition: Select appropriate goodness-of-fit measure (e.g., sum of squared errors, root mean square error).
- Parameter Estimation: Use optimization algorithms to identify parameter values that minimize the difference between model predictions and experimental data.
- Sensitivity Analysis: Perform local or global sensitivity analysis to identify parameters with greatest influence on model outputs. For ADM1 applied to maize silage, focus particularly on disintegration (kdis) and carbohydrate hydrolysis (khyd_ch) constants [99].
- Model Validation: Test calibrated model against the validation dataset without further parameter adjustment.
- Performance Evaluation: Calculate statistical measures (R², RMSE, NSE) to quantify model accuracy and predictive capability.
- Uncertainty Analysis: Quantify parameter uncertainty using methods like bootstrap resampling or Monte Carlo analysis.
Quality Control:
- Document all parameter values and assumptions
- Verify that parameter estimates remain within physiologically plausible ranges
- Test model with external datasets to evaluate generalizability
The Scientist's Toolkit: Essential Research Reagents and Materials
Table 3: Essential Research Reagents and Materials for Kinetic Modeling Studies
| Item | Specification/Example | Research Application |
|---|---|---|
| Anaerobic Inoculum | Cow dung, anaerobic digester sludge, waste activated sludge | Source of microbial consortia for BMP assays [100] |
| Conductive Materials | Granular activated carbon (GAC), graphite biochar (GBC), magnetite | Enhancing DIET in anaerobic systems [100] |
| Substrate Characterization Kits | Total solids, volatile solids, chemical oxygen demand (COD) analysis | Feedstock characterization for model inputs [99] |
| Gas Analysis Standards | Certified CH₄/CO₂ gas mixtures for chromatography calibration | Quantitative biogas composition analysis [99] |
| Process Additives | Formic acid (ensiling preservative), macro/micronutrient supplements | Substrate preservation and nutrient balancing [99] |
| Modeling Software | R, Python (SciPy), MATLAB, Aquasim (ADM1 implementation) | Parameter estimation, sensitivity analysis, model simulation [100] |
Kinetic modeling of biogas production continues to evolve from empirical equations toward increasingly sophisticated hybrid approaches that integrate mechanistic understanding with data-driven machine learning. The modified Gompertz model remains widely applied for its effective representation of methane production kinetics, particularly in DIET-enhanced systems, while the Chen & Hashimoto model shows superior performance for lignocellulosic substrates like wheat husk [100]. Meanwhile, ADM1 modifications continue to improve its applicability to specific substrates such as maize silage by incorporating previously neglected intermediates [99].
The future of biogas modeling lies in the strategic integration of mechanistic and machine learning approaches, leveraging the strengths of both paradigms. While ML algorithms offer superior predictive accuracy with sufficient training data, conventional kinetic models provide interpretability and foundation in established biological principles. For researchers and scientists, selecting the appropriate modeling framework requires careful consideration of substrate characteristics, data availability, and project objectives. As the biogas industry continues to expand—projected to grow at 5.8% CAGR through 2029 [101]—advanced kinetic modeling will play an increasingly critical role in optimizing process efficiency, reducing carbon footprints, and maximizing renewable energy production from diverse organic waste streams.
Within the framework of advanced research into anaerobic digestion (AD) processes for biogas production, the selection and characterization of feedstocks are paramount. Agricultural residues, manure, and organic wastes represent abundant and renewable substrates for biogas production, yet their distinct biochemical characteristics lead to significant variations in process performance, microbial dynamics, and ultimate methane yield [102]. This application note provides a systematic, comparative analysis of these feedstock categories, supported by consolidated quantitative data and detailed experimental protocols. The objective is to equip researchers and scientists with standardized methodologies for evaluating feedstock performance, optimizing process parameters, and mitigating inhibition risks in both fundamental and applied biogas research.
Quantitative Performance Comparison of Feedstocks
The performance of a feedstock in anaerobic digestion is primarily governed by its composition, including carbon-to-nitrogen (C/N) ratio, lignin content, and biodegradability. The data in the tables below provide a consolidated summary of key performance metrics across different feedstock categories.
Table 1: Biochemical Methane Potential (BMP) and Key Characteristics of Common Feedstocks
| Feedstock Category | Specific Feedstock | Methane Yield (m³/kg VS) | Typical C/N Ratio | Key Characteristics & Notes |
|---|---|---|---|---|
| Agricultural Residues | Sugar Beet Leaves [103] | 0.31 - 0.42 | Variable | High seasonal variability; often left in fields, causing nitrogen leakage. |
| Potato Waste [103] | ~0.40 (4.1 kWh/kg TS) | Variable | High soluble carbohydrate content; can cause rapid acidification. | |
| Crop Residues (general) [104] | - | High (~50) | High lignin content; may require pre-treatment or co-digestion. | |
| Manure | Poultry Manure (PM) [105] | ~0.50 (58% CH₄) | Low | High nitrogen content, can lead to ammonia inhibition; high biodegradability. |
| Cattle Manure [106] | Low | - | High water and fiber content; results in low biogas yield but good buffering capacity. | |
| Organic Wastes | Food Waste (FW) [104] [105] | - | - | Easy to break down; fats, oils, and greases boost biogas yield. |
| Food Waste (100 tons/day) [104] | - | - | Can power 800-1,400 homes annually. |
Table 2: Process Performance and Operational Data from Full-Scale and Pilot Studies
| Parameter | Cattle Manure Mono-digestion [106] | Cattle + Poultry Manure Co-digestion [106] | Two-Stage AD of Potato & Beet Leaves [103] |
|---|---|---|---|
| Organic Loading Rate (OLR) | 3 to 5 kg VS/m³/day | 2.7 to 5 kg VS/m³/day | - |
| Temperature | Mesophilic (37-42°C) & Thermophilic (52°C) | Mesophilic (38°C) & Thermophilic (52°C) | Mesophilic |
| Methane Yield | Increased at thermophilic OLR | Slightly increased at thermophilic OLR, but inhibited | 0.30 - 0.42 m³/kg VS (co-digestion increased yield 60%) |
| Inhibition/Issues | - | Ammonia inhibition (0.4-0.7 g NH₃/l), fatty acid accumulation | Single-stage AD difficult; two-stage avoids pH drop |
| Residual Methane Potential (RMP) | Increased with higher OLR | Increased with higher OLR | - |
Experimental Protocols for Feedstock Evaluation
Protocol: Biochemical Methane Potential (BMP) Assay for Feedstock Screening
Principle: This batch assay determines the ultimate methane yield of a substrate under controlled, optimal conditions, providing a baseline for feedstock comparison [105].
Materials:
- Inoculum: Actively digesting sludge from a mesophilic anaerobic digester.
- Substrates: Representative samples of agricultural residues, manure, or organic waste.
- Serum bottles (e.g., 500 mL or 1 L) with butyl rubber stoppers and aluminum crimps.
- Anaerobic chamber or gassing station for N₂/CO₂.
- Water bath or incubator for temperature control.
- Gas chromatograph for methane quantification.
Procedure:
- Substrate Preparation: Pre-treat substrates if necessary (e.g., mechanical grinding for crop residues). Determine total solids (TS) and volatile solids (VS) content.
- Bottle Setup: In each serum bottle, add a known volume of inoculum and a VS amount of substrate at a recommended inoculum-to-substrate ratio (e.g., 2:1 on a VS basis). Include control bottles containing only inoculum to account for background gas production.
- Anaerobic Conditioning: Purge the headspace of each bottle with a mixture of N₂/CO₂ (e.g., 70:30) to establish anaerobic conditions. Seal bottles immediately.
- Incubation: Incubate bottles at a constant mesophilic temperature (e.g., 37±1°C) with continuous agitation for a period exceeding the expected degradation time (typically 30-50 days).
- Gas Monitoring: Periodically measure the volume and composition (methane and CO₂) of the accumulated biogas.
- Data Analysis: Calculate the net methane yield from the substrate by subtracting the average methane production of the control bottles from the substrate bottles. Express the final yield as NmL CH₄/g VSadded.
Protocol: Continuous Co-digestion of Poultry Manure and Food Waste
Principle: This protocol evaluates the synergistic effects and process stability of co-digesting nitrogen-rich manure and carbon-rich organic waste to optimize C/N ratio and methane yield [105] [106].
Materials:
- Continuous stirred-tank reactors (CSTRs).
- Feedstock: Poultry manure (PM) and food waste (FW), characterized for TS, VS, and elemental composition.
- Peristaltic pumps for continuous feeding.
- pH, temperature, and gas flow sensors.
Procedure:
- Feedstock Characterization: Analyze the C/N ratio of individual substrates. Determine the mixing ratio of PM and FW to achieve a balanced C/N ratio (e.g., 20-30).
- Reactor Start-up: Inoculate CSTRs with adapted anaerobic sludge. Begin operation at a low organic loading rate (OLR, e.g., 1-2 kg VS/m³/day) and a long hydraulic retention time (HRT, e.g., 30 days).
- Process Monitoring: Continuously monitor key parameters:
- Biogas: Daily production rate and methane content.
- Process Stability: Volatile fatty acids (VFA) concentration, alkalinity, and pH.
- Inhibition Indicators: Ammonia-nitrogen (NH₃-N) levels.
- OLR Increase: Once stable operation is confirmed (e.g., constant biogas yield, stable pH, low VFAs), gradually increase the OLR while monitoring for signs of inhibition, such as VFA accumulation or a drop in pH.
- Performance Evaluation: Compare the specific methane yield, volatile solids destruction, and process stability against mono-digestion controls.
Protocol: Two-Stage Anaerobic Digestion of Solid Agricultural Residues
Principle: This protocol outlines a two-stage process to separately optimize the hydrolysis/acidogenesis and methanogenesis phases, preventing process failure from rapid acidification of high-strength carbohydrate-based feedstocks [103].
Materials:
- Hydrolysis Stage: Batch reactor (e.g., 10 m³) equipped with a leachate recirculation system.
- Methanogenic Stage: Continuous, packed-bed reactor (e.g., 2.6 m³) with biofilm carriers (e.g., plastic or wheat straw).
- Heat exchangers for temperature control.
Procedure:
- Stage 1 - Hydrolysis/Acidogenesis: Load solid agricultural residues (e.g., potato waste, sugar beet leaves) into the hydrolysis reactor in batches. Continuously recirculate leachate to promote contact and hydrolysis. Maintain mesophilic temperature.
- Leachate Transfer: The VFA-rich leachate from the hydrolysis reactor is fed into the second-stage methanogenic reactor.
- Stage 2 - Methanogenesis: Operate the methanogenic reactor as a continuous system. The biofilm carriers retain methanogenic biomass, allowing for high-rate methane production from the VFAs in the leachate.
- System Optimization: Investigate the effect of different biofilm carriers and co-digestion of complementary substrates in the first stage to enhance the overall methane yield and process efficiency.
Visualization of Experimental Workflows and Pathways
Two-Stage Anaerobic Digestion Process
The following diagram illustrates the workflow for the two-stage anaerobic digestion of solid agricultural residues, separating the hydrolysis and methanogenesis phases to improve stability and yield [103].
Anaerobic Digestion Biochemical Pathway
This diagram outlines the core biochemical pathways in anaerobic digestion, showing the four stages from complex organic matter to methane and the key microbial groups involved [104].
The Scientist's Toolkit: Research Reagent Solutions
Table 3: Essential Reagents and Materials for Anaerobic Digestion Research
| Reagent/Material | Function/Application | Research Context |
|---|---|---|
| Inoculum (Anaerobic Sludge) | Source of a consortium of hydrolytic, acidogenic, acetogenic, and methanogenic microorganisms. | Essential for starting batch (BMP) and continuous reactors; sourced from operating digesters [106]. |
| Volatile Fatty Acids (VFA) Standards | Calibration standards for Gas Chromatography (GC) to quantify VFAs (e.g., acetate, propionate). | Critical for monitoring process stability; VFA accumulation indicates imbalance [106]. |
| Ammonia-Nitrogen Test Kits | Quantification of total ammoniacal nitrogen (TAN) and free ammonia (NH₃) in digestate. | Key for diagnosing inhibition in high-nitrogen feedstock digestion (e.g., poultry manure) [106]. |
| Biofilm Carriers | Inert materials (e.g., plastic, wheat straw) that provide surface area for microbial attachment. | Used in high-rate methanogenic reactors to increase biomass retention and process stability [103]. |
| Gas Chromatograph (GC) | Analytical instrument for precise quantification of biogas composition (CH₄, CO₂). | Standard for determining methane yield in BMP tests and continuous reactor performance [103]. |
The global energy landscape is undergoing a transformative shift toward renewable sources, and biogas has emerged as a strategically critical component of this transition. Biogas, produced through the anaerobic digestion of organic matter such as agricultural residues, municipal solid waste, and industrial by-products, offers a versatile and renewable energy solution [107] [7]. Unlike intermittent renewable sources like solar and wind, biogas provides dispatchable base load power, offering much-needed grid stability and flexibility [108]. Furthermore, it serves as a strategic fuel for decarbonizing hard-to-abate sectors such as heavy industry, long-haul transport, and heating, which electricity alone cannot easily reach [108].
This application note provides a detailed analysis of the global biogas market within the broader research context of anaerobic digestion processes. It is structured to offer researchers, scientists, and industry professionals a comprehensive overview of market projections, investment trends, and key operational protocols. The content synthesizes the latest market data, policy developments, and technical processes to serve as a foundational resource for strategic planning and research and development initiatives in the biogas sector.
The global biogas market is experiencing robust growth, driven by supportive government policies, technological advancements, and increasing emphasis on circular economy principles. The market was valued at USD 68.35 billion in 2024 and is projected to reach USD 97.35 billion by 2032, growing at a compound annual growth rate of 4.52% [107]. Alternative assessments provide a higher baseline estimate of USD 82.1 billion in 2024, expected to grow to USD 112.09 billion in 2029 at a CAGR of 6.3% [109]. This variance underscores the dynamic nature of the market and differences in methodological segmentation, but both sources confirm a strong and consistent upward trajectory.
Table 1: Global Biogas Market Size and Growth Projections
| Market Size (Year) | Value (USD Billion) | Forecast Period | CAGR | Source |
|---|---|---|---|---|
| 2024 Base | 68.35 | 2025-2032 | 4.52% | Maximize Market Research [107] |
| 2032 Projection | 97.35 | |||
| 2024 Base | 82.10 | 2025-2029 | 6.3% | The Business Research Company [109] |
| 2029 Projection | 112.09 |
A striking finding from recent analyses is the vast untapped potential of biogas production. The International Energy Agency estimates that nearly 1 trillion cubic metres of natural gas equivalent of biogases could be produced sustainably each year using today's organic waste streams—an amount equivalent to one-quarter of the current global natural gas demand [110]. Despite this potential, only about 5% of the total sustainable capacity is currently being utilized, indicating significant room for expansion and investment, particularly in emerging economies [110].
Regional Market Dynamics
The biogas market exhibits distinct regional characteristics influenced by policy frameworks, resource availability, and infrastructure development.
Table 2: Regional Biogas Market Analysis and Forecasts
| Region | Market Share (2024) | Key Growth Drivers | Notable Policies & Targets |
|---|---|---|---|
| Europe | 38.88% [107] to 65.88% [111] | Strong policy support, REPowerEU plan, established gas grid | EU 35 bcm biomethane target by 2030 [108] [111] |
| Asia-Pacific | Fastest Growing Region [107] | Energy demand, waste management, rural development | India's 5,000 CBG plant target [63] [111]; China's rural revitalization [111] |
| North America | Significant Growth [108] | Federal/state incentives, RNG for transport, LCFS credits | U.S. RFS program; California's LCFS [63] [111] |
| South America | 10% CAGR [111] | Ambitious blending mandates, abundant feedstock | Brazil's biogas potential of 102 bcm [108] |
Europe dominates the global market, with Germany alone hosting two-thirds of Europe's biogas plant capacity [107]. The region's leadership is reinforced by the REPowerEU plan, which targets 35 billion cubic meters of biomethane production by 2030 [111]. Meanwhile, the Asia-Pacific region demonstrates the most rapid growth, fueled by increasing energy demand, supportive government policies, and significant biogas potential in major economies like China and India [107]. India, for instance, has launched an ambitious program to establish 5,000 new compressed biogas plants over the next five years [63] [111].
North America represents a market at an inflection point. In 2024, the United States saw agricultural biogas projects exceed landfill gas production for the first time, with over 2,500 sites generating 1.4 million standard cubic feet per minute [111]. Investment surged by 40% year-on-year in 2024 to USD 3 billion, highlighting strong market confidence [111]. South America, particularly Brazil and Argentina, is also emerging as a significant growth market, with Brazil possessing a biogas potential of 102 billion cubic meters [108].
The Anaerobic Digestion Process: Scientific Principles
Anaerobic digestion is a complex biological process where microorganisms break down biodegradable material in the absence of oxygen [7]. This process occurs naturally in environments such as water-logged soils, deep water bodies, and the digestive systems of mammals [18]. In engineered systems, this natural process is optimized to treat organic wastes while producing valuable biogas and digestate.
Microbial Processes and Biochemical Pathways
The anaerobic digestion process occurs through four interdependent microbial stages, each facilitated by distinct consortia of microorganisms.
Hydrolysis is the initial stage where complex organic polymers—carbohydrates, proteins, and fats—are broken down into simpler monomers such as sugars, amino acids, and fatty acids by hydrolytic bacteria [18]. This solubilization process is often the rate-limiting step in the overall digestion of solid substrates.
Acidogenesis follows, where acidogenic bacteria ferment these simple monomers into short-chain volatile fatty acids (e.g., propionic, butyric acid), alcohols, ketones, hydrogen, and carbon dioxide [18].
Acetogenesis constitutes the third stage, where acetogenic bacteria convert the products of acidogenesis into acetic acid, hydrogen, and carbon dioxide, which are the direct precursors for methane formation [18].
Methanogenesis is the final stage where methanogenic archaea produce methane through two primary pathways: acetoclastic methanogenesis (splitting acetate into methane and carbon dioxide) and hydrogenotrophic methanogenesis (combining hydrogen with carbon dioxide to form methane) [18]. Methanogens are obligate anaerobes, highly sensitive to environmental conditions such as pH and temperature [18].
Operational Parameters and Process Optimization
Successful anaerobic digestion requires careful control of operational parameters to maintain the dynamic equilibrium between the different microbial consortia.
Table 3: Critical Parameters for Anaerobic Digestion Process Optimization
| Parameter | Optimal Range/Type | Impact on Process | Corrective Measures |
|---|---|---|---|
| Temperature | Mesophilic (77-95°F); Thermophilic (122-140°F) [18] | Different microbial communities; thermophilic has faster rates but more sensitive [18] | Insulation, heating systems; avoid 104-122°F inhibition zone [18] |
| pH | 6.8 - 7.2 [18] | Methanogens are sensitive to low pH; acid accumulation inhibits process [18] | Sodium bicarbonate addition; co-digestion with high-buffering materials [18] |
| Carbon/Nitrogen Ratio | 20:1 to 30:1 [18] | High N causes ammonia inhibition; high C slows digestion [18] | Blend feedstocks (e.g., manure with crop residues) [18] |
| Retention Time | Varies by temperature and system [18] | Determines treatment efficiency and biogas yield [18] | Larger vessels for mesophilic; smaller for thermophilic [18] |
| Solid Content | 7% - 13% [18] | Affects mixability and microbial access to substrates [18] | Water addition for dry feedstocks; solid separation for wet ones [18] |
Temperature control is crucial as it directly influences microbial activity rates. Most commercial digesters operate in either the mesophilic range (77-95°F), which offers greater process stability, or the thermophilic range (122-140°F), which provides faster digestion rates and better pathogen reduction but requires more careful management [18].
pH and alkalinity must be maintained within a narrow range (6.8-7.2) optimal for methanogens [18]. The system naturally produces alkalinity, but the introduction of easily acidifiable substrates may require buffering through co-digestion with materials like dairy manure or the addition of alkaline chemicals [18].
The carbon-to-nitrogen ratio of the feedstock mixture significantly impacts process stability. A ratio between 20:1 and 30:1 is considered optimal [18]. High-nitrogen feedstocks like manure can be balanced with high-carbon materials such as crop residues or organic fractions of municipal solid waste.
Experimental Protocol: Laboratory-Scale Anaerobic Digestion
This section provides a detailed methodology for establishing and operating a laboratory-scale anaerobic digestion system to evaluate biogas production potential from various organic substrates.
Research Reagent Solutions and Materials
Table 4: Essential Research Reagents and Materials for Anaerobic Digestion Studies
| Item | Specification/Type | Function/Application |
|---|---|---|
| Anaerobic Digester Vessels | Glass reactors (0.5-5L working volume), gas-tight seals | Provide oxygen-free environment for digestion process |
| Inoculum | Adapted anaerobic sludge from operating digesters | Source of microbial consortium for starting digestion |
| Feedstock Substrates | Characterized organic wastes (manure, food waste, energy crops) | Carbon and nutrient source for microbial growth and biogas production |
| Gas Collection System | Gas bags, water displacement apparatus, flow meters | Quantify and characterize biogas volume and production rate |
| pH Adjustment Solutions | Sodium bicarbonate, hydrochloric acid (1M) | Maintain optimal pH range for methanogenesis (6.8-7.2) |
| Trace Element Solution | Standard solution containing Fe, Ni, Co, Mo, Se | Provide essential micronutrients for microbial growth |
| Resazurin Indicator | 0.1% aqueous solution | Redox indicator to confirm anaerobic conditions |
| Gas Chromatograph | With TCD and FID detectors, packed columns | Analyze biogas composition (CH₄, CO₂, H₂S) |
Procedure: BMP Assay and Process Monitoring
Part A: Reactor Setup and Inoculation
- Prepare substrate by reducing particle size to <2mm to enhance bioavailability and mixing.
- Characterize the substrate by determining total solids (TS), volatile solids (VS), chemical oxygen demand (COD), and elemental composition.
- Load reactors with inoculum and substrate at a recommended inoculum-to-substrate ratio (ISR) of 2:1 on a VS basis.
- Add trace element solution (1 mL/L) to ensure micronutrient availability.
- Flush headspace with nitrogen gas for 5 minutes to establish anaerobic conditions.
- Seal reactors and place in temperature-controlled environment (±1°C stability).
Part B: Operation and Monitoring
- Mix contents manually twice daily or use continuous mechanical mixing.
- Monitor biogas production daily using water displacement or automated gas meters.
- Sample biogas periodically for composition analysis using gas chromatography.
- Measure pH daily and adjust with sodium bicarbonate or dilute acid if needed to maintain 6.8-7.2.
- Record temperature continuously to ensure stable operational conditions.
Part C: Data Analysis and Interpretation
- Calculate cumulative biogas and methane yield normalized to VS added.
- Determine kinetic parameters using mathematical models (e.g., first-order, Gompertz).
- Analyze process stability through monitoring of intermediate products (VFAs) and pH.
- Compare methane potential across different substrates and conditions.
Key Market Segments and Application Areas
The biogas market is segmented by feedstock type, application, and process technology, each with distinct characteristics and growth trajectories.
Feedstock Analysis
Agricultural waste dominates the feedstock segment, holding approximately 76.23% of the market share in 2024 [107]. This segment includes crop residues, animal manure, and agricultural by-products, which offer a consistent and reliable source of organic material for digestion [107]. The energy content of agricultural waste makes it particularly valuable for biogas production, enabling renewable energy generation while reducing reliance on fossil fuels [107].
Municipal solid waste represents another significant feedstock segment, with growth driven by landfill diversion policies and circular economy initiatives. The European Union's mandate for separate organic waste collection by 2025 is creating stable feedstock channels and tipping-fee revenues that boost project economics [111]. Food waste specifically demonstrates high biogas yields, with studies showing production of 827 L biogas/kg volatile solids when carbon-to-nitrogen ratios are maintained between 20-25 [111].
Industrial waste from food processing, breweries, and dairy operations also constitutes an important feedstock category. These wastes often have high organic content and biodegradability, making them excellent candidates for co-digestion with other substrates to enhance biogas production and process stability [107].
Application Segments
The application landscape for biogas is diversifying, with several key segments emerging:
Electricity Generation: This segment accounted for approximately 65.12% of the market share in 2024 [107]. Biogas is used in combined heat and power systems that can achieve over 80% overall efficiency in European district energy systems [111]. In the U.S., approximately 220 million kWh of electricity was generated using biogas from livestock operations in 2022, while industrial and sewage wastewater treatment facilities produced about 1 billion kWh [107].
Renewable Natural Gas: The RNG segment is experiencing rapid growth with a CAGR of 9% projected through 2030 [111]. This growth is driven by transport fuel premiums that outstrip wholesale power prices [111]. In 2024, over 95% of new U.S. project announcements targeted RNG production [111]. When upgraded to biomethane, this fuel can be injected into existing natural gas infrastructure or used as vehicle fuel [63] [7].
Transportation Fuel: Biogas is increasingly used as a biofuel in transportation, particularly for heavy-duty vehicles where it matches diesel range without the payload penalty of batteries [111]. The IEA expects global biofuel demand to expand by 38 billion litres over 2023-2028, a nearly 30% increase from the previous five-year period [63].
Heat Generation: Direct use of biogas for thermal applications remains an important market, particularly in industrial settings and district heating systems.
Investment Landscape and Competitive Analysis
The biogas sector has attracted significant investment from both public and private sources, driving substantial market expansion and technological innovation.
Investment Trends and Project Economics
Capital investment in biogas infrastructure has grown dramatically, with the U.S. market alone attracting $39 billion in capital investment across 2,251 active projects [107]. The year 2024 saw $3 billion invested in new U.S. biogas systems, representing 40% growth over the previous year [111]. This investment surge reflects strong confidence in the sector's growth potential and profitability.
Project economics vary significantly based on scale, feedstock, and end-use application. The high capital expenditure requirements remain a challenge, with installed costs typically ranging from USD 3,000-5,000/kW, substantially higher than utility-scale solar projects [111]. This necessitates higher equity requirements, with lenders typically demanding 15-20% equity due to feedstock volatility and operational complexity [111].
Government support mechanisms are crucial for improving project economics. Production-based tax credits, renewable energy mandates, and carbon pricing systems have significantly improved the financial viability of biogas projects. With a carbon price of USD 50 per tonne of CO₂, 280 billion cubic metres of biomethane could compete with natural gas on a global scale [110]. This increases to 400 billion cubic metres at USD 70 per tonne, making biomethane increasingly competitive with fossil alternatives [110].
Key Players and Strategic Developments
The biogas market remains relatively fragmented, with the top five developers holding less than 25% combined output [111]. This fragmentation creates opportunities for regional specialists and technology-focused companies.
Table 5: Key Players and Recent Strategic Developments in the Biogas Market
| Company | Regional Focus | Core Competence | Recent Strategic Developments |
|---|---|---|---|
| EnviTec Biogas | Europe, North America | Vertical integration: design, build, own, operate | Self-funded EUR 100 million to add 300 GWh capacity [111] |
| TotalEnergies | Global | Oil major diversifying into renewable energy | Joint venture with Vanguard Renewables targeting 5 TWh of RNG by 2030 [111] |
| Scandinavian Biogas | Europe, Asia | Bio-LNG production for transport | EUR 90 million investment for 240 GWh capacity in Germany [111] |
| Engie SA | Global | Energy transition and renewable gas | Developing multiple biomethane projects across Europe |
| Air Liquide | Global | Gas technology and cleantech | Biogas upgrading and purification technologies |
| Reliance Industries | India | Diversified conglomerate | Committed USD 7.8 billion for 500 CBG plants in India [111] |
The competitive landscape is increasingly defined by strategic partnerships and acquisitions that combine complementary capabilities. Major energy companies are creating dedicated biomethane business units, highlighting the sector's strategic importance in the energy transition [112]. Technology differentiation is also sharpening, with companies focusing on innovations such as containerized upgrading systems, nutrient recovery technologies, and biological methanation processes that convert residual CO₂ into additional methane [111].
Future Outlook and Research Directions
The global biogas market is poised for substantial growth over the coming decade, supported by strong policy tailwinds, technological advancements, and increasing focus on circular economy principles.
Emerging Trends and Growth Opportunities
Several key trends are shaping the future development of the biogas sector:
Biomethane Production Expansion: Global biomethane production reached 9.25 bcm in 2023 and is forecast to approach 12 bcm in 2024 [112]. The European Union is particularly active, with France expected to surpass Germany as the top biomethane producer worldwide in 2025 [63].
Technological Advancements: Innovation in biogas upgrading technologies is driving significant efficiency improvements, with recent advancements boosting biomethane yield by 25-190% [63]. The global market for biogas upgrading equipment is projected to grow from USD 1.4 billion in 2022 to USD 3.8 billion by 2027, a compound annual growth rate of 21.1% [63].
Grid Integration and Stability: Biogas is increasingly valued for its ability to provide grid stability and flexibility in systems with high penetration of variable renewables like solar and wind [108] [111]. Utilities now view biogas as a firming resource that can fill evening demand gaps when solar output declines [111].
Carbon Capture and Utilization: The integration of carbon capture technologies with biogas plants is emerging as a value-creation opportunity, allowing projects to qualify for additional tax credits while reducing their carbon footprint [111].
Research Priorities and Development Needs
Future research should focus on addressing key technical and operational challenges:
Process Efficiency Improvements: Enhancing biogas yields through advanced reactor designs, microbial community management, and optimized feedstock formulations.
Digestate Valorization: Developing higher-value applications for digestate, including nutrient recovery, biofertilizer formulations, and bio-based product manufacturing [110].
Fugitive Emissions Reduction: Implementing improved monitoring and control technologies to address methane leakage, which can range from 0.1-2.4% during feedstock handling and 0-12% during biogas production [110].
Digitalization and Automation: Deploying advanced sensors, process controls, and data analytics to optimize plant performance and reduce operational costs.
Standardization and Certification: Developing international standards for biogas quality, sustainability certification, and emissions accounting to facilitate market growth and cross-border trade [110].
The potential for biogas to contribute to global energy transition and climate goals remains substantial. With only 5% of the sustainable potential currently utilized, the sector offers significant opportunities for continued expansion, particularly in emerging economies where utilization rates remain low [110]. Realizing this potential will require concerted efforts from policymakers, industry participants, and researchers to address existing barriers and accelerate deployment.
Anaerobic Digestion (AD) for biogas production represents a key technology at the nexus of waste management, renewable energy generation, and agricultural sustainability. While the core process of microbial decomposition of organic matter is well-understood, its widespread deployment is heavily influenced by the external framework of policy and incentives. This application note examines the critical impact of Renewable Energy Directives, particularly the European Union's Revised Renewable Energy Directive (RED III), on the development, direction, and economics of the AD sector. Aimed at researchers and scientists, this document provides structured data and methodologies to quantitatively assess policy impacts, essential for informing future project development and strategic research in biogas production.
Policy Framework and Quantitative Targets
The EU Renewable Energy Directive has established a progressively ambitious regulatory landscape. The 2023 revision (RED III) sets a binding Union-level target of a 42.5% share of renewable energy in the overall energy mix by 2030, with an aspirational goal of reaching 45% [113]. This overarching directive is a primary driver for biomethane production, with REPowerEU outlining a specific target of 35 billion cubic meters (bcm) of annual domestic biomethane production by 2030 [114]. These targets create a top-down demand for technologies like AD.
Beyond the EU, national policies create diverse markets. In the United States, growth is largely driven by state-level mandates, with 17 jurisdictions having 100% clean energy mandates for utilities [115]. The American Biogas Council (ABC) reports a significant market shift, with over 90% of new systems constructed now designed to produce Renewable Natural Gas (RNG) instead of electricity, a direct response to favorable market conditions [116].
Table 1: Key Quantitative Targets and Market Shifts Influencing AD Deployment
| Policy / Market Driver | Region | Key Target / Metric | Impact on AD Sector |
|---|---|---|---|
| RED III (2030 Target) [113] | European Union | At least 42.5% renewable energy share | Creates binding demand for all renewables, including biogas/biomethane. |
| REPowerEU Biomethane Target [114] | European Union | 35 bcm annual production by 2030 | Directly stimulates investment in AD facilities for gas grid injection. |
| State-Level Clean Energy Mandates [115] | United States | 17 states with 100% clean energy goals | Drives utility procurement of renewable electricity and RNG. |
| Market Shift to RNG [116] | United States | >90% of new AD systems are for RNG | Redirects research & investment towards gas upgrading technologies. |
| U.S. Total Potential [116] | United States | 17,000+ new potential biogas systems | Highlights vast untapped feedstock capacity for future research. |
Experimental Protocols for Policy Impact Analysis
For researchers evaluating the efficacy of policies on AD deployment, a structured, data-driven methodology is essential. The following protocols outline standardized approaches.
Protocol: Tracking End-Use Market Shifts
Objective: To quantitatively analyze how policy incentives alter the primary output (e.g., RNG vs. Electricity) of anaerobic digestion systems. Background: Policy frameworks often favor one energy product over another. Monitoring this shift is crucial for technology development and infrastructure investment [116] [117].
Data Collection: Compile a national or regional database of operational AD facilities. Key data points for each facility must include:
- Commissioning year.
- Primary feedstock(s) (e.g., manure, food waste, wastewater).
- Primary end-use of biogas (e.g., Electricity/CHP, RNG, Heat).
- Production capacity (e.g., cubic meters of biogas/year, MWe).
Data Aggregation & Temporal Analysis: Aggregate data by commissioning year and primary end-use. Calculate the following metrics for each year over a defined period (e.g., 2019-2024):
- Percentage of new facilities dedicated to RNG production.
- Percentage of new facilities dedicated to electricity/CHP.
- Total volume of biogas directed to each end-use category.
Correlation with Policy Timelines: Superimpose the aggregated data with a timeline of relevant policy introductions, amendments, or expirations. This visual correlation can reveal direct cause-and-effect relationships, such as an increase in RNG projects following the introduction of a fuel credit or a renewable gas mandate [116].
Protocol: Assessing Manure-Based AD Potential
Objective: To evaluate the untapped potential and identify barriers for manure-based anaerobic digestion, a key feedstock with significant environmental co-benefits [118]. Background: Manure is a widely available feedstock whose utilization in AD is low due to economic and logistical hurdles. Specific policies are often needed to unlock its potential.
Feedstock Inventory: Using national agricultural census data, estimate the total annual volume of manure production in the region of interest. Differentiate by livestock type (e.g., dairy, swine, poultry).
Potential Calculation: Apply standardized methane yield coefficients (e.g., m³ CH₄ per ton of volatile solids) for each manure type to calculate the total theoretical biogas and biomethane potential.
Barrier Identification: Conduct a gap analysis through stakeholder surveys and interviews with farmers, AD developers, and financiers. Key barriers to quantify include:
- Economic: High capital/operating costs versus energy revenues.
- Logistical: Costs associated with feedstock collection from dispersed farms.
- Technical: Need for co-digestion with other substrates to improve methane yield.
- Regulatory: Complexity and length of permitting processes.
Policy Recommendation Formulation: Based on the identified barriers, model the impact of specific policy interventions (e.g., capital grants, operating incentives, streamlined permitting) on the project's internal rate of return (IRR) to determine the most effective levers for mobilization [118].
Research Reagent Solutions & Key Materials
The following table details essential materials and technological solutions referenced in policy-driven AD research, particularly concerning system efficiency and monitoring.
Table 2: Key Research Reagent Solutions for Advanced AD Research
| Item / Technology | Function / Application in AD Research | Relevance to Policy Goals |
|---|---|---|
| Microbial Community DNA Sequencing Kits | Enables detailed monitoring of microbial consortia responsible for hydrolysis, acetogenesis, and methanogenesis within the digester. | Supports research into process optimization and stability, directly feeding into the policy goal of reducing costs and improving efficiency [119]. |
| Pilot-Scale UASB/EGSB/IC Reactors | Bench-scale models of different digester configurations for testing feedstock suitability, organic loading rates, and biogas yield. | Essential for validating the use of diverse, non-competitive feedstocks (e.g., agricultural residues) as promoted by policies [120]. |
| Corrugated Tube Heat Exchangers | Provides efficient digester heating compared to traditional internal coils, maximizing energy efficiency. | Addresses the policy and economic drive for operational efficiency and cost reduction in plant operation [121]. |
| Biogas Dehumidification & Desulfurization Systems | Removes water vapor and hydrogen sulfide (H₂S) from raw biogas, preventing corrosion and enabling downstream use. | A critical step for both electricity generation and RNG production, impacting gas quality and equipment longevity [121]. |
| Digestate Pasteurization & Concentration Systems | Treats and valorizes the nutrient-rich digestate, creating a safe, transportable biofertilizer. | Captures the circular economy benefits of AD, turning a waste stream into a product, which is a key non-energy policy driver [118] [121]. |
Visualizing the Policy-to-Outcome Workflow
The logical pathway from policy implementation to research and deployment outcomes involves multiple feedback loops. The diagram below maps this complex relationship.
Policy Impact on AD Workflow: This diagram illustrates the logical flow from policy implementation to research focus and eventual sector outcomes.
Renewable Energy Directives and associated incentives are not merely background factors but are active determinants of the AD research agenda and commercial landscape. The current policy environment, characterized by ambitious binding targets and a clear preference for high-value energy carriers like biomethane, demands a focused research response. This includes optimizing AD systems for a wider range of feedstocks, improving the economic and environmental sustainability of the entire process chain, and developing robust methodologies to quantify the non-energy benefits, such as nutrient recycling. For researchers and scientists, integrating policy analysis into technical R&D is no longer optional but essential for ensuring that innovations in anaerobic digestion are relevant, deployable, and impactful in achieving global climate and sustainability goals.
Conclusion
The anaerobic digestion process stands as a robust and versatile biotechnology for renewable energy generation and organic waste management. A deep understanding of the foundational microbiology is paramount for manipulating and optimizing the process. Methodological advancements in co-digestion and pretreatment significantly enhance biogas yields, while effective troubleshooting ensures long-term operational stability. Validation through advanced microbial ecology and modeling provides a data-driven pathway for performance prediction and scale-up. For researchers, the future of AD lies in further unraveling microbial community dynamics to engineer more resilient consortia, integrating AD with other waste-to-energy platforms, and developing advanced control systems using AI and machine learning. With strong policy support and growing market investments, AD is poised to make a substantial contribution to achieving global net-zero emissions targets and fostering a sustainable circular bioeconomy.
References
- 1. Anaerobic digestion [https://en.wikipedia.org/wiki/Anaerobic_digestion]
- 2. Microbial Community and Metabolic Pathways in ... [https://www.mdpi.com/2311-5637/11/8/457]
- 3. Anaerobic Digestion - an overview [https://www.sciencedirect.com/topics/biochemistry-genetics-and-molecular-biology/anaerobic-digestion]
- 4. A review on strategies to optimize metabolic stages of ... [https://sustainenvironres.biomedcentral.com/articles/10.1186/s42834-019-0037-0]
- 5. An overview of physico-chemical mechanisms of biogas ... [https://pmc.ncbi.nlm.nih.gov/articles/PMC4755961/]
- 6. 11.1 Anaerobic Digestion | EGEE 439 [https://courses.ems.psu.edu/egee439/node/727]
- 7. How Does Anaerobic Digestion Work? [https://www.epa.gov/agstar/how-does-anaerobic-digestion-work]
- 8. High variations of methanogenic microorganisms drive full- ... [https://www.sciencedirect.com/science/article/pii/S0160412018323948]
- 9. Microbial Consortiums of Hydrogenotrophic Methanogenic ... [https://www.mdpi.com/2076-2607/8/5/772]
- 10. Microbial consortia in salt marsh sediments are ... [https://elifesciences.org/reviewed-preprints/108843]
- 11. Identification and implications of a core bacterial microbiome ... [https://pmc.ncbi.nlm.nih.gov/articles/PMC9416233/]
- 12. Enriched microbial consortia from natural environments reveal ... [https://journals.plos.org/plosone/article?id=10.1371/journal.pone.0315432]
- 13. Methanogenesis associated with altered microbial ... [https://pmc.ncbi.nlm.nih.gov/articles/PMC12156016/]
- 14. In anaerobic reactors the microbial community structure ... [https://www.frontiersin.org/journals/microbiology/articles/10.3389/fmicb.2025.1583463/full]
- 15. Effect of a Profound Feedstock Change on the Structure ... [https://pmc.ncbi.nlm.nih.gov/articles/PMC7074709/]
- 16. Anaerobic digestion of whey permeate: Impact of feedstock ... [https://pmc.ncbi.nlm.nih.gov/articles/PMC11891718/]
- 17. The Advantage of Citrus Residues as Feedstock for Biogas ... [https://www.mdpi.com/1996-1073/17/6/1315]
- 18. Anaerobic Digestion: Basic Processes for Biogas (FS-994) [https://extension.umd.edu/resource/anaerobic-digestion-basic-processes-biogas-fs-994]
- 19. Performance of mesophilic and thermophilic anaerobic ... [https://www.sciencedirect.com/science/article/abs/pii/S0960148124021621]
- 20. Changes in Reactor Performance and Microbiome [https://pmc.ncbi.nlm.nih.gov/articles/PMC12495138/]
- 21. Thermophilic-mesophilic temperature phase anaerobic co ... [https://www.nature.com/articles/s41598-024-62998-w]
- 22. Molecular Microbial Community Analysis as an ... [https://pmc.ncbi.nlm.nih.gov/articles/PMC8226781/]
- 23. Synergistic Promotion of Direct Interspecies Electron ... [https://www.mdpi.com/2311-5637/10/12/656]
- 24. Direct interspecies electron transfer mechanisms of a biochar ... [https://biotechnologyforbiofuels.biomedcentral.com/articles/10.1186/s13068-023-02391-3]
- 25. Enhancement of direct interspecies electron transfer and ... [https://pmc.ncbi.nlm.nih.gov/articles/PMC12392111/]
- 26. Bioenergetically constrained dynamical microbial ... [https://www.nature.com/articles/s41522-025-00668-z]
- 27. Biogas enhancement in the anaerobic digestion of thermo ... [https://www.frontiersin.org/journals/chemical-engineering/articles/10.3389/fceng.2024.1419770/full]
- 28. Alternating polarity as a novel strategy for building ... [https://www.sciencedirect.com/science/article/abs/pii/S0960852424000774]
- 29. Mechanisms of extracellular electron transfer in anaerobic ... [https://www.nature.com/articles/s41467-024-45758-2]
- 30. Anaerobic digestion via direct interspecies electron transfer [https://link.springer.com/article/10.1007/s10163-025-02397-z]
- 31. A Review of Pretreatment Strategies for Anaerobic Digestion [https://www.mdpi.com/2813-0391/3/3/24]
- 32. Methane yield response to pretreatment is dependent on ... [https://www.nature.com/articles/s41598-024-51603-9]
- 33. Pretreatment and anaerobic co-digestion of lignocellulosic ... [https://ui.adsabs.harvard.edu/abs/2025BiTeR..3002133S/abstract]
- 34. Bio-physical pre-treatments in anaerobic digestion of ... [https://www.sciencedirect.com/science/article/pii/S0956053X24004586]
- 35. A comparative analysis of pre-treatment technologies for ... [https://www.sciencedirect.com/science/article/pii/S0926669024005685]
- 36. The effects of different pretreatment technologies on ... [https://pmc.ncbi.nlm.nih.gov/articles/PMC11499478/]
- 37. A Comprehensive Approach to Nanotechnology Innovations ... [https://pmc.ncbi.nlm.nih.gov/articles/PMC12388454/]
- 38. Long-Term Continuous Anaerobic Co-digestion of Residual Biomass—Model Validation and Model-Based Investigation of Different Carbon-to-Nitrogen Ratios | BioEnergy Research [https://link.springer.com/article/10.1007/s12155-025-10858-4]
- 39. Synergistic effects of anaerobic digestion for diverse ... [https://www.sciencedirect.com/science/article/abs/pii/S097308262500105X]
- 40. Exploring feedstock proportions in anaerobic co-digestion ... [https://www.sciencedirect.com/science/article/pii/S096085242501658X]
- 41. Effects of waste sources on performance of anaerobic co-digestion of complex organic wastes: taking food waste as an example | Scientific Reports [https://www.nature.com/articles/s41598-017-16068-z]
- 42. Enhancing methane yield and microbial resilience in olive pomace anaerobic digestion via co-digestion with pig manure | Biotechnology for Biofuels and Bioproducts | Full Text [https://biotechnologyforbiofuels.biomedcentral.com/articles/10.1186/s13068-025-02711-9]
- 43. Impact of C/N ratios and organic loading rates of paper, cardboard and tissue wastes in batch and CSTR anaerobic digestion with food waste on their biogas production and digester stability | Discover Applied Sciences [https://link.springer.com/article/10.1007/s42452-020-03232-w]
- 44. Sustainable biogas production through anaerobic co ... [https://pubs.rsc.org/en/content/articlelanding/2025/su/d5su00298b]
- 45. Factors affecting methane production and system recovery ... [https://pubmed.ncbi.nlm.nih.gov/40910151/]
- 46. Enhancing Methane Production in Anaerobic Digestion of ... [https://www.mdpi.com/1420-3049/30/8/1766]
- 47. Enhanced Biogas Production via Anaerobic Co-Digestion ... [https://arxiv.org/abs/2505.04635]
- 48. Mass Transfer Enhancement in High-Solids Anaerobic ... [https://pmc.ncbi.nlm.nih.gov/articles/PMC10525600/]
- 49. High Solids Anaerobic Digestion [https://anaerobic-digestion.com/anaerobic-digestion-technology/high-solids-anaerobic-digestion/]
- 50. Types of Anaerobic Digesters: Comprehensive Comparison [https://greengasinc.com/energy/types-of-anaerobic-digesters/]
- 51. Anaerobic Digestion: Comparison of Wet and Dry Systems [https://www.renergon-biogas.com/en/comparison-wet-dry-anaerobic-digestion/]
- 52. Characterization and quantitively analysis on the high solid ... [https://www.sciencedirect.com/science/article/pii/S0960148124023942]
- 53. Anaerobic System Design and Technology [https://www.epa.gov/agstar/anaerobic-system-design-and-technology]
- 54. BPC® Bioreactors [https://bpcinstruments.com/bpc_products/bioreactors/]
- 55. Biogas Production from a Solar-Heated Temperature ... [https://www.mdpi.com/2071-1050/16/22/9894]
- 56. Integration of solar passive heating strategies in low-cost ... [https://pubs.rsc.org/en/content/articlehtml/2025/se/d5se00441a]
- 57. Optimizing Anaerobic Digestion at Ambient Temperatures [https://www.mdpi.com/2073-4441/15/14/2653]
- 58. Design and experimental validation of a thermal model for ... [https://www.sciencedirect.com/science/article/abs/pii/S0360544225032748]
- 59. Biomethane: how to turn waste into renewable energy [https://www.galileotechnologies.com/galileo-insights/biomethane-the-renewable-gas-is-already-among-us]
- 60. Recent Progresses and Future Perspective of Biogas- ... [https://ui.adsabs.harvard.edu/abs/2025BioER..18...80M/abstract]
- 61. Cryogenic Technologies for Biogas Upgrading: A Critical ... [https://www.mdpi.com/2227-7080/13/8/364]
- 62. Biogas Upgrading 2025: Why Our Advanced Amine ... [https://www.ssgaslab.com/biogas-upgrading-2025-advanced-amine-vs-psa-cbg-plants.html]
- 63. 6 Biogas Trends to Watch in 2025 [https://www.fastechus.com/blog/biogas-trends/]
- 64. Cryogenic Technologies for Biomethane Production: A Critical ... [https://sciety-discovery.elifesciences.org/articles/by?article_doi=10.20944/preprints202507.1721.v1]
- 65. The Future of Anaerobic Digestion: Challenges and ... [https://pmc.ncbi.nlm.nih.gov/articles/PMC12109329/]
- 66. Recent Advances and Future Perspectives in Catalyst ... [https://www.mdpi.com/2071-1050/17/16/7370]
- 67. Characteristics, Process Parameters, and Inner Components ... [https://pmc.ncbi.nlm.nih.gov/articles/PMC3920971/]
- 68. Analysis of Process Parameters for Anaerobic Digestion ... [https://www.celignis.com/ad-process-parameters.php]
- 69. Volatile Fatty Acid Production vs. Methane and Hydrogen ... [https://www.mdpi.com/2311-5637/11/4/172]
- 70. Sample preparation, preservation, and storage for volatile fatty ... [https://pmc.ncbi.nlm.nih.gov/articles/PMC6999426/]
- 71. Predictive Modelling of Volatile Fatty Acid Production in ... [https://ui.adsabs.harvard.edu/abs/2025WBioV..16.3925R/abstract]
- 72. Ammonia inhibition and toxicity in anaerobic digestion [https://www.sciencedirect.com/science/article/pii/S2214714419302107]
- 73. Ammonia inhibition in anaerobic digestion of organic waste [https://link.springer.com/article/10.1007/s13762-024-06029-1]
- 74. Control of accumulated volatile fatty acids by recycling ... [https://pmc.ncbi.nlm.nih.gov/articles/PMC6148226/]
- 75. A new strategy to recover from volatile fatty acid inhibition ... [https://www.sciencedirect.com/science/article/abs/pii/S0960852420307732]
- 76. Approaches to mitigation of hydrogen sulfide during ... [https://www.sciencedirect.com/science/article/pii/S2405844023069761]
- 77. Enhanced Methane Production by Alleviating Sulfide ... [https://pubmed.ncbi.nlm.nih.gov/32006760/]
- 78. Sulfide inhibition of anaerobic degradation of lactate and ... [https://www.sciencedirect.com/science/article/pii/004313549190030T]
- 79. Adaptation of Anaerobic Digestion Microbial ... [https://pmc.ncbi.nlm.nih.gov/articles/PMC10785762/]
- 80. Enhanced volatile fatty acids accumulation in anaerobic ... [https://profiles.wustl.edu/en/publications/enhanced-volatile-fatty-acids-accumulation-in-anaerobic-digestion]
- 81. Foam Formation in Anaerobic Digesters [https://www.sciencedirect.com/science/article/abs/pii/S2468012518300014]
- 82. Common Anaerobic Digester Foaming Issues & Solutions [https://blog.anaerobic-digestion.com/?p=15093]
- 83. Foam formation during anaerobic digestion of sugar beet ... [https://www.sciencedirect.com/science/article/pii/S0960852425011472]
- 84. Comparative study on factors affecting anaerobic digestion of ... [https://pmc.ncbi.nlm.nih.gov/articles/PMC3431276/]
- 85. Influence of low pH on continuous anaerobic digestion ... [https://www.sciencedirect.com/science/article/abs/pii/S0043135417300775]
- 86. pH-Based Control of Anaerobic Digestion to Maximise ... [https://www.mdpi.com/2073-4441/15/3/417]
- 87. Enhancing Anaerobic Digestion of Agricultural By-Products [https://pmc.ncbi.nlm.nih.gov/articles/PMC12561102/]
- 88. Intermittent fasting for microbes: how discontinuous feeding ... [https://biotechnologyforbiofuels.biomedcentral.com/articles/10.1186/s13068-018-1279-5]
- 89. Effect of Hydraulic Retention Time and Organic-Loading ... [https://www.mdpi.com/2311-5637/8/11/620]
- 90. Advancements in anaerobic digestion of organic waste for ... [https://pubmed.ncbi.nlm.nih.gov/40711732/]
- 91. A metagenomic approach to demystify the anaerobic ... [https://www.frontiersin.org/journals/microbiology/articles/10.3389/fmicb.2024.1437098/full]
- 92. Metagenomic Analysis of Anaerobic Microbial ... [https://pmc.ncbi.nlm.nih.gov/articles/PMC9959488/]
- 93. Connecting microbial community assembly and function [https://www.sciencedirect.com/science/article/abs/pii/S1369527424000882]
- 94. Advances and Challenges in Anaerobic Digestion for ... [https://www.mdpi.com/2227-9717/13/11/3648]
- 95. Process parameters and changes in the microbial community ... [https://amb-express.springeropen.com/articles/10.1186/s13568-016-0219-7]
- 96. Chemical Optimisation and Microbial Analysis of Biogas ... [https://www.preprints.org/manuscript/202502.0425]
- 97. Anaerobic digestion optimization through thermal… [https://www.thembrsite.com/features/anaerobic-digestion-optimization-through-thermal-hydrolysis-pre-treatment]
- 98. Optimization of Anaerobic Digestion Processes of Organic ... [https://openbiotechnologyjournal.com/VOLUME/19/ELOCATOR/e18740707389877/FULLTEXT/]
- 99. Kinetic modeling and optimization of biogas production ... [https://www.sciencedirect.com/science/article/abs/pii/S2213138825002267]
- 100. Comparative evaluation of mechanistic models for biogas ... [https://www.sciencedirect.com/science/article/abs/pii/S0301479725025903]
- 101. Biogas Market Analysis, Size, and Forecast 2025-2029 [https://www.technavio.com/report/biogas-market-industry-analysis]
- 102. Potential substrates for biogas production through ... [https://www.sciencedirect.com/science/article/pii/S2405844024166637]
- 103. High methane yields in pilot-scale two-stage anaerobic ... [https://www.sciencedirect.com/science/article/abs/pii/S0961953407000918]
- 104. Fact Sheet | Biogas: Converting Waste to Energy [https://www.eesi.org/papers/view/fact-sheet-biogasconverting-waste-to-energy]
- 105. A critical review of food waste and poultry manure ... [https://www.frontiersin.org/journals/sustainable-food-systems/articles/10.3389/fsufs.2025.1695945/full]
- 106. Anaerobic Digestion of Animal Manure and Influence ... [https://www.frontiersin.org/journals/energy-research/articles/10.3389/fenrg.2021.740314/full]
- 107. Biogas Market Size, Growth & Key Players & Forecast ... [https://www.maximizemarketresearch.com/market-report/global-biogas-market/29082/]
- 108. IEA Report Highlights Rapid Growth in the Global Biogas ... [https://www.worldbiogasassociation.org/iea-report-highlights-rapid-growth-in-the-global-biogas-industry/]
- 109. Biogas Market Size, Growth and Forecast 2025 [https://www.thebusinessresearchcompany.com/report/biogas-global-market-report]
- 110. IEA's 2025 Outlook for Biogas and Biomethane [https://www.worldbiogasassociation.org/ieas-2025-outlook-for-biogas-and-biomethane/]
- 111. Biogas Market Report | Industry Analysis, Size & Growth ... [https://www.mordorintelligence.com/industry-reports/biogas-market]
- 112. Biogas-biomethane-green-gas - Shop [https://www.cedigaz.org/publications/biogas-biomethane-green-gas/]
- 113. Renewable Energy Directive [https://energy.ec.europa.eu/topics/renewable-energy/renewable-energy-directive-targets-and-rules/renewable-energy-directive_en]
- 114. Biomethane - Energy - European Commission [https://energy.ec.europa.eu/topics/renewable-energy/bioenergy/biomethane_en]
- 115. 2025 Predictions: Anaerobic Digestion and Innovations in ... [https://wasteadvantagemag.com/2025-predictions-anaerobic-digestion-and-innovations-in-sustainable-waste-management/]
- 116. ABC's Data Digest LITE July 2025: Primary End-Use of ... [https://americanbiogascouncil.org/abcs-data-digest-lite-july-2025-primary-end-use-of-biogas/]
- 117. Policy frameworks and voluntary markets for biomethane [https://www.sciencedirect.com/science/article/abs/pii/S0301421521001610]
- 118. Potential for manure-based anaerobic digestion [https://www.ieabioenergy.com/blog/publications/potential-for-manure-based-anaerobic-digestion/]
- 119. Work Programme | Task 37 | Energy from Biogas [https://task37.ieabioenergy.com/work-programme/]
- 120. Anaerobic Digesters Market Outlook 2025-2032 [https://www.intelmarketresearch.com/anaerobic-digesters-market-14070]
- 121. Reasons for biogas optimism despite global challenges [https://www.worldbiogasassociation.org/member-press-release-opinion-piece-reasons-for-biogas-optimism-despite-global-challenges/]